
The Effect of Socioeconomic Drivers on Under-five Mortality Rates: A Survey Bayesian Meta-analysis Study
Abstract
Background
Studies on approaches for combining information from related studies have been well-documented in the literature. However, limited research has been conducted to focus on the issue of combining parameter estimates in the context of under-five mortality.
Objectives
The objective of this study was to study the overall effect of socioeconomic factors on under-five mortality, considering the censoring problem and survey design features.
Methods
This study estimates the overall effect of risk factors on under-five mortality in four countries from the sub-Saharan African region using Bayesian hierarchical meta-analysis. The data used in the study is from the previous four demographics and health surveys for a research area.
Results
The results obtained using the Bayesian Meta Cox PH model are almost similar to those using the extended Cox except for one key finding. A child from a rural area has an increased risk of dying compared to a child from an urban area. Whereas it is insignificant when using the extended Cox model.
Conclusion
The study has demonstrated drivers of child mortality using Bayesian hierarchical meta-analysis.
1. INTRODUCTION
Globally, combining regression parameters of related study results has been largely dealt with in recent years in medical research and epidemiology. Meta-analysis of combining regression slopes has received minimal attention in Synthesis analysis [1]. This is due to many complications and controversial problems when a set of standard regression model parameters are combined. That is because standard regression parameters come from a regression model with different predictors representing different regression coefficients; this results in an inaccurate direct combination of regression slope [2]. The results of regression, such as multiple regression and multilevel linear modelling, have been largely ignored for synthesis analysis due to insufficient knowledge to synthesise complex study indices and assumptions concerning the synthesis procedure [1, 2]. Synthesis analyses are normally influenced by sample size, publication language, and the study design [3]. Researchers in the field of epidemiology, biostatistics, and social science may want to deal with confounding explanatory variables. For the primary study, this is conducted by considering the confounding variable in a complex model [1]. Synthesis analysis of regression analysis has the possibility of providing a more accurate impact of the explanatory variable on the outcome variable after controlling other variables and obtaining reasonable precision due to the large sample size [1-4]. Primary studies cannot detect the size of the effect estimate; thus, meta-analysis enables a researcher to detect [1].
Many studies have been conducted on Synthesis Analysis [1-6]. For example, Shim and Kim [5] described the approaches available for quantitative analysis in a meta-analysis using R software. Rodríguez-Barranco et al. [4] developed formulae that enable the expression of results from ordinary linear regression models with different transformations in a log scale on the response or explanatory variables. Fernández-Castilla et al. [2] proposed a new approach to allow the use of information that regression slopes from several regression models to obtain an accurate estimate of the impact of the explanatory variable after controlling other variables. Another study by Peterson and Brown [6] used correlation coefficients as the effect size to investigate corresponding beta coefficients and correlation coefficients from published articles. However, limited research considers a survey’s design features, handles censoring, and combines parameter estimates to get a more accurate effect of Moderators in the Bayesian perspective. Design features constitute clustering, stratification, and weighting.
Under-five mortality is a public health factor related to a child’s well-being, family, and community. It is also the indicator of community health development and socioeconomic status. Understanding Socioeconomic factors is crucial for developing policies to reduce under-five mortality in a community and achieve Sustainable Development Goals (SDGs) by 2030. Child mortality in Sub-Saharan Africa is a critical issue that has been extensively studied by researchers. Factors contribute to high child mortality rates in the region, including socioeconomic, healthcare-related, and environmental factors. Studies by Khan et al. [7] and Hug et al. [8] highlight the positive association between maternal education and child health outcomes.
The objective of this study was to study the effects of socioeconomic factors on under-five mortality, considering of censoring problem and survey design features into perspective, Furthermore, the study combines survey Cox regression parameters.
2. MATERIALS AND METHODS
2.1. Study Area and Data Sources
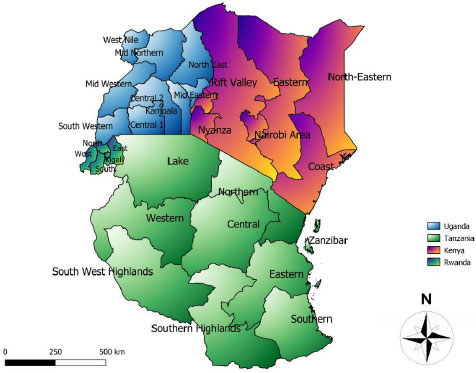
The data used in this study are based on four recent secondary survey data on four countries located in the east sub-Saharan African region for 20 years from the Demographic health survey program on https://dhs program.com/ Namely Rwanda, Tanzania, Kenya and Uganda. These surveys are nationally representative of information on childhood mortality obtained in the birth files of women included in the survey. Such surveys are designed to update or estimate health and demographics. Fig. (1) represents the study areas of interest: Tanzania, Rwanda, Uganda, and Kenya. The data were obtained from a demographic health survey program.
2.2. Study Variables
The outcome variables considered in this study are the survival times of childhood mortality measured in months from birth until an event occurs or censored of a child below 60 months or five years old and considered based on a reference period. Children are considered based on their lives starting within the reference period selected. Children who died within the reference period are taken as uncensored cases; otherwise, they are censored. Also, six explanatory variables were considered in this study and may be classified as socioeconomic variables. These variables are the sex of the child, breastfeeding, education level, household income, family size, and type of place of residence.
2.3. Methods
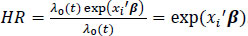
The Cox proportional hazard survey regression model was adopted at the first of the analysis to obtain effective size, namely, hazard ratios with corresponding standard errors to be used at the second level of the analysis. The Survey Cox regression model addresses the problem of censoring while accounting for survey design [9-13]. Censoring is important to consider in survival analysis because failing to account for it properly can lead to biased or inaccurate estimates of survival probabilities and other related measures [9, 14, 15]. The presence of censoring introduces uncertainty into the analysis, as the exact time of the event is unknown for censored individuals [14-16]. The hazard ratio is the exponentiated linear part of the model, which describes the effect of one or more explanatory variables. The model addresses the censoring problem and the complex nature of the survey design. The ordinary Cox regression model is given by
 |
(1) |
here, λ0(t) is the baseline hazard function at time t, xi is a vector of model explanatory of individual ith at time t, and β is the vector of unknown regression parameters, and they are assumed to be the same for all observations in the study. If we divide equation 1 by the baseline hazard function, we obtain.
 |
(2) |
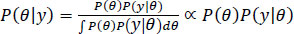
The study adopts meta-analysis on a set of two groups, survival studies that may have censored data issues. Meta-analysis involves systematically collecting, evaluating, and synthesizing the results of individual studies to obtain an overall estimate of the effect size or association, increasing the statistical power and generalizability of the findings [17, 19], [20, 21] The log hazard ratios and the corresponding standard errors summarise each of the studies [19, 20]. We want to increase the statistical power of the overall results by integrating results across studies and having an overall interpretation of all studies. The fixed effect is considered and assumes homogeneity of study results. The Bayesian approach is based on several philosophies involving the test and intervals and is important for updating evidence [22-24]. The Bayesian analysis consists of three main parts: Prior, likelihood, and posterior distribution. A prior distribution represents the initial beliefs or knowledge about uncertain variables before observing any data [21, 22]. It is an essential component of Bayesian analysis and can be updated to a posterior distribution using Bayesian inference. Initially, uncertainty under Bayesian is expressed by a prior distribution of quantities of the study interest. Then, data and assumptions on their generations are summarised in the likelihood, combining prior distribution and the likelihood yield posterior distribution for the quantities of interest in a study [25-27]. The posterior distribution is often given as a point estimate and credible interval, and Bayesian is often carried out using WinBUGS, INLA, STAN, and rjags package in R.
 |
(3) |
where θ is the parameter of interest, y is the observed data, P(θ) denotes prior distribution, and P(y) denotes the likelihood. In the context of this study, the prior distribution represents the uncertainty of the effect being measured, such as risk ratios, odds ratios, and hazard ratios. They are expressions of subjective beliefs concerning the size of the effect and the size of the prior distribution shows the degree of uncertainty about the quantity of interest [26, 28, 29]. If there is less or non-information, a non-informative prior may be used and in a meta-analysis, the use of a non-informative prior often shows a position of prior ignorance [25].
2.4. Ethical Considerations
Addressing the impact of socioeconomic factors on under-five mortality requires careful consideration of ethical principles. The data used in this study was obtained from the Demographic Health Survey Progress website on request. Data should be anonymized and stored securely to prevent unauthorized access or misuse. The study does not identify the household location in each country.
3. RESULTS AND DISCUSSION
3.1. Descriptive Analysis
The total number of children (1511550) included 12278 (8.1%) who experienced the event before their fifth birthday in Kenya. Of 120371 children included in the study from Rwanda, 17614(14.6%) died before their fifth birthday. A total of 109455 children were included in the study, with 12749 (11.7%) dying before their fifth birthday in Tanzania.
3.2. Bayesian Meta-analysis for Survey Data
Table 1 displays the Effect size, the mean, the median, the standard error, and the credible interval of the four countries of interest. The hazard ratio for education level (secondary or higher) means 0.602 with credible interval (CI) [0.583 – 0.6222]. The credible interval does not include one. This means that education level is significantly associated with child deaths; having secondary or higher education reduces child death. Lower levels of maternal education are associated with suboptimal child health practices, such as inadequate healthcare utilization, lower awareness of preventive measures, and poorer management of childhood illnesses, ultimately increasing the risk of child mortality. The effect size of a child’s place of residence (rural) is 1.138 with CI [1.108 – 1.168]. This does not include one; thus, the place of residence is significantly associated with child death. A child from a rural area has an increased risk of dying compared to a child from an urban area. Rural areas tend to have higher levels of poverty and lower socioeconomic development compared to urban areas. Poverty is associated with limited access to nutritious food, clean water, sanitation facilities, and healthcare services, all of which are crucial for child health and survival. Rural areas often face challenges in terms of healthcare infrastructure, availability of skilled healthcare professionals, and access to essential health services. Limited access to healthcare can lead to delayed or inadequate treatment of childhood illnesses and exacerbate the risk of child mortality (Table 2).
The effect size of the child sex is 1.140 with CI [1.121 – 1.157], which means the sex of the child (female) has an increased risk of dying before the fifth birthday. The effect size of breastfeeding status (yes) is 0.817 with CI [0.801 – 0.833], which does not include one; thus, economic well-being is associated with child mortality. Studies conducted by [29] and [30], suggest that being part of a larger family is associated with an increased risk of child mortality, even after controlling for other factors such as socioeconomic status and maternal education. Such studies highlight the importance of family planning and reproductive health interventions in reducing child mortality. The effect size of economic well-being (rich) is 0.833 with CI [0.728 – 0.637], which means that the average risk of a child dying from a rich household is lower than a child from a poor household. A family size greater than seven reduces child mortality. Poorer households often face barriers in accessing quality healthcare, including limited financial resources, lack of health insurance, and distance from healthcare facilities [31]. As a result, children from poor households are more likely to experience delays in receiving necessary healthcare, leading to increased child mortality rates. Poorer households often lack access to safe water sources and adequate sanitation facilities. This increases the risk of waterborne diseases and infections among children, leading to higher child mortality rates.
| County | Dead(percentage) | Censored(percentage) | Total |
|---|---|---|---|
| Kenya | 12278 (8.10) | 139272 (91.90) | 151550 |
| Rwanda | 17614 (14.63) | 102757 (85.67) | 120371 |
| Tanzania | 12749 (11.65) | 96706 (88.35) | 109455 |
| Uganda | 17460 (12.50) | 122555 (87.50) | 140015 |
| - | - | - | - | 95% Credible Interval | - | |
|---|---|---|---|---|---|---|
| Variables | Effect Size | Mean | SD | 2.5% | 97.5% | Median |
| Education level | - | - | - | - | - | - |
| Primary or below | Reference | 1.000 | - | - | - | - |
| Secondary or higher | HR | 0.6020 | 0.0191 | 0.5827 | 0.6222 | 0.6190 |
| d | -0.5076 | 0.0167 | 0.5401 | 0.4744 | 0.5076 | |
| Residence | - | - | - | - | - | - |
| Urban | Reference | 1.0000 | - | - | - | - |
| Rural | HR | 1.1379 | 0.0152 | 1.1083 | 1.1680 | 1.1379 |
| d | 0.1291 | 0.0134 | 0.1028 | 0.1550 | 0.1292 | |
| Household Income | - | - | - | - | - | - |
| Poor | Reference | 1.0000 | - | - | - | - |
| Rich | HR | 0.8169 | 0.0081 | 0.8011 | 0.8328 | 0.8169 |
| d | -0.2023 | 0.0100 | -0.2218 | -0.1830 | 0.2022 | |
| Breastfeeding status | - | - | - | - | - | - |
| No | Reference | 1.0000 | - | - | - | - |
| Yes | HR | 0.8631 | 0.0079 | 0.8478 | 0.8787 | 0.8631 |
| d | -0.1472 | 0.0092 | -0.1651 | -0.1293 | 0.1472 | |
| Family size | - | - | - | - | - | - |
| Seven or less | Reference | 1.0000 | - | - | - | - |
| Eight plus members | HR | 0.7198 | 0.0102 | 0.7001 | 0.7400 | 0.7198 |
| d | -0.3288 | 0.0142 | -0.3565 | -0.3012 | 0.3288 | |
| Sex of child | - | - | - | - | - | - |
| Male | Reference | 1.0000 | - | - | - | - |
| Female | HR | 1.1396 | 0.0092 | 1.1214 | 1.1573 | 1.1395 |
| d | 0.1306 | 0.0081 | 0.1146 | 0.1461 | 0.1306 |
4. LIMITATIONS
The limitations may affect the generalizability, accuracy, and reliability of the study findings. In survey research, nonresponse occurs when selected individuals choose not to participate or fail to complete the survey. Nonresponse bias can arise if those who choose not to participate or complete the survey systematically differ from those who do participate, leading to a biased sample and potentially impacting the generalizability of the findings. Survey data are typically collected on predetermined variables and may not capture the complexity and nuances of certain phenomena. Survey data often relies on a sample of individuals or households, which may not be representative of the entire population. Sampling bias can occur if certain groups are underrepresented or excluded from the sample, leading to biased results that may not accurately reflect the broader population. Survey data can provide information on associations between variables but may have limitations in establishing causal relationships. The cross-sectional nature of most survey designs makes it challenging to determine relationships' directionality or account for the temporal sequencing of events. Bayesian meta-analysis often involves complex computations, especially when dealing with large datasets or models with many parameters. This can lead to computational challenges, requiring specialized software, substantial computing resources, or longer computation times. Bayesian meta-analysis results can be sensitive to the choice of priors. Bayesian meta-analysis requires the specification of prior distributions, representing the researcher's beliefs about the parameters before observing the data.
CONCLUSION
Under-five mortality remains a significant challenge in developing countries, but progress has been made in reducing child mortality rates globally. In this study, it has been demonstrated the use of Bayesian meta-analysis to study the overall effect of socioeconomic factors on under-five mortality, considering the censoring problem and survey design features. We found that a child from a mother with secondary and higher education has a reduced chance of dying, a child from a rural area has an increased risk of dying, and a child from a rich household has a reduced chance of dying.
Social determinants of health, such as maternal education, rural residence, and household wealth, are influencing the child's risk of mortality. To address these disparities and improve child health outcomes. The study recommends the implementation of policies and programs that promote access to quality education, especially for girls and women, as maternal education has been shown to have a significant impact on child health. Investment in healthcare facilities, resources, and trained healthcare professionals in rural areas to improve access to quality healthcare services. Implement policies that aim to reduce income inequalities and promote economic opportunities for all. This can include job creation, vocational training, and social safety nets to ensure families from lower-income households have access to basic needs and resources. Establish robust monitoring and evaluation systems to track progress, identify gaps, and inform evidence-based interventions. Regular data collection and analysis can help identify areas of improvement and guide targeted interventions.
AUTHORS' CONTRIBUTIONS
WJD conceptualised and analysed the literature. All others were involved in the drafting process and helped in comparison and analysis. All authors read and approved the final manuscript.
ABBREVIATION
| SDGs | = Sustainable Development Goals |
ETHICS APPROVAL AND CONSENT TO PARTICIPATE
Not applicable.
HUMAN AND ANIMAL RIGHTS
No animals/humans were used in this research.
CONSENT FOR PUBLICATION
Not applicable.
AVAILABILITY OF DATA AND MATERIALS
The data and supportive information are available within the article.
FUNDING
None.
CONFLICT OF INTEREST
The authors declare no conflict of interest, financial or otherwise.
ACKNOWLEDGEMENTS
The authors acknowledge the University of Zululand and the University of KwaZulu-Natal Department of Mathematical Science, the School of Mathematics, Statistics and Computer Science for the support to conduct this research work, the authors on the literature and DHS program for the data to study the levels and trends.

