
Disability-adjusted Life Years of Hepatitis B in Iran during 2009–2019: An Analysis Based on the Global Burden of Disease Study 2019
Authors Info & Affiliations
Abstract
Background and Purpose
Hepatitis B virus infection is currently among the ten leading causes of death from infectious diseases in the world. The aim of the current study is spatial analysis related to life years adjusted by hepatitis B disability in Iran from 2009 to 2019.
Materials and Methods
The study is ecological. Using data from the Global Burden of Diseases (GBD), cause-specific mortality served as the basis for estimating disability-adjusted life years (DALYs). Time trend analysis of DALYs attributed to hepatitis B from 2009 to 2019 and spatial pattern analysis and identification of high-risk and low-risk clusters of DALYs attributed to hepatitis B in Iranian provinces were performed. Time trend changes were evaluated using joinpoint regression analysis.
Results
The most likely high-risk cluster with LLR=238.59 in the West of Iran includes the western provinces of the country (Lorestan, Kermanshah, Hamedan, Markazi, Khuzestan, and Ilam) (relative risk of occurrence 2.31). The three provinces of Lorestan (RR=2.22), Sistan and Baluchistan (RR=1.73), Golestan (RR=1.46) have the highest relative Khazar, and the three provinces of Gilan (RR=0.41), Mazandaran (CIR=0.48) and Kurdistan (CIR=0.51) had the lowest relative risk. During the years 2009 to 2019, the total DALYs decreased by 1.5% annually (p<0.05).
Conclusion
According to the results of the disease control and prevention programs, it can be effective in reducing the disease burden in the country by giving priority to the provinces that are among the high-risk disease clusters.
1. INTRODUCTION
The Sustainable Development Goals (SDG) recognized viral hepatitis as a global development priority in years 2015 and proposed the goal of SDG-2030 to “combat hepatitis” [1]. In parallel, the World Health Assembly endorsed the World Health Organization (WHO) strategy to eliminate hepatitis as a public health threat by 2030, which the WHO described as reducing new infections by 90% and mortality Defined up to 65% [2]. However, it is predicted that by 2040, the deaths caused by chronic hepatitis will exceed the total deaths related to HIV infection, tuberculosis, and malaria [3]. The hepatitis B virus (HBV) is one of the main risk factors for cirrhosis and hepatocellular carcinoma and a public health concern, especially in developing countries [4, 5]. It is estimated that 257 million people in the world are living with HBV infection [4, 6]. Since many people with chronic hepatitis B are not properly identified and treated, they are at risk of developing cirrhosis, liver failure, and hepatocellular carcinoma [4]. In years 2017, there were 13.8 million new cases of chronic HBV worldwide. Globally, the number of deaths caused by hepatitis B increased from 580.5 thousand in 1990 to 799.0 thousand in years 2017 [3]. In the Eastern Mediterranean region, the estimated prevalence of hepatitis B is close to 3.3% [7]. The prevalence of hepatitis B is different in Iran's neighboring countries. In Turkey [8], Pakistan [9], Afghanistan [10] and Iraq [7] it is 4.5%, 4.3%, 1.9% and 1.6% respectively. In Iran, according to a recent meta-analysis of survey studies, the prevalence of hepatitis B was approximately 2% [11, 12]. In 2017, HBV-related DALY and mortality were estimated to be 107.2 years and 3.7 per 100,000 in Iran, respectively [7].
Therefore, it is important to screen provinces at risk for chronic HBV infection to place the identified individuals under hepatitis care [4]. On the other, knowing the burden of viral hepatitis diseases and its temporal trends at the global, regional, and national levels is important for updating prevention strategies, reallocating limited medical resources, and for successfully realizing and finally exceeding the goals for elimination. The world is very important. GBD provides a unique tool for assessing current epidemiology, trends over time, disparities in burden, and progress toward elimination goals across sites [3]. Here, we provide a detailed report of estimates for hepatitis B disease burden from GBD 2019 to improve our understanding of disease burden over time and in different locations for prioritization and planning and delivery of health services. With hepatitis B disability-adjusted life years in Iran during 2019-2009: an analysis based on the 2019 Global Burden of Disease Study.
2. MATERIALS AND METHODS
2.1. Study Design and Setting
The present study is a type of ecological study that was conducted using the Exploratory mixed design method. Exploratory means that these types of studies investigate and discover health-related phenomena, and mixed means that in these studies, the factor of location (multiple-group study) and time (time-trend study) are both evaluated and measured together [13]. In the present study, the amount of DALYs attributed to hepatitis B has been evaluated over time and in different places in Iran.
2.2. Sources of Data Collection and Calculation of DALYs
The Burden of diseases study is the most comprehensive and accurate global epidemiological study. it is the result of examining 359 diseases and injuries and 84 health risk factors in 195 countries and regions of the world (including developed and developing countries). Information about the burden of disease index, years of life lost due to premature death, and years of life lost due to disability are freely available to researchers on the Global Burden of Disease website.
2.3. Disability-adjusted Life Years (DALY)
DALY is a type of health gap index that calculates the years of life lost, either due to premature death or due to non-fatal diseases. This index was defined and used in the Global Burden of Diseases and Injuries (GBD) study to calculate the burden of diseases [14, 15].
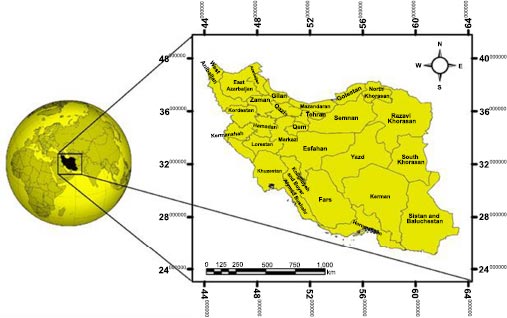
Location and description of the study site: Iran is a country in Southwest Asia with an area of 1,648,195 km2 located in the Middle East region. According to the latest World Meter statistics, the population of Iran in June 2020 is estimated at 8,618,234 people, which is the 18th most populous country in the world. Iran lies between 25° 3′ and 39° 47′ N in latitude and between 44° 5′ and 63° 18′ E in longitude. The geographical location of Iran is shown in Fig. (1).
2.4. Analysis
The statistical analysis consisted of three main parts: 1- descriptive analysis, 2- analysis of the time trend of DALYs attributed to hepatitis B from 2009 to 2019, 3- spatial pattern analysis and identification of high-risk and low-risk clusters of DALYs attributed to hepatitis B in the provinces of Iran.
2.5. Time Trend Analysis
To check the time trend, first, the total and average DALYs attributed to hepatitis B during each of the years 2009 to 2019 were obtained, then the changes in the time trend were obtained using Joinpoint regression analysis and the latest version of Joinpoint Regression Program version 4.7.0.0 0 - February 26, 2019, was evaluated. In the joint point regression analysis model, the total and average DALYs (per 100,000 people) were considered as the dependent variable and the year as the independent variable. Finally, considering that the dependent variable followed the Poisson distribution, the natural log-linear model was used to obtain the values of Annual Percent Change (APC) and Average Annual Percentage Change (AAPC). Also, the Grid Search method was used to identify join points, and the Monte Carlo method was used to estimate the p-value with 4499 repetitions. Bayesian information criterion (BIC) and Sum of Squared Errors (SEE) were used to select the best model (model selection) that had goodness of fit [16, 17].
2.6. Spatial Pattern Analysis and Cluster Identification
In the next step, to evaluate the spatial pattern, the number of DALYs attributed to hepatitis B was obtained in each of the provinces during the years 2009 to 2019, and then the zoning of DALYs in Iran was drawn using ArcGIS 10.3 environment. To evaluate the degree of spatial autocorrelation (Spatial Autocorrelation) of the disease, the Global Moran's I index was used. The range of this statistic is from +1 to -1, and the higher the value of this statistic goes to +1, it indicates that it is clustered and Anything that moves towards -1 indicates dispersion of the desired phenomenon [18].
Kuldorff's purely spatial scan statistic embedded in the SaTScan software was used to identify the exact location of primary and secondary high-risk and low-risk clusters and also to estimate the relative risk of DALYs in each of Iran's provinces. Due to the numerical and discrete nature of the number of DALYs in each province, discrete Poisson distribution and a circular window were used to detect clusters. The window whose Log-likelihood ratio (LLR) was maximized was reported as the primary or most likely cluster (a cluster that has a low probability of occurring by chance) and other windows with lower LLR were reported as the Secondary cluster. (a cluster that is more likely to have occurred by chance) [19, 20]. The statistical significance of clusters was obtained by Monte Carlo simulation with a maximum number of 999 repetitions. The relative risk in Kuldorff's spatial scan statistic is estimated using the following equation.
 |
where c is the number of DALYs observed inside the window, E[c] is the expected number of DALYs inside the window, C-c is the number of DALYs observed outside the window, and E[C]-E[c] is the expected number of DALYs outside the cluster. In this study, for Determination of the optimal radius window for spatial cluster analysis, we used the Gini Optimized Cluster Collection method, which has recently been shown that the Gini coefficient can identify several non-overlapping clusters in a more pure, local and more realistic [21, 22]. The optimal radius window in this study was 10%. Finally, the relative risk of DALYs attributed to hepatitis B in all provinces of Iran was estimated and its zoning was drawn in the GIS environment.
3. RESULTS
The results related to the spatial distribution of cumulative DALYs attributed to hepatitis B in each of Iran's provinces are shown in Fig. (2) and the annual DALYs during the years 2009 to 2019 in Table 1.
3.1. Results of Spatial Autocorrelation and Cluster Identification
Global Moran's I index value of 0.298 was obtained, which indicates high autocorrelation and a high tendency of DALYs to cluster in Iran. (P-value = 0.024). The results of detecting high-risk and low-risk clusters by the Gini-optimized method are shown in Fig. (3). As can be seen, a total of 5 important spatial clusters were discovered, which included 2 high-risk clusters and 3 low-risk clusters.

(source: Global Burden of Disease)
| The Provinces | DALY per 100000 | ||||||||||
|---|---|---|---|---|---|---|---|---|---|---|---|
| 2009 | 2010 | 2011 | 2012 | 2013 | 2014 | 2015 | 2016 | 2017 | 2018 | 2019 | |
| Alborz | 13.71 | 13.6 | 13.58 | 13.44 | 13.34 | 13.31 | 13.31 | 13.25 | 13.59 | 13.51 | 13.53 |
| Ardebil | 22.03 | 21.56 | 21.6 | 21.71 | 21.89 | 22.1 | 22.42 | 22.31 | 22.62 | 22.43 | 22.44 |
| Bushehr | 18.16 | 17.43 | 16.75 | 16.13 | 15.63 | 15.17 | 14.74 | 14.22 | 14.15 | 13.86 | 13.7 |
| Chahar Mahall and Bakhtiari | 13.67 | 13.5 | 13.35 | 13.28 | 13.22 | 13.19 | 13.17 | 12.89 | 12.85 | 12.59 | 12.5 |
| East Azarbaijan | 22.97 | 22.27 | 21.73 | 21.12 | 20.62 | 20.21 | 19.82 | 19.26 | 19.36 | 19.07 | 18.86 |
| Esfahan | 13.81 | 13.43 | 13.13 | 12.83 | 12.71 | 12.63 | 12.56 | 12.4 | 12.65 | 12.62 | 12.66 |
| Fars | 18.06 | 17.54 | 17.21 | 17.02 | 16.83 | 16.52 | 16.14 | 15.76 | 16.01 | 15.9 | 15.83 |
| Gilan | 8.297 | 8.011 | 7.963 | 7.792 | 7.568 | 7.487 | 7.482 | 7.505 | 7.703 | 7.751 | 7.798 |
| Golestan | 27.88 | 27.06 | 26.49 | 25.95 | 25.85 | 26.02 | 26.27 | 26.15 | 26.72 | 26.67 | 26.76 |
| Hamadan | 23.41 | 22.92 | 22.6 | 22.34 | 22.2 | 21.85 | 21.63 | 21.43 | 21.9 | 21.77 | 21.78 |
| Hormozgan | 13.74 | 13.2 | 13 | 12.68 | 12.35 | 11.98 | 11.63 | 11.22 | 11.27 | 11.15 | 11.1 |
| Ilam | 23.35 | 22.81 | 22.46 | 22.13 | 22.02 | 22.07 | 21.76 | 21.22 | 21.56 | 21.41 | 21.27 |
| Kerman | 22.12 | 21.48 | 20.83 | 20.16 | 19.5 | 19.08 | 18.64 | 18.17 | 18.44 | 18.34 | 18.39 |
| Kermanshah | 23.64 | 22.64 | 22.04 | 21.49 | 20.95 | 20.42 | 19.99 | 19.64 | 20.03 | 19.61 | 19.47 |
| Khuzestan | 26.52 | 25.66 | 24.99 | 24.11 | 23.61 | 22.91 | 22.18 | 21.65 | 21.96 | 21.72 | 21.62 |
| Kohgiluyeh and Buyer Ahmad | 21.32 | 20.91 | 20.58 | 20.23 | 19.89 | 19.42 | 18.83 | 18.25 | 18.2 | 17.64 | 17.32 |
| Kurdistan | 10.58 | 10.23 | 9.923 | 9.663 | 9.476 | 9.272 | 9.05 | 8.781 | 8.858 | 8.796 | 8.716 |
| Lorestan | 40.12 | 40.29 | 39.74 | 39.68 | 39.73 | 39.86 | 39.94 | 39.63 | 39.97 | 39.36 | 38.99 |
| Markazi | 21.75 | 20.54 | 19.56 | 18.84 | 18.36 | 17.98 | 17.85 | 17.56 | 17.82 | 17.64 | 17.61 |
| Mazandaran | 9.578 | 9.411 | 9.339 | 9.182 | 8.998 | 8.924 | 8.971 | 8.985 | 9.203 | 9.163 | 9.165 |
| North Khorasan | 25.69 | 25.07 | 24.77 | 24.53 | 24.42 | 23.98 | 23.48 | 22.77 | 22.87 | 22.32 | 22.08 |
| Qazvin | 17.36 | 16.99 | 16.76 | 16.56 | 16.47 | 16.41 | 16.39 | 16.06 | 16.25 | 16.09 | 16.05 |
| Qom | 30.2 | 28.15 | 26.29 | 24.67 | 23.63 | 22.49 | 21.83 | 21.45 | 21.72 | 21.56 | 21.49 |
| Razavi Khorasan | 20.37 | 19.51 | 18.98 | 18.56 | 18.09 | 17.41 | 16.69 | 15.95 | 15.99 | 15.59 | 15.39 |
| Semnan | 15.25 | 14.79 | 14.49 | 14.21 | 13.92 | 13.66 | 13.44 | 13.05 | 13.12 | 12.91 | 12.78 |
| Sistan and Baluchestan | 35.82 | 34.6 | 33.44 | 32.66 | 31.93 | 30.47 | 28.96 | 27.24 | 26.88 | 26.05 | 25.54 |
| South Khorasan | 25.06 | 24.22 | 23.34 | 22.64 | 21.99 | 21.2 | 20.6 | 19.95 | 19.93 | 19.32 | 18.99 |
| Tehran | 15.42 | 15 | 14.76 | 14.72 | 14.75 | 14.69 | 14.71 | 14.12 | 14.37 | 14.3 | 14.24 |
| West Azarbaijan | 16.69 | 16.04 | 15.64 | 15.32 | 15.13 | 14.86 | 14.59 | 14.26 | 14.47 | 14.31 | 14.24 |
| Yazd | 16.29 | 15.82 | 15.39 | 14.84 | 14.27 | 13.94 | 13.56 | 13.11 | 13.16 | 12.92 | 12.76 |
| Zanjan | 12.24 | 11.78 | 11.38 | 11.05 | 10.74 | 10.55 | 10.45 | 10.32 | 10.46 | 10.38 | 10.34 |
(source: Global Burden of Disease).
| Cluster Number in Fig. (6) | Risk | Number of Provincial Involved | Coordinate of Center | Radius(km) | Relative Risk | P-value | LLR | Cluster Type |
|---|---|---|---|---|---|---|---|---|
| 1 | High | 6 | 33.5 N & 48.8 E | 192.03 | 2.31 | <0.001 | 238.59 | Most likely |
| 2 | High | 2 | 37.4 N & 57. 2 E |
203.8 | 1.97 | <0.001 | 167.63 | Secondary |
| 3 | Low | 3 | 36.5 N & 48.4 E | 157.8 | 0.23 | <0.001 | 218.03 | Most likely |
| 4 | Low | 4 | 31.1 N & 53.2 E | 378.4 | 0.31 | <0.001 | 153.69 | Secondary |
| 5 | Low | 3 | 38.9 N & 51. 3 E |
181.31 | 0.45 | <0.001 | 131.72 | Secondary |
The full epidemiological, statistical, demographic, and geographic characteristics of the clusters discovered by Gini Optimized are shown in Table 2. According to the results of this table, it can be said that the most likely high-risk cluster with LLR=238.59 is located in the west of Iran (centered at 33.5 N & 48.8 E), which has a radius of 192.03 km and includes the provinces of Lorestan, Kermanshah, Hamadan, Markazi, Khuzestan. It was Ilam (cluster 1 in Fig. 3). In this cluster, the relative risk of incidence is estimated to be 2.31, which means that the amount of DALYs inside this cluster is 2.31 times that of the areas outside the cluster. Also, a secondary high-risk cluster with LLR=167.63 was identified in northeastern Iran, which included North Khorasan and Golestan provinces. On the other, the most probable low-risk cluster with LLR=218.03 was discovered in the northwestern part of Iran (centered at 36.5 N & 48.4 E), which had a radius of 157.8 km and included the provinces of Zanjan, Gilan, and Kurdistan (cluster 3 in Fig. 3). The relative risk in this cluster was estimated to be 0.23, which means that the amount of DALYs inside the cluster is lower than outside the cluster and 0.23 times. Two secondary low-risk clusters were identified in the central and northern regions of Iran (clusters 4 and 5 in Fig. 3), in which the relative risk was estimated at 0.31 and 0.45, respectively.

(source: Global Burden of Disease).
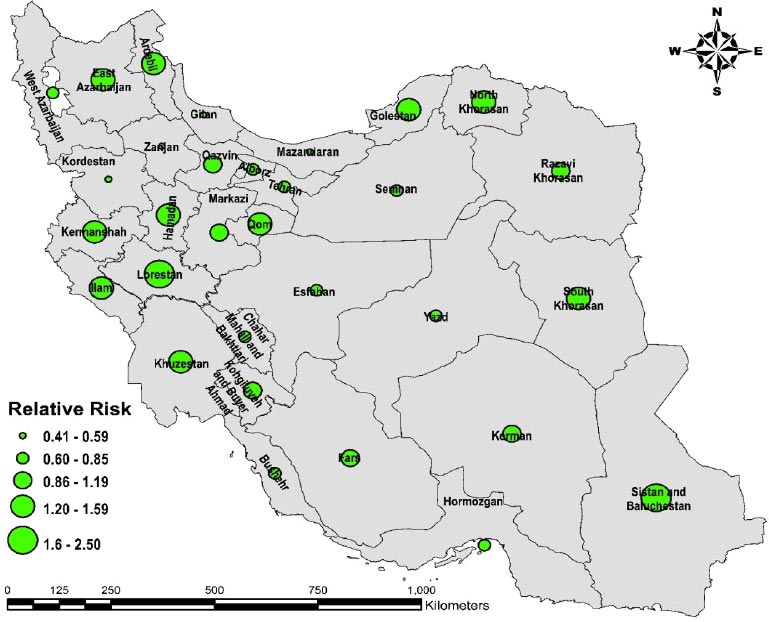
The relative risk of DALYs in all provinces was estimated using Kuldorff's spatial scan statistic, and finally, to illustrate the estimated RR values, a dotted map according to the estimated RR at the level of different provinces was produced in GIS (Fig. 4). As can be seen, these results were completely consistent with the results of the spatial distribution of DALYs in the provinces of Iran, such that high RR was observed in provinces with high DALYs, and low RR was observed in provinces with low DALYs. The three provinces with the highest relative risk include the provinces of Lorestan (RR=2.22), Sistan and Baluchistan (RR=1.73), Golestan (RR=1.46), and the three provinces with the lowest relative risk include the provinces of Gilan (RR=0.41), Mazandaran (CIR= 0.48) and Kurdistan (CIR=0.51).
3.2. Time Trend Results
The results related to the evaluation of the time trend of total and average DALYs during the years 2009 to 2019 by Joinpoint regression are shown in Figs. (5 and 6). Fig. (5) shows the time trend of total DALYs by year. According to the obtained results, the time trend of total DALYs has decreased significantly between 2009 and 2015 and decreased by 2.08% annually (p<0.05). But in the continuation of this time trend, a join point was observed in 2015, and the total DALYs at this time point have undergone a noticeable change. So, the total number of DALYs decreased between 2015 and 2019 with a lower slope and intensity (APC=-0.61%). In general, during the years 2009 to 2019, the total DALYs decreased by 1.5% annually (p<0.05). More information about this time trend is shown in Table 3.
(source: Global Burden of Disease).
(source: Global Burden of Disease).
| The Number of Figure-related | The Time Frame of the Trend | APC | - | AAPC | - | - | |
|---|---|---|---|---|---|---|---|
| Point Estimate | 95%CI | - | Point Estimate | 95% CI | |||
| 5 | 2009-2015 | -2.08 | -2.4, -1.7 | <0/001 | -1.5 | -1.8, -1.2 | <0/001 |
| 2015-2019 | -0.61 | -1.3, 0.1 | 0.1 | ||||
| 6 | 2009-2015 | -2.08 | -2.4, -1.7 | <0/001 | -1.4 | -1.7, -1.1 | <0/001 |
| 2015-2019 | -0.6 | -1.4, 0.2 | 0.2 |
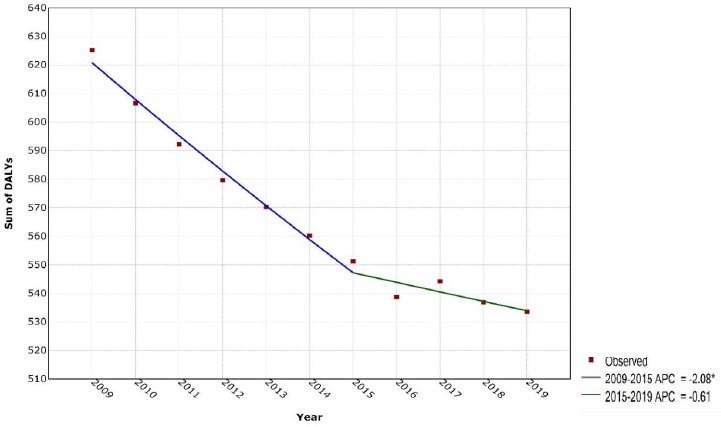
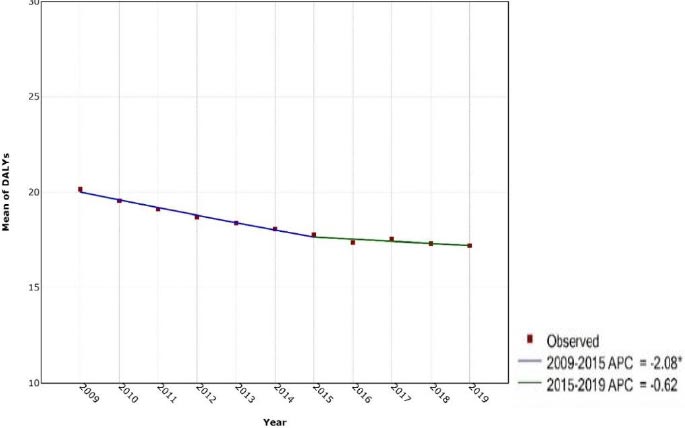
Fig. (6) also shows the time trend of average DALYs by year. As can be seen, the time trend of the average DALYs has decreased significantly between 2009 and 2015 and decreased by 2.08% per year (p<0.05). But in the continuation of this time trend, a join point was observed in 2015, and the average DALYs between 2015 and 2019 decreased with a lower slope and intensity. (APC = -0.62%) In general, during the years 2009 to 2019, the average DALYs Annual average (AAPC) had a significant decrease of 1.4% (p<0.05). More information about this time trend is shown in Table 2.
4. DISCUSSION
The burden caused by hepatitis B was not evenly distributed around the world, which was attributed to the different seroprevalence of HBV from country to country. HBV is endemic in developing countries in Asia and Africa. Although a series of preventive measures, such as extensive coverage of HBV vaccination, have been implemented for years, the burden of hepatitis B disease in these countries is still at a high level [23]. The results of this study provide the national estimate of DALY for hepatitis B in the provinces of Iran. The use of a single measure such as DALY, which allows the integration of the effects of mortality and disease-related morbidity into a single measure, especially for diseases where death is not the primary outcome and can cause major disability, is a distinct point of view in It presents their impact on population health. The most likely high-risk cluster of hepatitis B disease in the west of Iran includes Lorestan, Kermanshah, Hamedan, Markazi, Khuzestan, and Ilam provinces. In this cluster, the relative risk incidence was estimated to be 2.31. A secondary high-risk cluster was identified in the northeast of Iran, which includes North Khorasan provinces, And it was Golestan. The most likely low-risk cluster in the northwestern part of Iran included the provinces of Zanjan, Gilan, and Kurdistan. The relative risk in this cluster was estimated at 0.23. The three provinces with the highest relative risk include Lorestan, Sistan Baluchistan, and Golestan and the three provinces with the lowest relative risk include Gilan, Mazandaran, and Kurdistan provinces. The burden attributable to HBV varies worldwide. For example, it was 10.34 in Germany [24], 20.4 in Spain [25], 17 in the state of Santa Catarina in Brazil [26], 63.4 in Guangdong [27], and 230 in Shandong in China [28] which is consistent with the results of studies in Iran.
The results of our study showed a significant decrease in the total changes of DALYs between 2009 and 2015, which decreased by 2.08% annually. The time trend of average DALYs changes during the years 2009 to 2015 also showed a significant decrease and decreased by 2.08% annually. In Moradi et al.'s study, the HBV load has decreased significantly in all age groups, and the adjusted HBV load decreased from 1.9 in 2008 to 0.99 in 2015 per 1000 population, which is consistent with the results of the present study [29].
Such a decrease in HBV burden was due to a significant decrease in new HBV cases, which in turn caused a decrease in mortality after the implementation of the HBV vaccination program for infants and family members of people with HBV since 1994 [30]. Therefore, the best approach to control and reduce the burden of hepatitis is to prevent the occurrence of the disease, especially in high-risk groups, to diagnose and treat the disease faster, which can reduce the mortality rate and ultimately control the burden of hepatitis.
In the study of Moradi et al., in the study of the adjusted HBV burden distribution map based on the population, the results showed that the eastern and northeastern provinces, including Razavi Khorasan, Golestan, and Sistan and Baluchestan, are the main focus of this disease [30]. The results of the present study also showed that the most likely high-risk cluster in the west of Iran includes the provinces of Lorestan, Kermanshah, Hamedan, Markazi, Khuzestan, and Ilam. In this cluster, the relative risk of incidence was estimated to be 2.31. A secondary high-risk cluster was identified in the northeast of Iran, which includes The provinces were North Khorasan and Golestan.
The results showed that in 2019, the highest burden of hepatitis disease in Iran is related to the provinces of Lorestan, Golestan, Sistan and Baluchistan, Ardabil, and North Khorasan respectively. To control and change the trend of HBV load, attention to the following is highly recommended; The first and most important way to reduce the incidence of hepatitis B and DALYs caused by this disease is vaccination and primary prevention. Reducing unnecessary injections in health centers, training health workers to ensure safe injections, educating and informing drug addicts about the transmission of the disease through injections, better management of dialysis patients and HIV/AIDS patients, and increasing the coverage age for HBV diagnostic tests.
Especially for vulnerable groups, it is obvious that the most efficient way to reduce the burden of disease is prevention and reduction of disease incidence. An important measure to prevent HBV is to reduce its reservoirs in the community. The results of this study show the success of the vaccination program in controlling HBV. Therefore, it is necessary to continue the current policies. In addition, to increase effectiveness, health authorities should expand the coverage of programs across as well as other age groups in the country.
4.1. Limitations
This study suffers from the general limitations of GBD studies. The availability and quality of primary data, which are the foundation of the GBD analysis, is the main limitations of GBD estimates, particularly in regions with countries that have poor completeness. Ecological studies have substantial limitations and, although valid for hypothesis generation, are not considered useful for hypothesis testing because of unmeasured and uncontrolled confounding.
4.2. Future Direction
Quantifying indicators related to the health of society requires indicators that are the losses caused by premature deaths. For any reason, put together the burden caused by the disabilities that arise during the course of the disease and its various consequences. Data and express them based on a common unit, and on the other hand, the level of health and its distribution in the society in the form of an index. Therefore, studies of the burden of diseases are one of the most important needs to determine the current situation. The effectiveness of policies and health programs and the prioritization of interventions are considered.
CONCLUSION
The incidence of hepatitis B disease has significantly decreased during the last 20 years with the implementation of the general vaccination program in vaccination program for children at birth, but the burden caused by this disease is still high due to the cases of the disease from the years before vaccination. Therefore, redistribution of health resources to identify patients, control transmission, and treat infected patients is highly recommended.
AUTHORS’ CONTRIBUTIONS
E.G and Z.K. contributed to design, E.G., Z.K, and MTS contributed to Data Collection and/or Processing, E.G and SRP contributed to Analysis or Interpretation, E.G, S KH and Z.K helped in the writing of the manuscript.
LIST OF ABBREVIATIONS
| DALY | = Disability-Adjusted Life Years |
| GBD | = Global Burden of Disease |
| APC | = Annual Percent Change |
| AAPC | = Average Annual Percentage Change |
ETHICAL STATEMENT
The study was approved by the ethics committee of Lorestan University of Medical Science, Iran, with ID number IR.LUMS.REC.1401.215. This article has used the burden of disease data and the data were at the province level and did not require the informed consent of the individual.
CONSENT FOR PUBLICATION
This article has used the burden of disease data and the data were at the province level and did not require the informed consent of the individual.
AVAILABILITY OF DATA AND MATERIALS
All the data used in this research were made available to the public at http://ghdx.healthdata.org/gbd-results-tool
FUNDING
This research was performed with the financial support of Lorestan University of Medical Sciences.
CONFLICT OF INTEREST
The authors declare that there is no conflict of interest.
ACKNOWLEDGEMENTS
The authors would like to thank Global Burden of Disease and their staff for their willingness to provide the data required for this research.

