
Automatic COVID-19 Prediction with Comprehensible Machine Learning Models
Authors Info & Affiliations
Abstract
Background
The development of technology has a significant impact on every aspect of life, whether it is the medical industry or any other profession. The potential of artificial intelligence has been demonstrated in data processing and analysis is used to inform decisions in the field of health care. The most crucial action is the early detection of a life-threatening illness to stop its development and spread. Highly contagious COVID-19 is a disease that requires immediate attention as it has spread globally. There is a need for a technology that can be utilised to detect the virus because of how quickly it spreads. With the increased use of technology, we now have access to a wealth of COVID-19-related information that may be used to learn crucial details about the virus.
Objective
The objective of the work is to develop comprehensible machine learning models for the automatic prediction of COVID-19. These models aim to accurately predict the likelihood of COVID-19 infection based on relevant input features, such as symptoms, demographics, and potential diagnostic tests or imaging results.
Methods
In this work, we mainly aimed to assess how well different machine learning methods might predict COVID-19 situations. In order to do this, we thoroughly evaluated a variety of widely used classifiers in machine learning. Popular algorithms like the random forest, k-nearest neighbour, and logistic regression were all included in our analysis.
Results
To assess the performance of our suggested algorithms using different machine learning techniques, we used an open-source dataset in the study. Our algorithms performed better than other models that are currently in use, which is noteworthy. The high degree of precision in predicting COVID-19 instances is demonstrated by our remarkable accuracy of 96.34%. We also obtained a good F1 score of 0.98 for our models, indicating the strength and efficiency of our method in obtaining metrics for both recall and precision.
Conclusion
This work highlights the possibility of understanding machine learning algorithms for COVID-19 prediction automatically. We have shown that techniques such as logistic regression, random forest, and k-nearest neighbor methods may reliably predict COVID-19 situations while preserving interpretability. In order to promote acceptance and confidence among healthcare professionals and enable well-informed decision-making in clinical settings, these models' transparency is essential. To improve these models' efficacy and scalability in the future, more research will be needed to enhance and validate them on a variety of datasets. In the end, utilizing understandable machine learning algorithms presents encouraging opportunities for COVID-19 early diagnosis and control, supporting international public health campaigns.
1. INTRODUCTION
The World Health Organization (WHO) was notified of the new coronavirus on December 31st, 2020 following its discovery in Wuhan, China [1]. On February 11th, 2020, the WHO named the virus COVID-19 due to its potential to inflict worldwide harm. When a healthy individual comes into contact with an infected person, the virus spreads through the respiratory system, according to the World Health Organization resulting in a public health emergency [2]. A person who is infected develops symptoms in 2 to 14 days. Dry cough, weariness, and fever are listed by the World Health Organization as symptoms and indicators of moderate to severe diseases, whereas dyspnea, fever, and fatigue may occur in severe cases. The fast spread of the virus, which has killed hundreds of thousands of people, has necessitated the development of a technology that may be used to detect the infection. Tools such as machine learning software, data sets, and classification algorithms are crucial for creating the COVID-19 predictive model. This paper compares the accuracy of various machine learning algorithms, such as K-nearest neighbours, Random forest, and Naive Bayes, before selecting the best one to create a system that can determine whether or not a person has COVID based on the input data.
When an individual infected with the virus speaks, coughs, or sneezes, they release small droplets containing their oral or nasal secretions into the air, facilitating the easy spread of the virus. Surfaces can also become contaminated by these droplets or respiratory secretions from infected individuals. Two commonly employed diagnostic techniques for identifying current illness are reverse transcription-polymerase chain reaction (RT-PCR) and rapid antigen testing (RATs). Additionally, antibody tests can provide insights into past infections. Many infected individuals either exhibit mild symptoms or are asymptomatic and gradually recover. However, approximately 15–20% of patients experience severe symptoms, often necessitating hospitalization in an intensive care unit (ICU) or other medical settings. For more precise early diagnosis of COVID-19, RT-PCR is typically recommended. Nevertheless, research suggests that while CT scans and X-rays are less time-consuming and aid in identifying unwell individuals earlier, they may be more effective. Given the absence of a recognized cure for COVID-19, emphasis on care and prevention is paramount. Image analysis and machine learning techniques can enhance the “test, track, treat” approach to identify the virus. X-rays can be utilized instead of RT-PCR to more accurately diagnose COVID-19 symptoms in the lower respiratory tract, particularly in emergency situations where immediate test results are necessary. However, the reliability of this strategy needs improvement for consistent accuracy. Leveraging AI-based technology streamlines model detection, reducing both the quantity of kits used and the time required for sample analysis. The overarching goal is to enhance efficiency, reliability, and speed in COVID-19 detection and diagnosis.
1.1. Problem Statement and Motivation
Global healthcare systems are facing many difficulties as a result of the rapid spread of COVID-19, including the prompt identification and treatment of affected persons. Even if they are successful, traditional diagnostic techniques can be labor-intensive and necessitate certain tools and knowledge. Furthermore, correct diagnosis is made more difficult by the complexity of COVID-19 symptoms and illness progression, which can delay therapy and perhaps increase viral transmission. In this regard, automated and effective COVID-19 prediction techniques that can deliver quick and accurate findings are desperately needed to help sensible healthcare decision-making.
This work is motivated by the pressing need to create sophisticated instruments and methods for automatic COVID-19 prediction through understandable machine-learning models. Our goal is to expedite the diagnostic process by utilizing machine learning to help healthcare providers quickly identify and prioritize patients who may have COVID-19 infection based on easily obtainable data, such as demographics and symptoms. In addition, the significance of interpretability in clinical decision-making motivates the focus on understandable machine learning models, guaranteeing that medical practitioners can comprehend and rely on the model's predictions.
The contribution of the proposed work is summarized as follows:
• Despite limited data on the quantity and distribution of COVID-19 cases, infections are on the rise. Local authorities struggle to slow the spread due to a lack of understanding of distribution patterns. To address this challenge, we developed modeling software capable of generating short-term forecasts.
• Previous studies have explored various epidemiological models where social mixing rates influence pandemic parameters. However, current circumstances hinder the accurate estimation of these parameters. Machine learning models offer a practical approach to forecasting infectious cases, as precise parameter estimation may not be necessary. It's important to note that infection predictions are susceptible to non-linear fluctuations, leading to less accurate long-term projections. Hence, our focus is on developing short-term forecasting models where accuracy is more attainable.
• The research of the best models that yield the most accurate predictions is aided by the assessment of each machine learning model's predictive capacity using several sliding windows (rounds). The government will be able to combat COVID-19 and mortality more effectively with the aid of this methodology.
• Since the proposed machine learning model's framework generated remarkably accurate predictions, smart devices may employ it for early COVID-19 patient prediction.
This paper is structured as follows: Section 2 contains the literature review. Section 3 outlines the materials and methodology. Section 4 presents the analysis and findings. Finally, Section 5 concludes the work.
2. RELATED WORKS
According to studies [3], a support vector machine (SVM) algorithm can successfully differentiate COVID-19 patients in 85% of cases. In the study, COVID-19 test results from Hospital Israelita Albert Einstein (HIAE) in Sao Paulo, Brazil, were evaluated. During the first several weeks of the outbreak, it served as one of the primary COVID testing facilities in the nation. A task committee that was formed to address the COVID-19 situation completed this investigation. The same database from the Brazil hospital [4] used different dividers, including logistic regression, multilayer perceptron (MLP), and XGBoost. Over 91% of COVID-19 patients were correctly categorised. An ML algorithm was created and tested for COVID-19 diagnosis [5]. Based on lab features and demographics, the algorithm was created. From the UCLA Health System in Los Angeles, California, they gathered data. From 1 March 2020 to 24 May 2020, it covered all ER and inpatient cases undergoing SARS-CoV-2 PCR testing together with a collection of 1,455 ancillary laboratory features. COVID-19 is predicted by the function with 91% and 89% accuracy, respectively. Additionally, in 98% of cases, the need for an ICU or semi-ICU was predicted [6, 7]. Since there is not a lot of research on text-based diagnosis and prediction, we employed machine learning models to categorise clinical reports as either COVID-positive or COVID-negative [8]. A model for differentiating COVID-19 from other lung-related disorders was provided by Mohit Mishra et al. [9]. Pneumonia, non-pneumonia, having pneumonia, and healthy lungs are the four classes that were studied. This model consists of two steps, the first of which classifies the image into two groups. The two categories are pneumonic patients and normal people. Pneumonia patients with and without COVID are further separated in the second stage. With the aid of their chest X-ray imaging, 2D CNN, also known as CovAI-Net, is used to classify probable COVID-19 patients.
Sohaib, Asif, et al. [10] described a strategy that uses deep convolutional neural networks to improve detection accuracy in the identification of COVID-19 pneumonia patients based on chest x-ray photographs. Using the DCNN-based model Inception V3, transfer learning can be utilized to distinguish between pneumonia and coronavirus in images of the chest X-ray. The process of using a trained model that has already been applied to one problem to solve another is known as transfer learning. 98% of the predictions made by the model are accurate (97% during training and 93% during validation). Mohammed Abdul Azeem Siddiqui et al. [11] described a technique for identifying COVID-19 utilizing several bioindicators, with an emphasis on lung imaging and distinct biomarkers for the diagnosis of COVID-19, since these pictures may be conveniently acquired using medical diagnostics. Prerak Mann et al. [12] suggested a technique for fabricating fictitious chest X-ray images that incorporate patients with both positive and negative COVID-19.
Li et al. [13] introduced a model called COVID-GATNet to help with autonomously diagnosing CXR images and expediting detection. This study uses three chest X-ray images of COVID-19 patients, pneumonia patients, and healthy participants. Ridouani et al. [14] introduced a novel method that combines CNN, Ensemble Learning, and StackNet meta-modeling. Covstacknet is the name given to the model. These models are all capable of extracting characteristics from X-ray images. Ground glass opacities (GGO) are a pattern commonly seen in patients with COVID-19. Based on this idea, they considered using X-ray images for diagnostic purposes. Stacknets provides a model with reduced training mistakes and increased accuracy. Ali Narin [15] proposed a convolution neural network model using three datasets: viral pneumonia, COVID-19, and normal. The data is pre-processed using Matlab 2020 before being fed into the CNN model and SVM. Based on its categorization of the input data, the SVM model produces output. A customized attention-based CNN framework was used by Zhang et al. [16] to distinguish COVID-19 from 936 chest CT scans. The accuracy and F1 scores for this problem were 0.9632 and 0.9633, respectively. Wang, Zhu, and Zhang [17] detected coronavirus by combining a multiple-way picture augmentation technique with a specially designed CNN framework. The maximum accuracy and F1 index of the writers were 96.36% and 96.35%, respectively. In an effort to identify those afflicted by the coronavirus with an accuracy of 0.994, Kalaivani et al. [18] used a mixed boosted CNN technique from chest X-ray pictures. Extreme learning-based neural network models and image processing techniques were utilized by Pi and colleagues [19, 20] to distinguish between COVID-19 and healthy chest CT images.
A number of machine-learning approaches were used by Rohini et al. [21] to investigate how the COVID-19 epidemic was first identified. Forecasts and time-series monitoring were carried out by the authors, who also looked at the origins of the disease. These efforts should help with disease management in the future. Sharma and his group [22] worked on the SVM machine learning model for advanced coronavirus identification. The prediction accuracy of the SVM classifier was enhanced by using a hyperparameter optimization strategy as a modified cuckoo search method. By using traditional machine learning techniques, Tiwari et al. [23] studied the coronavirus infection pattern, treatment outcomes, and fatality rates. Additionally, a real-time open-source dataset was used to predict how this virus will grow in the future. The death rate of COVID-19 patients was predicted by Rai and colleagues [24] using majority rule-based ensemble approaches. In this work, feature selection, synthetic oversampling, and multivariate imputation were applied. For the purpose of coronavirus detection, Wang and colleagues [17] used a specially created CNN framework in conjunction with a multiple-way picture augmentation technique. Maximum accuracy and F1 index were attained by the authors, respectively, at 96.36% and 96.35%. In an effort to identify coronavirus-affected patients from chest X-ray images, Kalaivani et al. [25] used a mixed boosted CNN technique with 0.994 accuracy. To discriminate between healthy and COVID-19 chest CT pictures, Pi and colleagues [19] used image processing approaches and extreme learning-based neural network models. According to Md. Shahriare Satu et al. [26], the suggested technique may precisely predict the daily count of infected patients by training it using sample data from our web application's 25 days of data collection. Based on a larger dataset that includes the chest CT severity score (CT-SS), Seyed Zakariaee et al. [27] proposed an efficient machine learning prognostic model. There were 55 primary features in 6 main classes based on retrospective reviews of 6854 probable cases. Using the Chi-square independence test, the most important factors in COVID-19 patient mortality prediction were determined. According to Yenurkar et al. [28], a deep learning system based on artificial intelligence (AI) is suggested to identify positive cases of COVID-19 patients, as well as the mortality and recovery rates. The system uses real-world datasets. Patibandla et al. [29] highlighted the application of artificial intelligence (AI), machine learning (ML), and deep learning (DL) in numerous domains as critical for responding to the COVID-19 pandemic and foreseeing its significant consequences. Sudheesh et al. [30] explained COVID-19 detection approach using feature fusion methodology to enhance performance, and it is based on unsupervised deep learning. This information is used to build an automatic CNN model that uses chest X-ray pictures to identify COVID-19 samples from pneumonic patients and healthy individuals. Sanzida Solayman et al. [31] developed an intelligent online application by analyzing automatic COVID-19 detection with machine learning approaches. Preprocessing methods for the dataset include feature engineering, eliminating null values, and synthetic oversampling (SMOTE). Next, we assessed and trained various classifiers,
Yin et al. [32] proposed a three-party differential game model incorporating factors such as the risk coefficient for virus infection and experience teaching in epidemic prevention (EP) and compared prevention strategies, efficiency, and losses under three models through theoretical and numerical analyses. Results suggest that COVID-19 EP should be guided by central government (CG) leadership, interurban collaboration, and social participation.
Yin et al. [33] proposed another method to prevent COVID-19, it is essential to bolster the innovation capabilities within industrial sectors, promoting sustainable epidemic prevention measures. To address this, our study examines the dynamic changes in the overall integration networks of industrial sectors' information (IIN), as well as the unique characteristics of individual IIN and their impact on performance.
Shi Yin et al. [34] initially conducted a literature review to identify the primary factors influencing virus transmission. Subsequently, the pressure–state–response model was employed to illustrate the actions and interactions of these identified hazards, which were then categorized into disaster and vulnerability factors. Thirdly, each factor was assigned a risk rating ranging from 1 to 4. Lastly, the risk indexes for disaster and system vulnerability were modeled using straightforward and suitable weights and subsequently merged to establish an overall risk assessment for the resumption of university activities.
As mentioned in the literature section earlier, there are not many research studies on unsupervised learning methods for COVID-19 identification using CT and CXR scan pictures. The suggested method uses unsupervised clustering to locate COVID-19 in CXR images. The optimal features are extracted using a self-organizing feature map network following the clustering of the unlabeled data. A self-organizing feature map is an iterative technique that performs best when the original estimate is accurate. Additionally, the efficacy of the self-organizing feature map was illustrated using a small dataset. Because there are few relevant papers regarding unsupervised learning approaches and limited research on this topic, we have trained a large number of unsupervised learning models and examined their performance.
3. METHOD (PROPOSED METHODOLOGY)
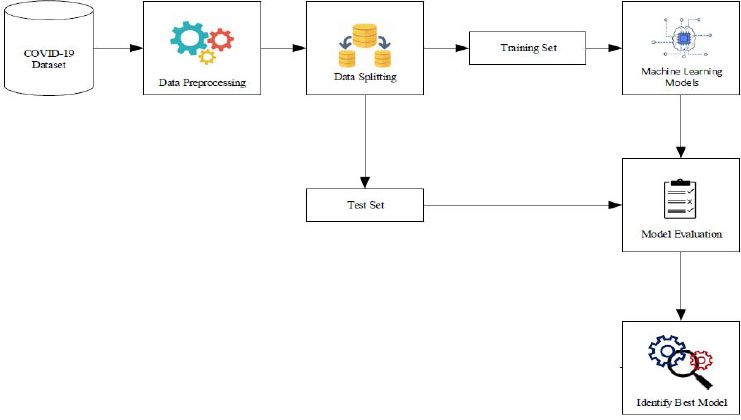
The proposed methodology comprises a structured sequence of four essential steps. Firstly, in step 1, data collection is conducted, where pertinent information regarding COVID-19 cases is gathered from reliable sources. Following this, in step 2, preprocessing techniques are meticulously applied to cleanse and refine the collected data, ensuring its quality and compatibility for subsequent analysis. Subsequently, step 3 involves performing exploratory analysis to gain deeper insights into the characteristics and patterns inherent within the dataset. This phase aids in understanding key trends, anomalies, and correlations, thereby facilitating informed decision-making during model development. Finally, in step 4, hyperparameter tuning via grid search cross-validation is executed, fine-tuning the parameters of machine learning models to optimize predictive performance. This meticulous process aims to enhance the accuracy and reliability of COVID-19 prediction outcomes. Additionally, Fig. (1) provides a visual representation of the comprehensive architecture of the proposed COVID-19 prediction system, highlighting the integration of multiple machine learning models for robust and multifaceted analysis.
3.1. Data Collection
The World Health Organization (WHO) has declared the Coronavirus pandemic a global health emergency, prompting hospitals and researchers to share epidemic-related data with the public. In response, we acquired a comprehensive dataset from Kaggle.com, consisting of 5,434 rows and 21 columns. This dataset contains crucial information, including a binary class property indicating the detection of COVID-19, along with 20 additional variables that are potentially influential in predicting the presence of the virus. These variables encompass various demographic, clinical, and epidemiological factors, providing a rich and diverse set of data for our analysis and modeling endeavors.
3.2. Data Processing
Data preparation is the process of transforming raw data into a format that is understandable. Real-world data may have noise, missing values, or be in an incompatible format, making it impossible for machine learning models to use it directly. Data preprocessing is a crucial phase in which we clean the data and prepare it to be compatible with, or appropriate for usage in, a machine learning model. This also improves the model's efficacy and accuracy. The following are the primary steps in data preprocessing:
3.2.1. Removing Features
From Fig. (2), it is evident that two features, namely mask-wearing and market-sourced sanitization, exhibit a singular value, which is “no.” Given that these features do not contribute to our predictive analysis, it is prudent to exclude these columns from our dataset. Removing these irrelevant features streamlines our dataset and prevents potential noise or biases from impacting our predictions, thereby enhancing the accuracy and efficiency of our modeling process.
3.2.2. Encoding Categorical Data
A common method of flexible code management for categories is labelling coding. Each label in this process receives a whole number according to alphabetical order. Our dataset's properties are all of the “yes” or “no” variety, therefore, we used label encoding to transform them to 0 and 1 so the model would better grasp the data. Fig. (3) shows the histogram of all the attributes which are important for feature extraction.

3.2.3. Splitting the Dataset
The dataset must be split as the following step in the preprocessing of machine learning data. The dataset for a machine learning model should be divided into training and testing components. We split the data in half, 80:20. This means that we preserve 20% of the data for testing and utilise the remaining 80% to train the model. We consider all 20 independent In order to determine whether the patient is COVID-19 positive or not, we will enter their qualities into x and the dependent column “COVID-19” into y.
3.3. Exploratory Data Analysis (EDA)
Various datasets are evaluated using exploratory data analysis with the goal of distilling them down to their essential elements. Statistical graphics and other data visualisation techniques can be used to visualise this summary. Data scientists are aided by EDA in a variety of ways.
• Increasing the understanding of data
• Detecting a variety of data patterns
• Improved comprehension of the problem statement
3.4. Hyperparameter Tuning by Grid Search CV
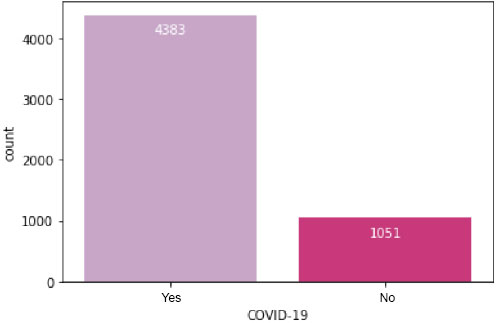
Its primary objective is to identify the ideal parameters where the model's effectiveness is best or highest and the error rate is lowest. Utilizing the accuracy score as the scoring measure after entering all the different parameters into the parameter grid, we ran the grid search CV program to find the best possible combination of parameters. Fig. (4) presents a visual representation detailing the total count of patients categorized by their COVID-19 test results, distinguishing between positive and negative outcomes. This figure offers a comprehensive overview of the distribution of patients across the different test result categories.
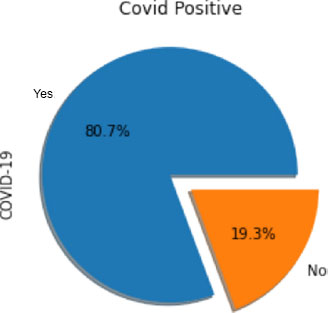
On the other hand, Fig. (5) illustrates the same data using a pie chart format. This visualization offers a clear and concise depiction of the proportion of patients with positive and negative COVID-19 results relative to the total number of patients. The pie chart format allows for easy comparison and understanding of the relative frequencies of each test result category.

4. IMPLEMENTATION
Predictive modelling is evolving along with the development of computer technology. Predictable modelling can now be done more effectively and economically than in the past. In order to identify the most sophisticated answer for each classification method, we employ a grid search CV in our work.
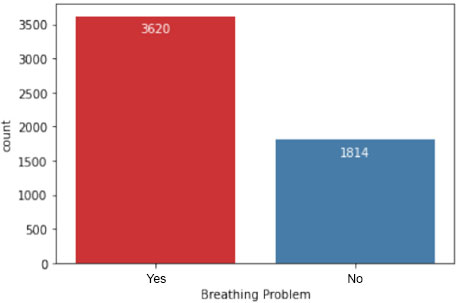
In Fig. (6), the dataset is further analyzed to depict the number of patients experiencing breathing difficulties. This visualization provides insights into the prevalence of respiratory symptoms among individuals in the study population, which is crucial for understanding the severity of COVID-19 cases.
To categorize the patients based on their symptoms and other attributes, various algorithms have been employed. Some of these categorization techniques include:
4.1. Logistic Regression
Machine learning is used in the data categorization method known as logistic regression. This programme uses a logistic function to predict the probabilities of possible outcomes from a single experiment. Logistic regression, which was created for this purpose, is the most straightforward method for comprehending the impact of several independent factors on a single output variable. The algorithm calculates the likelihood of falling into a specific class in general. Two classes are present, y=0.1.
4.2. K Nearest Neighbors
KNN, the first supervised machine learning technique for classification, assigns a particular instance to the category that has the highest percentage of representation among its k-nearest neighbours in the dataset. The algorithm determines how far apart each item in the data set is from the object that has to be classified. Fig. (7) shows the number of patients having fever.

4.3. Random Forest
This classifier is a meta-estimator that adjusts to decision trees on the various sub-samples of the dataset and makes use of the average to improve the predicted accuracy of the model and manage over-fitting. This random forest classifier appears to be more accurate than decision trees in the majority of cases, and it also reduces overfitting. The average of all the trees is the final feature importance at the Random Forest level. The important sum value of the feature on each tree is numerically calculated and divided by the total number of trees in the following manner:
5. RESULTS AND DISCUSSION
To evaluate the effectiveness of the machine learning algorithms used in this experiment, we decided to use the following metrics: Accuracy, Mean Squared Error, Precision, Recall, and F-Measure. These metrics are frequently used in domains like information retrieval, machine learning, and other domains that involve binary classification.
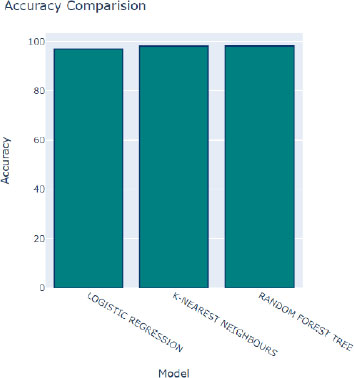
In Fig. (8), we observe the performance of various algorithms during training, following adjustments to their hyperparameters. Overall, all algorithms demonstrate commendable performance, as indicated by the relatively high accuracy scores depicted by the blue bars. Although slight variations in accuracy are noticeable, the majority of algorithms exhibit consistent and satisfactory performance across the board. Among these algorithms, the Random Forest Tree algorithm stands out with the highest accuracy score of 98.39 percent, as represented by the tallest blue bar. This algorithm consistently delivers excellent results, making it a top performer in the classification task.
Moreover, the bar graph employs distinct colors to represent additional performance metrics: red signifies R2 scores, green indicates mean squared errors, and purple represents ROC scores. These metrics offer supplementary insights into the performance of the algorithms across different evaluation criteria. Following closely behind the Random Forest Tree algorithm is the K-Nearest Neighbors (KNN) algorithm, boasting an impressive accuracy rate of 98.37 percent. With its robust performance, the KNN algorithm emerges as another favorable choice for accurate classification tasks.
The mean squared error (MSE) quantifies the disparity between the predicted class values generated by the model and the actual class values present in the dataset. In other words, it measures the average squared difference between the predicted and observed values, offering valuable insights into the accuracy and precision of the model's predictions. Fig. (9) provides a comparative analysis of the model's predictions against the original values within the dataset, allowing us to evaluate the accuracy of the model's estimates. A lower MSE value indicates that the model's predictions closely align with the actual values, signifying higher effectiveness in capturing the underlying patterns and trends within the data.

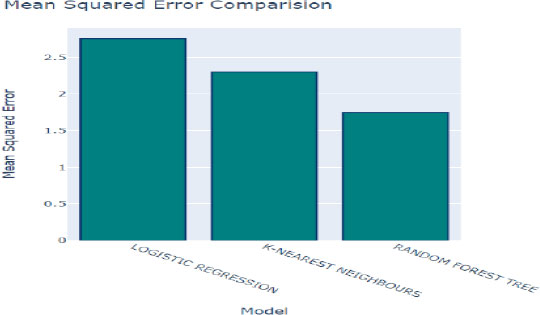
In Figs. (10 and 11), the MSE values for each algorithm are depicted, offering a direct comparison of their performance in terms of prediction accuracy. The Random Forest method exhibits the lowest MSE of 2.207%, indicating superior accuracy in its predictions. Following closely behind is the K-Nearest Neighbors (KNN) algorithm with an MSE of 2.57%, further highlighting its efficacy in generating accurate predictions. These results underscore the effectiveness of both algorithms in accurately capturing the underlying patterns within the dataset and making precise predictions.
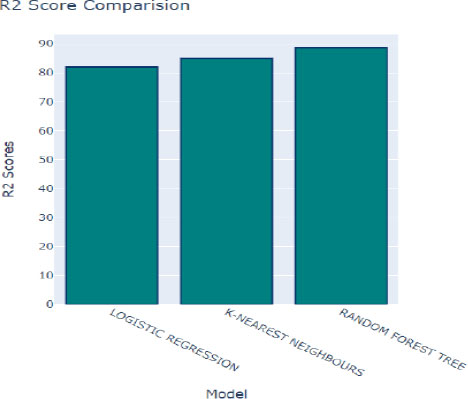
Fig. (12) provides insights into the coefficient of determination, denoted as R2, which assesses the goodness of fit of a model to the observed data. A higher R2 score indicates that the model closely aligns with the data, suggesting better performance in capturing the underlying relationships within the dataset. In this context, K-Nearest Neighbors (KNN) achieved a respectable R2 score of 83.1%, indicating a strong correspondence between the model's predictions and the actual data. Following closely behind is the Random Forest algorithm, with an R2 score of 85.51%, further highlighting its effectiveness in modeling the dataset.
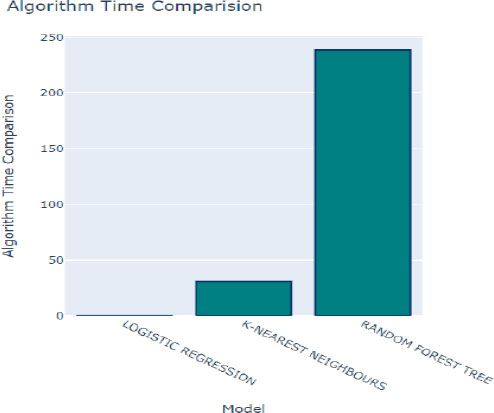
Additionally, the time taken to train each model is a crucial factor to consider when selecting the optimal method for our prediction model, as depicted in Fig. (10). Logistic Regression emerged as the fastest model to train, with a training time of only 0.05 seconds. While training time is an essential consideration, it's essential to strike a balance between training efficiency and predictive performance to ensure the chosen model meets the desired accuracy and speed requirements for the given application.
Next, a variety of criteria were used to assess each model's performance in order to identify the top-performing model. We examined the receiver operating characteristic (ROC) and detection error trade-off (DET) graphs to assess the effectiveness of various strategies. ROC curves that are closer to the upper left corner indicate better performance. The decision tree and random forest models work better when the ROC curve is used, as seen in Fig. (13). The DET graph, which compares the detection error trade-offs of the various

modes, shows that the decision tree and random forest perform better than the other models.
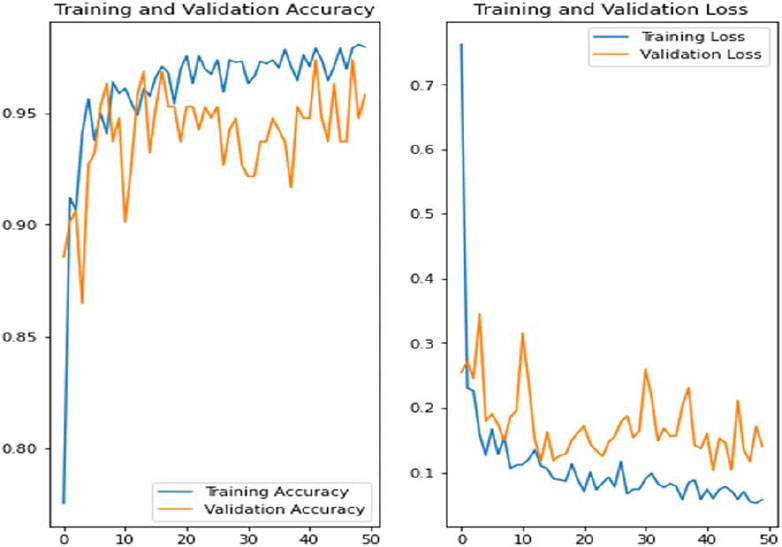
In Fig. (14), we showcase the architecture of our innovative Convolutional Neural Network (CNN) - Long Short-Term Memory (LSTM) model, accompanied by visual representations of the training and validation accuracy, as well as loss graphs across multiple epochs. Notably, these graphs are generated using the Synthetic Minority Over-sampling Technique (SMOTE), a method employed to tackle class imbalance issues commonly encountered in datasets. It's essential to highlight that the symptoms associated with COVID-19 often exhibit temporal dynamics and a progressive nature, wherein the severity and manifestation of symptoms evolve. This characteristic makes models like CNN-LSTM exceptionally well-suited for capturing and analyzing such dynamic patterns within the data. By leveraging the combined capabilities of CNN for feature extraction and LSTM for sequence modeling, our proposed model aims to effectively capture the temporal dynamics inherent in COVID-19 symptomatology, thereby enhancing the accuracy and reliability of predictive outcomes.
Our proposed models exhibited exceptional performance, surpassing expectations with a validation accuracy of 96.34%. This remarkable accuracy underscores the efficacy of our approach compared to existing techniques. The robustness and reliability of our models are crucial for accurately predicting COVID-19 cases, thereby aiding in timely intervention and healthcare management strategies.
In Fig. (15), we present the output of our prediction model when provided with user input indicating a COVID-negative result. This visualization provides insights into how the model processes input data and generates predictions, contributing to a better understanding of its functionality and utility in real-world scenarios. Similarly, in Fig. (16), we showcase the output of our prediction model when supplied with user input suggesting a favourable outcome. This visualization further demonstrates the model's ability to analyse input data and generate predictions, highlighting its potential to assist healthcare professionals in decision-making processes related to COVID-19 diagnosis and management.


Age has been identified as one of the most important characteristics that contribute to the prediction of case severity in research on mortality or severity prediction [20-23]. Age was one of the top 10 features in our analysis out of the 25 features we utilized in our prediction model. Our study is far better than other studies included in the literature review in terms of accuracy (0.952) and AUCROC curve (0.99) as well. In Table 1, we present a comprehensive comparison of various machine learning methods applied to different datasets. Notably, the comparison encompasses the performance metrics of each method across multiple datasets, providing insights into their effectiveness in diverse contexts. Upon examination, it becomes evident that the K-Nearest Neighbors (KNN) technique consistently outperforms the other two techniques in terms of accuracy across the datasets considered.
| - | Accuracy | MSE | R2 Score | ROC | Running Time |
|---|---|---|---|---|---|
| KNN | 98.56% | 2.67 | 82.1 | 97.47 | 23.45 |
| Logistic Regression | 97.25% | 3.46 | 81.23 | 92.93 | 0.037 |
| Random Forest | 98.78% | 2.32 | 84.41 | 96.31 | 212.13 |
This observation underscores the superiority of the KNN method in capturing underlying patterns and relationships within the data, leading to more accurate predictions. The versatility and simplicity of the KNN algorithm may contribute to its success across different datasets, as it relies on the proximity of data points to make predictions, making it particularly effective in scenarios where the data distribution is non-linear or complex. The notable performance of the KNN technique highlights its potential as a robust and reliable approach for various machine learning tasks, including classification and regression. Moreover, it emphasizes the importance of selecting appropriate algorithms tailored to the specific characteristics of the dataset to achieve optimal performance in predictive modeling tasks.
This study delves into the predictive potential of demographic information, vital signs, and chronic conditions in determining both the survival and mortality outcomes of individuals diagnosed with COVID-19. The findings underscore the significance of this investigation, with an impressive accuracy of 0.95 and an AUC (Area Under the Curve) value of 0.99 achieved through the utilization of 20 distinct features. Notably, the dataset used in this study was graciously provided by the hospital, with minimal missing data noted, which further bolsters the reliability and validity of the study outcomes. However, it is worth mentioning that the inclusion of a larger patient cohort would undoubtedly enhance the robustness and generalizability of the study findings. Additionally, the study highlights the importance of incorporating additional laboratory tests, such as lactate dehydrogenase (LDH), neutrophils, lymphocytes, and highly sensitive C-reactive protein, to further refine the predictive accuracy of mortality risk among COVID-19 patients. Moving forward, integrating key factors identified from existing literature into predictive models will be crucial for accurately assessing mortality risk in individuals diagnosed with COVID-19.
CONCLUSION
This study aimed to develop a predictive model for detecting COVID-19 presence using three supervised machine learning approaches. Performance analysis was conducted to evaluate the effectiveness of each model. Results indicate that the K-Nearest Neighbors (KNN) classifier, with a neighbor count of 2, emerged as the top-performing technique, achieving an impressive accuracy of 98.37% and a mean absolute error of 0.026, while considering the training runtime. Although this model exhibits average processing time compared to others, its accuracy remains notably high. The developed model serves as a valuable tool for physicians in identifying COVID-19 presence based on symptomatic patterns, offering decision support in clinical practice. Additionally, individuals experiencing COVID-19 symptoms can utilize the model to assess their likelihood of testing positive or negative for the virus. Future research endeavors may involve incorporating additional data sources, such as hospital records, information from infected individuals, COVID-19 survivors, as well as patients undergoing evaluation or management. Furthermore, the integration of software capable of forecasting COVID-19 severity could provide enhanced insights into necessary actions and treatment considerations.
LIST OF ABBREVIATIONS
| WHO | = World Health Organization |
| COVID-19 | = Coronavirus Disease |
| RT-PCR | = Reverse Transcription-polymerase Chain Reaction |
| RATs | = Rapid Antigen Testing |
| ICU | = Intensive Care Unit |
| SVM | = Support Vector Machine |
| HIAE | = Hospital Israelita Albert Einstein |
| ROC | = Receiver Operating Characteristic |
| DET | = detection Error Trade-off |

