All published articles of this journal are available on ScienceDirect.

Under-five Mortality: Comparative Study of Kenya and other three East-african Developing Countries
Abstract
Background
An indicator called the under-five mortality rate makes it possible to compare deaths in several locations and groups of children of various sizes at once. Sub-Saharan Africa (SSA) still has a high under-five mortality rate that needs to be addressed before modifiable causes can be completely recognized.
Objective
The study investigates the stark disparity in mortality rates for children under five between Kenya, Rwanda, Tanzania, and Uganda.
Methods
The study assessed secondary data from the World Bank repository covering four East African nation's period from 1990 to 2019. Kruskal-Wallis One-way ANOVA was used in the study as a method of data analysis. Therefore, A significance threshold of 0.05 is therefore, considered for the statistical tests in this investigation, and the statistical software used is R.
Results
The findings showed that the under-five mortality rates of the four nations under consideration differed significantly (p<0.05). The median under-five mortality for the country Kenya was 82 compared to 117 in Rwanda, Uganda was 113, while for Tanzania was 97. According to a Wilcoxon signed rank pairwise tests, there is a significant difference in under-five mortality between Kenya and Uganda.
Conclusion
Kenya has the lowest average under-five mortality rate (79.00 ± 26.40), while Rwanda has the highest average rate (123.53 ± 72.93). Within the review period, the average mortality rate in Rwanda was 40 higher than the average in Kenya and more than 20 more than the average for Tanzania's under-five mortality rate.
1. INTRODUCTION
The under-five mortality rate is a measure of children's health, well-being, and social and economic position more generally [1]. Life expectancy is a measure of the population's quality of life [1]. Improvements in healthcare, sanitation, nutrition, and socioeconomic conditions may lead to a simultaneous decrease in under-five mortality and an increase in life expectancy [2, 3]. Furthermore, lack of improvement in healthcare, sanitation and socioeconomic conditions can result in higher child mortality rates and lower life expectancy [2], [3]. Monitoring and addressing these factors are essential for promoting the health and well-being of populations worldwide [4]. African Union's Agenda 2063 indeed includes a goal related to improving life expectancy in Africa. Agenda 2063 is a strategic framework for the socio-economic transformation of the continent over 50 years, running from 2013 to 2063 [4-6]. Both infant and under-five child mortality are closely watched indicators because they reflect the access to children and communities’ basic health intervention, including vaccination and adequate nutrition [1, 7]. They are among the indicators of the Sustainable Development Goals (SDGs). Sustainable Development Goals (SDGs) that aim to reduce preventable deaths of children under five to at least 25 per 1000 live births by 2030 include reducing infant and under-five mortality as a worldwide target [7, 8]. Among the 7 out of 17 SDGs monitored by the United Nations Children's Fund (UNICEF), this study focuses on goal 3, reflecting on the good health and well-being of a child [7, 8].
Over the past three decades, there has been significant progress in child survival worldwide, and millions of youngsters now have higher survival rates than they did in 1990 [9-11]. However, over half of the projected 5.2 million children under the age of five who died in 2019 happened in the sub-Saharan African (SSA) region, which equates to 14000 deaths each day [11]. Additionally, the proportion of worldwide under-five mortality fatalities that occurred in SSA climbed from 31% in 1990 to 53% in 2019. It may rise even further in the coming decades because of expanding child populations and distribution towards regions with higher mortality rates [10]. Furthermore, children under the age of five continue to experience significant geographical and income gaps that negatively impact their chances of survival [9].
Several authors have performed comparative studies on under-five mortality over the past three decades [12-18]. Such studies seek to discover risk factors for under-five mortality and to compare trends and patterns of under-five mortality across communities. Comparative studies on under-five mortality have identified various factors associated with under-five mortality and compared the trends and patterns of under-five mortality across different populations [12-18]. One study by Hussein et al. [15] compared the key determinants of under-five mortality in Egypt and Kenya. The study found that both countries have witnessed decreasing trends in under-five mortality over the years, but the trends are distinctly different. The study by Tessema et al. [16] found that under-five mortality in Ethiopia remains excessively high and unevenly distributed. Another study investigated the incidence and predictors of under-five mortality in East Africa using multilevel Weibull regression modelling [17], [18]. The studies found that under-five mortality is a major public health concern in East African countries, and health facility delivery, higher wealth status, and other factors are associated with a lower risk of under-five mortality.
Under-five mortality is defined as the likelihood that a live-born kid will die before reaching the age of five [19]. It enables the comparison of mortality among different-sized groups of children, different locations at the same time, or the same locations at different times. As a result, a strong plan for implementing changes aimed at minimizing under-five mortality must be devised. Such a plan requires improving the quality of health care children receive [10]. Hence, a regular assessment of both causes and modifiable factors is required to evaluate whether the treatments reduce under-five mortality by decreasing the frequency of fatalities caused by those modifiable factors.
The purpose of this study is to investigate the large disparity in under-five mortality rates between four countries in East Sub-Saharan Africa: Rwanda, Tanzania, Uganda, and Kenya.
The rest of this study is organized as follows: The material and procedures are described in Section 2. The results are then reported, including descriptive statistics in Section 3. The numerical results are discussed in Section 4. Section 5 finally discusses the conclusion.
2. MATERIALS AND METHODS
2.1. Data Source
According to the study by Tesema et al. [17], an estimated 5.3 million under-five children died annually in the Sub-Saharan African region in 2017. Half of these deaths occurred in the east South African region. Hence, this study considers four EastAfrican Countries. The secondary panel data used in this study came from the World Bank’s repository under-five mortality rate statistics portal (https://data.worldbank.org/indicator/SH.DYN. MOR T). Under-five mortality rates in Rwanda, Tanzania, Uganda, and Kenya over 30 years (from 1990 to 2019). The sample size for the study was 120, that 30-year period multiplied by 4 countries.
| S.V | DF | The Sum of Squares (SS) | Mean Square (MS) | F |
|---|---|---|---|---|
| Group | G-1 |

|

|

|
| Error | n-G-1 |

|

|
- |
| Total | n-1 |

|
- | - |
2.2. One-way Analysis of Variance
ANOVA includes comparing random samples from two or more groups and can be thought of as an extension of the t-test [19]. Usually, these samples arise from observational, experimental units with different groups. These sample sizes for the groupings may differ, say Ni and this model assumes that the samples are independent, have the same variance, and are normally distributed [19], [20]. The One-way ANOVA model is defined as
 |
ϵ'ij independent normally distributed with mean zero and variance σ2, where with G groups, i = 1,2, ... G, and with Ni observations in the ith group, j = 1,2, ... Ni. Alternatively, in a matrix form, we have:
 |
Where Y is an n by 1 vector of response, X is an n by k + 1 design matrix of groups, β is k + 1 by 1 vector of model parameters, and ϵ is an n by 1 vector of random errors [19-21]. Mathematically, the equation for the one-way ANOVA can be stated as follows:
 |
We know that the above equation in a matrix form is given by
 |
Where 1 is n by 1 vector of one’s and 1Y- is n by 1 vector of means. As a result, the sum of square totals equals the sum of square groups plus the sum of square errors. The degrees of freedom, namely n - 1, G - 1 and n-G - 1 are associated with the sum of the square total, a sum of the square group, and the sum of the square error [21]. The sample size is denoted by n. The general one-way ANOVA table is shown below:
The source of variation, degree of freedom, sum of squares, mean squares, and F-test statistics are all shown in Table 1 as significant components of the analysis of variance. In the table above, I is an identity matrix, J is an n-by-n matrix of one’s, X is a matrix of explanatory variables, and Y, is a vector of response. We intend to test the following hypothesis using the analysis of variance method:
H 0: µ1 = µ2 = ... = µG
against the alternative
Ha: at least one of the pair mean is not equal
We can now compute and compare the F test statistic with an adequate degree of freedom to the F distribution value. A p-value can be calculated in addition to the F statistic by comparing the F test statistic to the F-distribution table value with the necessary degrees of freedom [19-21]. We can then calculate the p-value with a level of significance, say 0.05; if the p-value is less than 0.05, the null hypothesis is rejected, and a post-hoc test is required to identify a pair of groups responsible for the test significance [21]. Tukey's method, Bonferroni's method, and Scheffe's test are examples of tests that can be performed.
2.3. Kruskal-wallis One-way ANOVA
Kruskal-Wallis One-way ANOVA is a nonparametric statistical test (assumes no distribution) that compares the differences in a single, non-normally distributed continuous variable among three or more independently sampled groups [22]. The Kruskal-Wallis test is appropriate for non-normally distributed data [22], [23]. The Kruskal-Wallis test is an extended version of the two-group Wilcoxon rank or Mann-Whitney U test [23]. As a result, the Kruskal-Wallis test is a more generalized variant of the Mann-Whitney U test and the nonparametric equivalent of the one-way ANOVA [23], [24]. The following assumptions are made for the Kruskal-Wallis test:
- Data are expected to be non-normal or take a skewed distribution. When the data has a normal distribution, one-way ANOVA should be employed.
- The variable of interest should be divided into two or more independent groups. The test is most usually used for studying three or more groups; when analyzing two groups, the Mann-Whitney U test should be used instead.
- The data are considered to have a comparable distribution across the groups.
- The data should be drawn from random, independent samples with no ties to one another.
- For an adequate sample size, each group sample should have at least 5 observations.
Is given by
 |
where n is the total number of observations in all groups (n = 12 in this study), Tj is the rank total for each group, and ni is the number of observations in each group (n1 = n2 = n3 = n4 = 30). In this formula, the variable 12 remains constant since it happens naturally in relation to the mean of the sum of squares between ranked groups.
The hypotheses of the Kruskal–Wallis test are as follows:
- The null hypothesis (H 0) is that the population medians are equal.
- The alternative hypothesis (H1) is that the population medians are not equal or that the population medians differs from the population medians of one of the other groups.
The next step is to compare the H value with a critical chi-square value and interpret the p-value obtained. This value is generated from the chi-squared distribution, which is a theoretical distribution of values for a population that is widely used in nonparametric statistics [23, 24].
Data from one-way independent group designs is often non-normal in shape and rarely equally variable across treatment populations (i.e., population variances are heterogeneous) [25, 26]. As a result, the traditional test statistic used to measure statistical significance (i.e., the analysis of variance F test) frequently produces erroneous results (e.g., too many Type I errors, low power) [27]. We need to start by testing for the normality assumption and choose the appropriate statistical model to use. The Shapiro-Wilk test is a hypothesis test that is applied to a sample with a null hypothesis that the sample has been generated from a normal distribution. If the p-value is low, we can reject the null hypothesis that the sample was not generated from a normal distribution and state that it was not.
3. RESULTS AND DISCUSSION
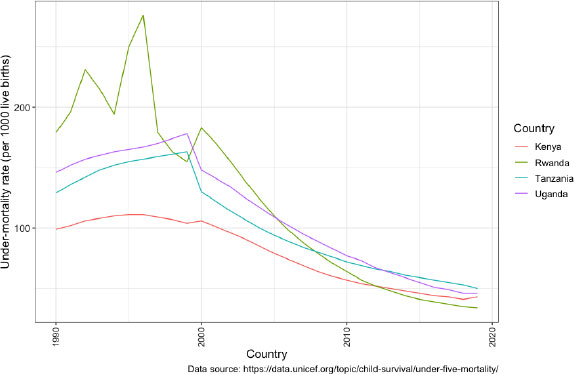
Fig. (1) depicts the under-five mortality trend in Rwanda, Tanzania, Uganda, and Kenya from 1990 to 2019. Rwanda has greater under-five death rates than the other three countries between 1990 and 1993 and 2000. However, Rwanda had seen a considerable decrease in under-five mortality rates since 2000, with a lower under-five mortality rate from 2012 to 2019. Uganda had the second-highest under-five mortality rate of the four countries in 1990. Uganda, on the other hand, had the second-highest under-five death rate in 2019. Tanzania was ranked the third region with the highest under-five mortality rate among the four nations in 1990 but had the highest in 2019.
Table 2 presents the sample size per country, minimum (Min), maximum (Max), median, interquartile range (IQR), skew, and kurtosis. Fig. (2) shows the same descriptive statistics. Each country has a sample size of 20, which totals 120 study sample size. Skewness is known to be a measure of the asymmetry of a probability distribution, and kurtosis identifies whether the data shows heavy or light-tailed. The skew values for all countries are between -0.5 and 0.5, and this suggests that the data exhibit approximate normal. Rwanda has a maximum mortality rate of 276 per 1000 live births and a minimum mortality rate of 34 per 1000 live births compared to the other three regions. Tanzania has the maximum mortality rate of 163 per 1000 live births and the minimum mortality rate of 50 per 1000 live births. In both Kenya and Uganda, mean values are less than the median values, which suggests that a large of data points are pushed on the left-hand side. Hence, we have a negatively skewed shape. The median scores showed that Tanzania, Uganda and Rwanda are higher than Kenya. In both Rwanda and Tanzania, mean values are greater than the median values, which suggested that a large of data points are pushed on the right-hand side. Hence, we have a positively skewed shape. The median is less affected by outliers compared to the mean. Interquartile range describes the spread of the data. Rwanda has the larger IQR (126), which means that there is an increased data spread. Kenya has a smaller IQR value of 53, which suggests less spread of data.
| Country | Sample | Min | Max | Mean | Median | IQR | SD | SE | Skew | kurtosis |
|---|---|---|---|---|---|---|---|---|---|---|
| Kenya | 30 | 41 | 111 | 79.00 | 82 | 53.00 | 26.40 | 4.82 | -0.14 | -1.73 |
| Rwanda | 30 | 34 | 276 | 123.53 | 117 | 126.00 | 72.90 | 13.30 | 0.32 | -1.21 |
| Tanzania | 30 | 50 | 163 | 103.47 | 97 | 73.80 | 39.40 | 7.19 | 0.17 | -1.59 |
| Uganda | 30 | 46 | 178 | 112.03 | 113 | 87.20 | 46.00 | 8.39 | -0.06 | -1.62 |

Fig. (2) displays a boxplot that summarizes the information presented in Table 2 above, using the quartiles, median, minimum, and maximum values. Boxplot compares the median and the spread of data by country. Rwanda has a higher median and the middle of 50% of values (contained in the box) are more spread out than the other three countries.
The present study aimed to investigate the under-five mortality rates in Kenya and three other East African developing countries, employing a panel data approach and utilizing Kruskal-Wallis Analysis of Variance (ANOVA) for comparative analysis. The findings provide valuable insights into the disparities in child mortality across the region and contribute to the understanding of factors influencing under-five mortality. We start by testing for the normality assumption to decide whether to use parametric or non-parametric one-way ANOVA. The Shapiro-wilk test is used, and p-value = 0.033 < α 0.05. We rejected the null hypothesis and concluded that the sample was not generated from a normal distribution. Hence, Kruskal-Wallis ANOVA is used.
The results of the Kruskal-Wallis ANOVA in Table 3 and Fig. (2) revealed a significant difference in mean under-five mortality rates among the studied countries (Chi-square = 8.17, DF = 3, p-value= 0.0124 < 0.05). As the p-value < 0.01, there is very strong evidence to suggest a difference between at least one pair of countries.
| Shapiro-wilk Normality Test | ||||
|---|---|---|---|---|
| W | 0.9717 | P-value | 0.0124 | |
| Kruskal- Wallis’s test | ||||
| Sample size | Chi-square | Degree of freedom | p-value | |
| 120 | 8.71 | 3.00 | 0.033 | |
| Sample size | Response | Effect size | Method | Magnitude |
| 120 | Mortality | 1.00 | Eta2[H] | large |
| Pairwise Comparisons | ||||
| Kenya | Rwanda | Tanzania | ||
| Rwanda | 0.368 | - | - | |
| Tanzania | 0.096 | 1,00 | - | |
| Uganda | 0.037 | 1.00 | 1.00 | |
The pairwise Wilcoxon signed rank comparison for each pair of countries is used to see which countries that have statistically significant under-five mortality. Since multiple tests are being performed, an adjustment to the p-value is required to maintain the overall type 1 error down. The simplest adjustment, known as Bonferroni that multiplies each Wilcoxon sign rank p-value by the total number of tests carried out (in this case there are 4). Table 3 shows the results of the Wilcoxon test on each pair of countries. The result reveals no statistically significant differences in the under-five mortality rate between Tanzania and Kenya, Tanzania and Rwanda, Uganda and Rwanda, and Uganda and Tanzania. There is a significant difference between Uganda and Kenya since p-value =0.037 < α=0.050.05 using the period of interest (1990 to 2019).
Pairwise, Wilcoxon signed rank comparisons were conducted to discern specific differences among countries. In comparison to Kenya, Tanzania, and Uganda, Rwanda had achieved notable improvements in lowering the mortality rates for children under the age of five, according to the UNICEF 2020 report, and that has been observed in Fig. (1).
The success of Rwanda in this field can be attributed to several factors:
- In putting children's health and well-being first, Rwanda had demonstrated a strong governmental commitment and leadership.
- Community-based health initiatives in Rwanda have a mother and child-health component.
- Through its national health insurance program, known as Mutuelle de Santé, Rwanda has attained excellent health insurance coverage.
- Rwanda has made major investments in the country's healthcare infrastructure, including the building and remodelling of medical institutions.
- Rwanda has placed a strong emphasis on preventative healthcare initiatives, including immunization drives, nutrition initiatives, and family planning services.
- To expand its healthcare system and enhance child health outcomes, Rwanda has worked with several international organizations, non-governmental organizations, and funders.
While comparing under-five mortality rates in Rwanda, Tanzania, Uganda, and Kenya using the median of under-five mortality and trend analysis over time can provide valuable insights into child health, it is critical to consider the limitations of these approaches when comparing under-five mortality rates: demographic and socio- economic differences, data quality and reliability, population size and age structure, policy and intervention differences, influence of external factors, heterogeneity in causes of death, To overcome these constraints, it is critical to compare under-five mortality rates across nations using a combination of methodologies. It is critical to evaluate the relevant elements to acquire a thorough picture of the observed variances. Future research should investigate the specific causes of under-five mortality in each country, such as healthcare infrastructure, socioeconomic issues, and cultural effects.
CONCLUSION
This study used panel data on four countries and applied Kruskal-Wallis ANOVA to assess differences across these countries. A Kruskal-Wallis test was carried out to compare under-five mortality between four countries. There was strong evidence of a significant difference (p-value <0.05) between the mean rank of at least one pair of countries. Wilcoxon signed rank pairwise was carried out for the four countries. There was very strong evidence (p-value <0.05, adjusted using the Bonferroni) of the difference between Kenya and Uganda. Despite good work done by Rwanda in the reduction of under-five mortality. We can, therefore, conclude that among the four countries under consideration, Rwanda has the highest mean of under-five mortality rate (123.53 ± 72.90) over the period of study, followed by Uganda (112.03 ± 46.00). However, Kenya has the lowest mean under-five mortality rate (79.00 ± 26.40) over the period of the study, closely followed by Tanzania (103.47 ± 39.40). Rwanda’s average under-five mortality rate between 1990 through 2019 is over 40 more than the average rate of Kenya and almost 21 of Tanzania’s under-five mortality rate within the period under review. However, the trend suggested that Rwanda under-five mortality reductions was more than that other three countries. While Rwanda had made remarkable progress in reducing under-five mortality, Kenya, Uganda, and Tanzania faced more significant challenges in this area. Here are some general recommendations that could help address under-five mortality in these countries:
- All four countries might improve their healthcare systems by investing in infrastructure, assuring the availability of key drugs and medical equipment, and recruiting and educating healthcare workers.
- Kenyan, Ugandan, Tanzanian, and Rwandan governments should devote appropriate resources to the health sector to ensure adequate resources for child health initiatives, preventive measures, and healthcare services.
- Access to healthcare services should be improved, particularly in remote and underprivileged locations.
- Data on child mortality and its determinants must be timely and precise in order to plan effective treatments.
- Increasing vaccination coverage is critical for preventing the spread of vaccine-preventable illnesses and lowering child mortality.
- Prioritizing maternal health is critical because it has a major impact on child health outcomes.
Each country may have unique challenges and contexts that require tailored approaches to address under-five mortality effectively, therefore, policymakers, healthcare experts, and relevant stakeholders in each country should work together to develop and implement evidence-based strategies that align with their specific needs and circumstances. This improvement is urgently required if the country can be in line with the United Nations Sustainable Development Goals around child health by the year 2030. Collaboration and knowledge exchange among these four countries can also help identify successful interventions and best practices for improving child health outcomes.
LIST OF ABBREVIATIONS
| ANOVA | Analysis of Variance |
| IQR | Interquartile Range |
| SDG | Sustainable Development Goal |
| SSA | Sub-Saharan Africa |
| UNICEF | United Nations Children Fund |
AUTHOR’S CONTRIBUTIONS
WJD obtained the dataset, identified and reviewed all the records, conducted data analysis, and prepared the manuscript. HGM and SFM reviewed and suggested revision of the draft and edited the manuscript. All authors reviewed the manuscript critically for the content and agreed on the final version.
ETHICS APPROVAL AND CONSENT TO PARTICIPATE
Not applicable.
HUMAN AND ANIMAL RIGHTS
Not applicable.
CONSENT FOR PUBLICATION
Not applicable.
AVAILABILITY OF DATA AND MATERIALS
The data and supportive information are available within the article.
FUNDING
None.
CONFLICT OF INTEREST
The authors declare no conflict of interest, financial or otherwise.
ACKNOWLEDGEMENTS
The corresponding author appreciated the co-authors for their professional guidance, constructive input, and the creation of time for preparing this paper. In addition, we appreciate the World Bank repository for access to the data file.

