
Cost and Quality Control Model for The Clinical Pathway of Cesarean Section
Abstract
Background
Cesarean section (CS) incidents are increasing in some parts of the world, which are not accompanied by improved service quality and cost-efficiency. Changes in the pattern of health financing from a fee-for-service to a prospective payment (case-mix system) are considered the cause. Clinical pathways are essential for achieving effectiveness (quality control) and efficiency (cost control) in hospital services. However, there has been no prior research on developing a cost and quality control model for CS in the INA-CBG's system.
Objective
This study aims to develop a cost and quality control model for the clinical pathway of CS by calculating unit costs and tariffs, reviewing procedures and outcomes, and evaluating performance efficiency and effectiveness.
Methods
From August 2021 to April 2022, 110 CS patients from 11 hospitals in West Sumatra that provide CS services participated in this study. The study implemented a mixed-method design and utilized Thiagarajan's 4-D model, which integrates interviews, surveys, and recommendations, to develop a prototype model that will be validated again to establish a permanent model.
Results
Of the 110 patients, 45% were efficient, while 77% were effective. Furthermore, 40 patients (36.4%) underwent efficient and effective CS. A prototype of a cost and quality control model for the clinical pathway of CS was developed by analyzing 40 patients with in-depth interviews, a Delphi study, and professional recommendations.
Conclusion
Hospitals can use cost-effective and high-quality clinical pathways for CS services.
1. INTRODUCTION
Cesarean section (CS) incidence has experienced an increasing trend in various parts of the world, including Indonesia. In 2008, 54 of 137 countries had CS rates below 10%, while 69 had CS rates above 15%. However, after 2010, CS has increased globally in recent decades. In the United States, the rate of births by CS rose from 4.5% in 1970 to 32.9% in 2009 and remained at 30% until 2015 [1].
In 2015, WHO suggested that the ideal CS rate is 10% to 15% to avoid maternal deaths and improve maternal and neonatal outcomes. However, in 2008, only 10% of countries had a CS rate of 10-15%, of which 24% of countries had a CS rate of less than 5%, and 50% of countries had a CS rate of more than 15%. Therefore, the Lancet Journal calls it a global epidemic [2]. The increase in CS incidents is due to pressure on the use of new technology, which is often unbearable, increasing productive age (demographic bonus), and moral hazard (bioethics) in CS procedures [3-5]. The use of new technology often creates inefficiencies. The 2010 World Health Report estimates that 20% to 40% of all health spending is currently wasted due to inefficiency [6].
In Indonesia, the CS rate increased from 12.9% in 2012 to 17% in 2017 [7]. WHO recommends avoiding maternal deaths and improving maternal and neonatal outcomes; the ideal CS rate is 10% to 15% [8, 9]. In West Sumatra, the CS rate was 14.8% in 2013, ranking it the 6th highest in Indonesia [10]. By 2018, the rate increased significantly to 23.6% [11]. However, this rise in CSs in Indonesia did not improve hospital service quality or cost efficiency [11, 12]. This can be attributed to the use of the Indonesia-Case-Based Groups (INA-CBGs) system, which relies on discharge diagnoses and CBG codes for payment instead of billing for specific services [13]. As a result, hospitals face financial losses due to the Ministry of Health's rates for CS services not covering the actual costs [14]. Therefore, there is a need for a quality assurance program to ensure service effectiveness and cost control towards efficiency [12, 13].
The Integrated Clinical Pathway (ICP) is an established model that supports hospitals in enhancing quality and cost control [15]. This model was developed based on the Quality Care Framework model from Donabedian (1973) and aims to continuously improve cost and quality control by analyzing structural, procedural, and outcome-related components. Recent studies have shown that implementing clinical pathways can reduce hospital costs, length of stay (LOS), hospital complications, readmission, and mortality rates while improving documentation [16, 17].
This study utilized a research and development (R&D) approach to create specific products (ICP) and assess their impact on CS service. This study employed a 4-D development model, as Thiagarajan (1974:5) outlines: define, design, develop, and disseminate. The 4-D model was consistently applied to guide the entire development process. Throughout development, the researcher described the properties and functions of components at each stage and their interrelationships within the system.
Until now, no research has been related to developing an efficient and effective CS service model based on cost calculations and analysis of activity procedures within the framework of the INA-CBG's system. This research aims to develop a cost and quality control model for the clinical pathway of CS services in the INA-CBG's system.
2. MATERIALS AND METHODS
The study was conducted from August 2021 to April 2022. The study's population consists of 51 hospitals in West Sumatra. These hospitals were classified into three categories: type B (with over 200 beds), type C (with over 100 beds), and type D (with over 50 beds). This study will sample 30% of hospitals from each type of hospital category. As a result, 11 hospitals in West Sumatra that offered CS services were included. Using the Lemeshow formula (1997), it was determined that 110 CS patients would be required to complete a questionnaire [18]. We invited 10 patients from each hospital to participate, reaching a total of 110 patients. Inclusion criteria included patients registered with government health insurance and those willing to participate, while severe complications excluded patients from the study.
The study implemented a mixed-method design (quantitative and qualitative research) and followed a research and development approach, namely the 4-D model (define, design, development, dissemination) [19, 20]. The define phase consists of three stages: the first two stages (stages 1-2) feature observational analytic, as well as, quantitative research, and the third stage features qualitative research.
2.1. Define Phase
During this phase, the aim is to establish and define development requirements while conducting a comprehensive needs analysis to cater to the requirements of healthcare providers and end-users.
2.1.1. Qualitative Research
The qualitative study explores whether the hospital already has a clinical pathway related to CS services, as well as the activities and cost components involved in the hospital's accounting system. This qualitative data collection was carried out by interviews, observation, and document review. Initial observations and in-depth interviews were conducted with service managers to determine the activities carried out during the procedure and financial managers to understand the cost accounting aspect of CS services. In collecting qualitative data, the researcher was assisted with recording equipment, a list of questions, notebooks, observation checklists and document review checklists. The collected data was then processed by creating data transcripts based on a predetermined theme and analyzed using data reduction, data display, and verification. Finally, conclusions were drawn.
2.1.2. Quantitative Research
This quantitative study employs an observational analytical method. The aim is to gather quantitative data on the following: 1) The unit cost of CS services. 2) The tariff for CS services 3) The efficiency percentage of CS services. 4) The effectiveness percentage of CS services, analyzed through activity procedures and outcomes.
2.1.2.1. Unit Cost, Tariff, and Performance Efficiency Analysis of the CS Service
The unit cost is calculated by adding up the direct and indirect costs of CS services. Direct costs refer to expenses that directly contribute to the production of the services, such as incentives, medicines, medical materials and consumable medical devices. To calculate this, information related to incentives for doctors and officers per CS service must be observed. On the other hand, indirect costs are expenses associated with the support production units, including management, employees, cleaning, kitchen and nutrition, program costs, and more. These costs are determined using the Activity Based Costing (ABC) method [21].
The tariff of CS service is calculated by adding up the unit costs with the tariff policies of each hospital. Tariff policies refer to the percentage of profit margin added to the unit cost, which is obtained by conducting interviews with directors, owners, or representatives of hospital owners.
The efficiency of CS services is analyzed using the Break Even Point (BEP) method, where the calculation results for CS tariff are compared with the tariff that has been determined by the Minister of Health Regulation [22].
2.1.2.2. Performance Effectiveness Analysis of The CS Service
The performance effectiveness of the CS services was assessed by analyzing all activities and outcomes related to the service. The CS service consists of 16 activities: registration, initial assessment, laboratory testings, diagnostic radiology, pre-surgery preparation, medical procedures, anaesthesia, intra-operative procedures, baby procedures, post-surgery care, maternal care, child care, laundry, nutrition, sterilization, and pharmaceutical treatment. Each activity was analyzed using the Direct Observational of Procedural Skill (DOPS) form, which breaks down each procedure step. Surgical pain, Length Of Stay (LOS), and Surgical Wound Infection (ILO) were the three outcomes measured and analyzed in all patients [23]. The CS performance is categorized as effective if: a) more than 80% of steps were taken; b) no complications were found (ILO or surgical pain); c) LOS matches the clinical pathway.
2.2. Design Phase
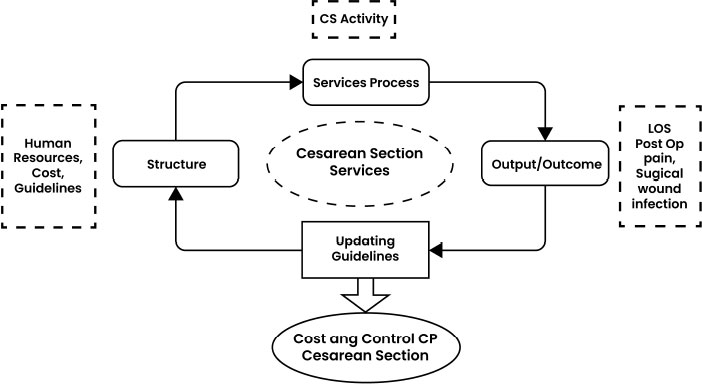
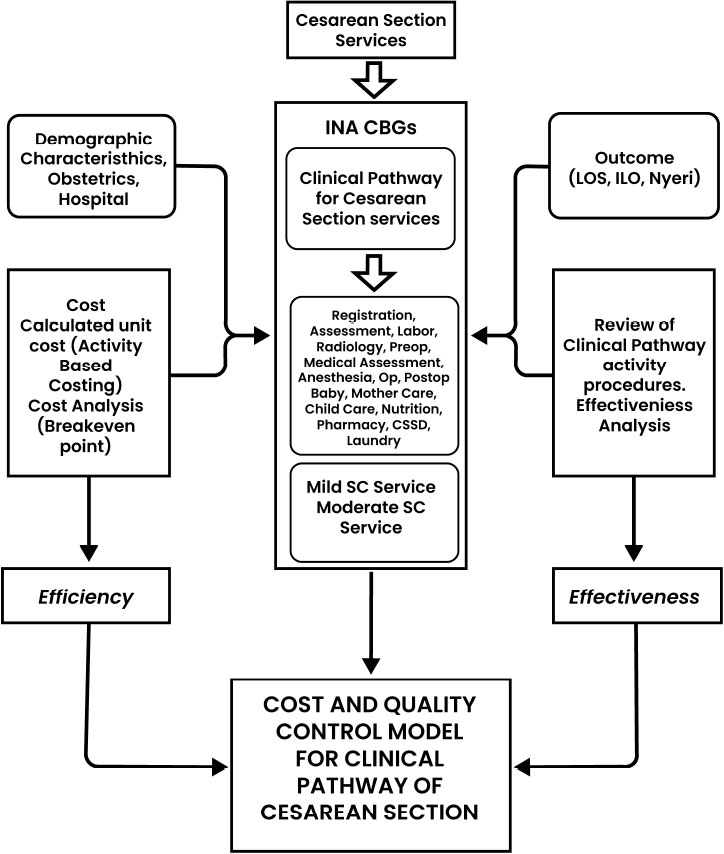
A prototype of the clinical pathway model framework for CS services was created during the design phase. This model was adjusted to ensure cost efficiency and quality effectiveness across all procedures and activities. The prototype model was developed based on the Quality Care Framework theory from Donabedian (1973) (Fig. 1) and follows a continuous improvement approach to the quality control cycle by examining the structure, process, and output/outcome [15]. The cost and quality model framework for CS are shown in Fig. (2).
2.3. Development Phase
After establishing the design, the model was developed through consultation and validation by experts from each Care Provider (PPA) peer group in the CS services clinical pathway. The expert panel consisted of the heads of the obstetric nursing, pharmacy unit, medical unit, radiology unit, paediatrics unit, obstetric unit, operating theatre, laundry unit, and nutrition unit.
The validation was conducted using the Integrated Clinical Pathway (ICP) validation sheet, which consisted of content aspects and language use. Validation was performed by 56 validators, who are professionals and heads/representatives of 37 units from four hospitals of different classifications.
2.4. Dissemination Phase
In the final phase, Disseminate, the Integrated Clinical Pathway model for CS services is rigorously tested and refined until it produces consistent results. Expert judgment is then incorporated into the model, enabling it to be utilized effectively. The model is shared through publications in reputable national and international journals or presented at high-profile international/national conferences to achieve this.
3. RESULT
3.1. Research Subject
The research was conducted at 11 hospitals in West Sumatra, comprising six public hospitals (55%) and five private hospitals (45%). When viewed from the type of hospitals, it consists of 8 general hospitals (73%) and 3 specialized hospitals (27%). Based on the severity variable (severity level), there were 100 patients with severity 1 or mild CS services (90.9%) and 10 patients with severity 2 or moderate section services (9.1%).
Based on the socio-economic variables, the patients generally came from the village (57%), most were 30-39 years old (47.3%), housewives (79.1%), the most education was (79%) primary education (Elementary school, Junior high school, and senior high school), and patients with the most income below 1.5 million rupiahs (44.5%). Based on obstetrical variables, about one-fourth of the patients were parity 1 (29%), gestational age at CS was 37-42 weeks (85.5%), and over half had previous CS (60%) and had about four ante-natal visits (61.8%). The outcomes of CS were favourable, with no surgical wound infections reported, only 5 (4.5%) reported surgical wound pain, and 79% required only 3 days of stay (LOS).
3.2. Define Phase
3.2.1. Qualitative Research
The results of interviews with 2 hospitals show that no hospitals with CS services have and implement clinical pathways. Related to CS service activities at the hospital, the results of observation, document review, and interviews totalled 16 activities, starting from registration to the patient's discharge, operation, and post-operation. The results of interviews regarding the ownership of Standard Operating Procedures (SOP) documents for CS service activities carried out in hospitals indicated that all hospitals already had SOPs.
The results of observations of financing components in the hospital accounting system consist of direct costs and indirect costs. Direct costs are part of the products produced, such as incentives, medicines, and consumable medical materials and medical devices in health service actions, doctor and nurse services in operating rooms. In addition, there are indirect costs whose benefits do not become a direct part of the product but are costs required to support production units. There are 17 indirect costs: 1) medical service fees, 2) management (directors') fees, 3) employee costs, 4) building depreciation costs, 5) medical device depreciation costs, 6) medical device repair and maintenance costs, 7) depreciation costs for non-medical devices, 8) repair and maintenance costs for non-medical devices, 9) office stationery, telephone, electricity and water costs, 10) costs for chemical reagents and diagnostic/laboratory materials, 11) cleaning costs, 13) garbage and waste, 14) laundry costs, 15) kitchen and nutrition costs, 16) sterilization costs, and 17) program, promotion, and advertising costs.
3.2.2. Quantitative Research
3.2.2.1. Unit Cost, Tariff, and Performance Analysis of CS Service Efficiency
The unit cost for mild CS services, the lowest, is US$205.81, while the highest is US$754.29. In addition, for moderate CS services, the lowest unit cost is US$ 305.22, and the highest is US$ 755.62
The highest rate for mild CS services is US$754.29, and the lowest is US$246.97. Meanwhile, for moderate CS services, the highest was US$ 755.62, and the lowest was US$ 320.64. The calculation of cost and tariff for CS services is shown in Table 1.
| Hospital Code | Types of Cesarean Section | Direct Cost (US$) |
Indirect Cost (US$) |
Total Unit Cost (US$) |
Tariff Policy | Cesarean Section Service Tariff (US$) |
|---|---|---|---|---|---|---|
| A* | Mild | 125.49 | 506.15 | 632.10 | 0% | 632.10 |
| Moderate | - | - | - | - | - | |
| B* | Mild | 169.77 | 351.10 | 521.44 | 0% | 521.44 |
| Moderate | 174.44 | 351.10 | 525.54 | 0% | 525.54 | |
| C** | Mild | 131.01 | 74.80 | 205.81 | 20% = 40.91 | 246.97 |
| Moderate | - | - | - | - | - | |
| D* | Mild | 151.57 | 602.72 | 754.29 | 0% | 754.29 |
| Moderate | 152.90 | 602.72 | 755.62 | 0% | 755.62 | |
| E** | Mild | 151.27 | 102.42 | 253.69 | 10% = 25.21 | 279.06 |
| Moderate | - | - | - | - | - | |
| F* | Mild | 259.38 | 145.40 | 404.78 | 0% | 404.78 |
| Moderate | 259.53 | 145.40 | 405.00 | 0% | 405.00 | |
| G* | Mild | 154.85 | 375.79 | 530.63 | 0% | 530.63 |
| Moderate | - | - | - | - | - | |
| H** | Mild | 150.93 | 92.32 | 243.25 | 20% = 48.35 | 291.89 |
| Moderate | - | - | - | - | - | |
| I* | Mild | 187.51 | 98.16 | 285.66 | 0% | 285.66 |
| Moderate | - | - | - | - | - | |
| J** | Mild | 226.12 | 72.93 | 299.04 | 0% | 299.04 |
| Moderate | 247.72 | 72.93 | 320.64 | 0% | 320.64 | |
| K** | Mild | 176.57 | 124.55 | 301.12 | 10% = 29.93 | 331.23 |
| Moderate | 180.67 | 124.55 | 305.22 | 10% = 30.33 | 335.74 |
3.2.2.2. Distribution Efficiency of CS Services
For the distribution efficiency of CS services, the results showed efficient services for 50 patients (45%) in 9 hospitals, while inefficient CS services were found for 60 patients (55%). The efficiency distribution of CS services is shown in Table 2.
3.2.2.3. Distribution Effectiveness of CS Services
The results showed that there were effective services for 85 patients (77%) and only 25 patients (23%) who received ineffective CS services. The effective distribution of CS services is shown in Table 3.
| Hospital | Types of Cesarean Section | Efficient | Inefficient | Amount | ||
|---|---|---|---|---|---|---|
| N | % | N | % | N | ||
| Class 3 (n=83) |
Mild Moderate |
32 - |
42 - |
45 6 |
58 100 |
77 6 |
| Class 2 (n=20) |
Mild Moderate |
11 1 |
65 33 |
6 2 |
35 67 |
17 3 |
| Class 1 (n=7) |
Mild Moderate |
5 1 |
83 - |
1 1 |
17 100 |
6 1 |
| Total (n=110) |
Mild Moderate |
48 2 |
40 - |
52 8 |
60 - |
100 10 |
| Total | 50 | 45 | 60 | 55 | 110 | |
| Hospital | Type of Cesarean Section* | N | Procedure | Outcomes | Effectiveness | |||||||
|---|---|---|---|---|---|---|---|---|---|---|---|---|
| SSI | LOS | Pain | ||||||||||
| >80% | <80% | (+) | (-) | (+) | (-) | (+) | (-) | Effective | Ineffective | |||
| Class 3 (n=83) |
Mild | 77 | 77 | - | - | 77 | 67 | 10 | 4 | 72 | 63 | 14 |
| Moderate | 6 | 6 | - | - | 6 | 5 | 1 | 1 | 5 | 4 | 2 | |
| Class 2 (n=20) |
Mild | 17 | 17 | - | - | 17 | 12 | 5 | - | 17 | 12 | 5 |
| Moderate | 3 | 3 | - | - | 3 | 3 | - | - | 3 | 3 | - | |
| Class 1 (n=7) |
Mild | 6 | 6 | - | - | 6 | 3 | 3 | - | 6 | 3 | 3 |
| Moderate | 1 | 1 | - | - | 1 | - | 1 | - | - | - | 1 | |
| Total | 110 | 110 | - | - | 110 | 90 | 20 | 5 | 115 | 85 | 25 | |
| Service Type | Amount (n) | % |
|---|---|---|
| Efficient and Effective | 40 | 36,4 |
| Efficient and Ineffective | 11 | 10 |
| Inefficient and Effective | 46 | 41,8 |
| Inefficient and Ineffective | 13 | 11,8 |
| Total | 110 | 100 |
3.2.2.4. Distribution Efficiency and Effectiveness of CS Services
This study found that 40 patients received effective and efficient CS services (36.4%). These findings indicate that quality services and benefits at the hospital have occurred in approximately 40 patients (36.4%) who received CS services at the hospital as the subject of the study. Based on the Cartesian diagram, the results of the efficiency and effectiveness of CS services are inefficient and effective, totalling 46 patients (41.8%). The efficiency and effectiveness distribution of CS services are shown in Table 4.
3.3. Design Phase
3.3.1. Prototype Model of Quality Control and Cost Control
The design stage started by creating a conceptual framework for modelling the CS clinical pathway. The design shows an overview of the work system flow (clinical flow) of CS services in a hospital where the activity of light CS services is the main part of the analysis in the accounting management and quality management framework. For this reason, it is often called a quality control and cost control model. In the quality control framework, there is one program, namely the analysis program, for the effectiveness of CS services. Within the cost control framework, there is 1 module and 1 program, namely the indirect cost calculation module using the Activity Based Costing (ABC) method and an efficiency analysis program.
Program effectiveness analysis was carried out by analyzing the procedure for CS service activities in the form of Direct Observational of Procedural Skill (DOPS) activity steps in all activity procedures and the time aspect of how long it took (seconds). All of the above modules and programs, within the framework of the INA-CBG's system of CS services and carried out in hospitals, become an initial product (prototype) model called the “Prototype Model of Quality Control and Cost Control of CS Services in Hospitals.”
3.4. Develop Phase
Material and language experts validate the integrated clinical pathway model [Appendix 1]. The results of the validation are as follows:
(a) No validators use radiology and medical services in mild CS service activities at the hospital.
(b) Considering that 40 patients had effective and efficient CS services, the clinical pathway was revised by eliminating radiology and medical consulting activities. This is based on the validation results where out of the 4 hospitals that conducted the assessment, 3 hospitals did not use radiology activities and medical consultations.
(c) The aspect of procedural accuracy in which all validators (100%) stated that the procedures developed in the module were appropriate and valid (valid).
(d) Aspects of the average time used (time spent) where the results of the validator's assessment of 98% stated that it was appropriate. However, the hospital time spent varies greatly depending on the type of hospital, whether it is a general hospital or a specialized hospital. This difference is also caused by the number of services performed by the hospital. For this reason, the average value of each activity is taken, which is used as the time spent on the module.
(e) Aspects of the day of the procedure, whether the first day or the second day during treatment. In this aspect, all validators (100%) stated that the day of implementation of the procedure was appropriate.
(f) Regarding indirect costs for each activity, all validators (100%) answered they did not know. This is understandable because the problem of calculating costs is the area of study of the hospital finance department.
(g) In the language aspect of this ICP, all validators (100%) said they were easy to understand.
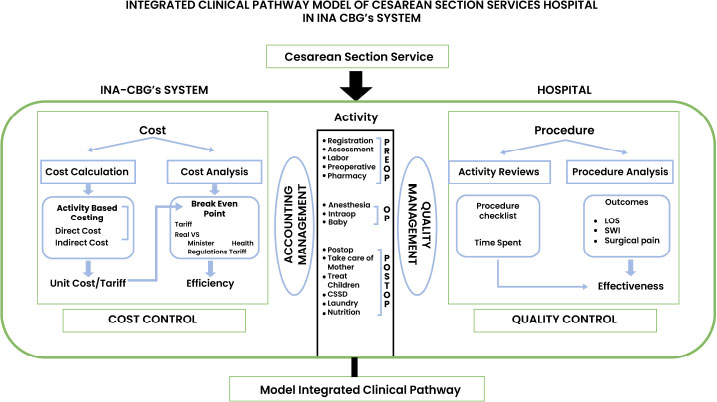
Thus, based on the validation findings, it is known that all aspects of the model show excellent clarity, coherence, and relevance as a model for quality control and cost control for CS services in hospitals. The final cost and quality control model for CS is shown in Fig. (3).
4. DISCUSSION
The unit cost of a CS ranges from US$ 205.81 to US$754.29, with a significant difference due to higher indirect costs at government hospitals compared to private hospitals. Several studies produced disparate results. For instance, the unit cost for government hospitals is lower in Cambodia. Using the top-down costing method, private hospitals charged USD 683.23 while government hospitals charged US$472.13 [24]. In Turkey, Aldogan (2014) also conducted unit cost calculations in private hospitals using the ABC method, which resulted in a cost of USD 358.42 or around IDR 5,370,000 but did not compare it to government hospitals [25].
In Indonesia, Asjanti (2021) conducted qualitative research using a case study approach in Indonesia and found that the direct cost was US$89.2 (46%), the indirect cost was US$282.6 (64%), and the total cost was US$371.9 [26]. These findings are consistent with the results of the present study. Additionally, research conducted at class C hospitals in Indonesia showed that private hospitals have a higher unit cost than government hospitals. The unit costs in government hospitals range from US$158.79 to US$860.66, while private hospitals range from US$411.98 to US$1988.13 [27]. The differences in cost can be attributed to the use of different cost calculation methodologies, differences in human resources related to operating time, total patient care or non-total patient care, and high and low depreciation of equipment and buildings or indirect costs [24, 25]
According to our study, 40 patients (36%) who underwent both effective and efficient CS do not incur costs (cost control) and have also succeeded in achieving established service standards (quality control). Nonetheless, these findings indicate that the CS service performed in this study is still below 50% in applying the principles of quality control and cost control. However, the results imply that there is room for improvement in applying both quality and cost control principles, as the CS service performed below 50%.
Previous studies related to adherence to the clinical pathway for CS services obtained high (effective) adherence to the implementation of CS procedures in 686 patient cases (98%), and 14 patients (2%) had low (ineffective) adherence rates [28]. These findings reflect this study. Another study found that the number of patients according to the clinical pathway (effective) was only 1 patient (1.35%), and not according to the clinical pathway (ineffective), it was 98.65% [29]. Other findings found that 43 patients (83.6%) implemented clinical pathways according to (effective) [30]. The findings of these two studies were very different; the first study showed very low adherence to procedures, and the second showed fairly good adherence to procedures.
According to a recent study, the cost of CS rate >15% has increased by 313% since 2008, resulting in a $7 billion surplus since 2008. This study stated that the reallocation of CS funds would result in $9 billion in savings for the global economy. Global disparities in CS costs have escalated since 2008, leading to an unequal allocation of resources [31]. Therefore, it is necessary to implement a cost-effective clinical pathway for CS [31].
The ICP for CS clinical pathways in this study is a well-organized planning document structured as a map and model of various clinical and non-clinical care activities from different CS service units within the framework. Clinical pathways have several advantages, including enhancing medical services and providing patient-centered care. Patients are encouraged to take an active role in planning, offer feedback on the outcomes achieved, receive education about their care, and collaborate with multidisciplinary teams in medical and nursing services [17, 22]. This model was developed based on the Quality Care Framework model from Donabedian (1973), which emphasizes continuous improvement of the quality control cycle of cost control by examining structure, process, and output/outcome [15].
In this study, researchers have developed a model in the form of an integrated clinical pathway (ICP). This model was developed based on a thorough cost and activity analysis of effective and efficient CS services in 40 cases. The main focus of this model is the workflow of mild CS services, analyzed within the accounting and quality management framework. Here is an overview of the model:
(a) The main part of this model is the CS service activity procedure, carried out from the initial admission to the hospital until discharge.
(b) There are 14 service activities divided into three major groups: pre-operation, operation, and post-operation.
(c) Within the cost control framework, there is 1 module and one program, namely the indirect cost calculation module using the Activity Based Costing (ABC) method and the efficiency analysis program using the Break Even Point method.
(d) Within the quality control framework, there is one program, namely the effectiveness analysis program, which analyses the activity procedures and outcomes of CS services.
(e) The output of all the modules and programs above, within the framework of the INA-CBG's system of CS services, is carried out in the hospital into a module called the module for quality control and cost control for CS services in hospitals.
LIMITATIONS
First, hospital cost data is complicated as each hospital has a different cost structure. Additionally, the terminology and designations used to describe these cost structures can differ significantly from one hospital to another. This can make it challenging for researchers to accurately match the fee structure created by their team with the cost structure provided by the hospital. To overcome this hurdle, hospitals must break down their cost structure and adjust it to align with the structure established by researchers. A standardized cost structure for hospitals that adhere to national accounting standards will be necessary to calculate indirect costs accurately.
Second, the grouping of CS services uses ASA criteria set by anesthesiologists, thus confirming whether the ASA criteria are suitable for diagnosis grouping is necessary. In this study, the grouping of CS services was not carried out by incorporating coding, considering that observations were made directly from when the patient entered until discharge without waiting for the coding process. Still, we used the physical status classification system according to the ASA (American Society of Anesthesiologists) set by the anaesthetist during preoperative assessment. ASA 1 and 2 were considered mild CS services, ASA 3 moderate, and ASA 4 and 5 severe. However, it remains unclear whether the ASA criteria align with diagnosis grouping as no research has been conducted on this topic.
CONCLUSION
The study identified significant costs and customs associated with CS services. Mild CS services range from US$205.81 to US$754.29 per unit, while moderate CS services cost between US$305.22 and US$755.62. Regarding tariffs, mild CS services cost between US$246.97 and US$754.29, while moderate ones fall between US$320.64 and US$755.62. The Integrated Clinical Pathway model is obtained as a cost and quality control model for CS services at the hospital with two modules: one for cost quality control and one for calculating indirect costs using the Activity Based Costing (ABC) method in hospitals. Hospitals should consider implementing the ICP model for CS service to avoid financial losses resulting from changes in health financing policies.
LIST OF ABBREVIATIONS
| 4-D | = Define, Design, Develop, and Dissemination |
| ABC | = Activity Based Costing |
| ASA | = American Society of Anesthesiologists |
| CS | = Cesarean Section |
| DOPS | = Direct Observational of Procedural Skill |
| ICP | = Integrated Clinical Pathway |
| INA-CBGs | = Indonesia-Case Based Groups |
| LOS | = Length of Stay |
ETHICS APPROVAL AND CONSENT TO PARTICIPATE
Ethical approval for this research was granted by the Research Ethics Committee Faculty of Medicine, Andalas University, Padang, Indonesia (Approval number: 1133/UN.16.2/KEP-FK/2021.
HUMAN AND ANIMAL RIGHTS
No animals were used in this study. All human research procedures followed were in accordance with the ethical standards of the committee responsible for human experimentation (institutional and national) and with the Helsinki Declaration of 1975, as revised in 2013.
CONSENT FOR PUBLICATION
Informed consent was obtained from all patients participating in the study.
STANDARDS OF REPORTING
STROBE guidelines were followed.
AVAILABILITY OF DATA AND MATERIALS
The data that support the study's findings are accessible upon request from the corresponding author.
FUNDING
This research is fully funded by Andalas University.
CONFLICT OF INTEREST
The authors declare that there is no conflict of interest. The authors of the paper do not have any financial or personal relationships that might act as a source of bias or impact the findings and conclusions that are given in the paper. The study was carried out in a fair and unbiased manner, free from any external influences or competing interests, and without any academic bias.
ACKNOWLEDGEMENTS
The author would like to thank the Faculty of Medicine and the Faculty of Economics at Andalas University, which have provided facility support to carry out this research.

