All published articles of this journal are available on ScienceDirect.

Logistic Regression Additive Model: Application to Tanzania Demographic and Health Survey Data
Abstract
Background:
The well-being of a child reflects household, community and national involvement on family health. Currently, the global under-five child mortality rate is falling faster compared to any time in the past two decades. However, the progress remained insufficient to match the Millennium Development Goal 4 targets especially in the Sub-Saharan African region.
Objective:
This study aims to visualize and identify factors associated with under-five child mortality in Tanzania, which is essential for formulating appropriate health program and policies.
Methods:
The survey data used for this paper was taken from 2011-2012 Tanzania HIV/AIDS and Malaria Indictor Survey. The study utilizes statistical model that accommodate a response, which is dichotomous and account for non-linear relationship between binary response and independent variable. Generalized additive models was adopted for the analysis. The sample was selected using stratified, two-stage cluster sampling that gave a sample size of 10494 mothers. The model was fitted using proc gam in statistical analysis software version 9.3.
Results:
The results showed that human immunodeficiency virus status of the mother and breastfeeding were associated with under-five child mortality. Furthermore, the results also indicated that under-five child mortality had a quadratic pattern relationship with the number of children ever born, the number of children alive, the number of children five or under in a household and child birth order number.
Conclusion:
Based on the study, our findings confirmed that under-five mortality is a serious problem in the Tanzania. Therefore, there is a need to intensify child health interventions to reduce the under-five mortality rate even further with the development of policies and programs to reduce under-five child mortality.
1. INTRODUCTION
The probability of a child born in a specific year dying before reaching the age five expressed per thousand live births is known as under-five child mortality. The under-five mortality rate is a vital indicator of child well-being including health and nutritional status of children. It can also be used as a measure of the overall development of a nation because it reflects the social, economic and environmental conditions in which the children are growing. Many developing countries all over the world experience the death of children below the age of five (under-five mortality). The world leaders agreed on Millennium Development Goals (MDGs) in 2000 [1, 2]. One of the goals was the Millennium Development Goal [3, 4] which called for the two-third reduction in the under-five mortality rate between 1990 and 2015 [2]. The world has made a substantial progress in reducing under-five mortality rate. Consequently, the number children who died before reaching age five had declined from 12.7 million in 1990 to 6.3 million in 2013 [2]. Despite the decrease in both rate and number of child deaths by more than one-half since 1990 this remarkable progress falls short of the MDG4. In 2015, an estimated 5.9 million children under age of five died and this is equivalent to 16000 child deaths every day. The deaths in low-income countries (76 deaths per 1000 live births) is about 11 times the average rate (7 deaths per 1000 live births) in high income countries. Amongst the globe, Africa remains the region where the risk of child death is highly pronounced. Sub-Saharan Africa, in particular, is the region with huge challenges of highest child mortality. Tanzania is a relatively large sub-Saharan African country sharing borders with Kenya, Uganda, Rwanda, Zambia, Malawi, Mozambique, Burundi, and the Democratic Republic of Congo. Tanzania is considered as one of the oldest known (continuously inhabited) areas on the planet [1]. Tanzania being a developing country found in Sub-Saharan African region, there is still a concern of under-five child mortality rates. The risk of a child dying before completing five years was still high in Sub-Saharan African region (81 per thousand live births) in 2015 while Tanzania had 67 per thousand live births . Therefore, under-five mortality is still a considerable problem in Tanzania.
Some previous studies on under-five child mortality applied logistic regression, and generalized linear mixed models. However, these models assume linearity between response and independent variables and this may lead to invalid statistical inference. There are very few studies that have used the recent data and included HIV/AIDS as a risk factor and accounted for possible non-linear relationship between dependent variable and independent variables. Study by Lemani [5, 6] had an objective for examining factors associated with infant and child mortality. This study applied two methods of analysis to both 2005 and 2010 demographic health survey. These methods were logistic regression and survival analysis. The study found that human immunodeficiency virus (HIV) status of a mother was associated with infant and child mortality in both time periods. The other factors found to be significantly associated with infant and child mortality were, birth order number, age of a mother at birth, sex of a child, wealth index and education level of the mother [6]. Another study Hernandez et al. [5], explored the effect of the risk factors and socio-economic demographic factors on maternal mortality at community level using unique, national wide panel of commune. This study found that one of the factors associated with maternal mortality was time to get to hospital, this implies that the longer it takes to get to hospital the higher the level of maternal mortality [5]. This suggests that there should be an improvement to transportation system and access to health facilities.
The current study accounts for non-linear relationship between under-five child mortality and independent variables. The study involves child mortality which has been done several times but have not focused in accounting non-linear relationship between binary response and independent variables. According to Liu [7], generalized additive models are suitable for exploring data sets and visualizing the relationship between independent variables and dependent variable. The study by Liu [7], illustrated generalized additive model by comparing the proc gam (that fits generalized additive models) procedure and proc glm (that fits generalized linear models) procedure in statistical analysis system. In one of the examples in their study, they applied both proc glm and proc gam to the data with binary response variable. In the discussion Liu [7], stated that generalized additive models provides flexible method for uncovering non-linear relationship between dependent and independent variables. The study described the flexible statistical method that may be used to identify factors associated with under-five mortality. The study also applied exploratory data analysis and visualized the relationship between the outcome variable and predictor(s) [3, 4, 7]. Furthermore, the study adopted the generalized additive models to assess the effect of socioeconomic and demographic factors on under-five deaths.
2. METHODS AND MATERIALS
The most commonly used method by epidemiologist is logistic regression [8] to model data with the binary response variable. This logistic regression is used to model the effect of independent variable Xi'S in terms of linear predictor of the form
 (where β'j are the model parameters for j=0,1,..,p). However, we may have a non-linear relationship between outcome and predictors. To make a valid statistical inference, we may use generalized additive model for a modelling binary response. The generalized additive model replaces
with smooth function
(where β'j are the model parameters for j=0,1,..,p). However, we may have a non-linear relationship between outcome and predictors. To make a valid statistical inference, we may use generalized additive model for a modelling binary response. The generalized additive model replaces
with smooth function
 , where Sj(xj) is unspecified non-parametric function [7]. This function can be estimated in a flexible manner using cubic spline smoother, in an iterative method called back-fitting [7, 9]. Smoother is defined as a tool for summarizing the trend of a response variable as a function of one or more predictors [10]. Smoother produces an estimate of a trend that is less variable than the response variable itself; thus, named smoother [7]. In this study, it was assumed that the data were obtained using simple random sample and generalized additive model is applied. The statistical software used for this study to analyze the data was SAS version 9.3 using the procedure proc gam.
2.1. Data Source, Ethical Clearance, and Description
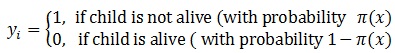
The current paper is based on part of the 2011-2012 HIV/AIDS and Malaria Indicator Survey (THMIS) which was obtained on request from the website http://www.dhsprogram.com which is an open source in 2015. THMIS sample was selected using stratified, two-stage cluster design. In stage 1 a total of 583 clusters were selected (clusters consisted of enumeration areas). In stage 2 approximately 18 households were selected from each cluster which yielded a sample size of 10494 mothers. The response variable in this paper is survival status of a child which is a dichotomous variable showing the status: of a child, alive or not. The response variable is coded as “1” if the child is not alive and “0” if the child is alive. This study considers only 7 variables including HIV status of the respondent which were selected based on literature as follow: the number of children ever born, the number of children five or under, the number of children alive, child birth order number, mother's age, HIV status of the mother and breastfeeding [11].
2.2. Smoothing Method
We describe cubic smoothing spline in a simple setting. Suppose we have the scatter plot of the points, (xi, yi)where y is the response and x is the predictor. The main objective is to fit a smooth curve S(x) which summarizes the dependency of y on x [6, 11]. We seek to find the curve that will minimize
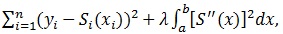
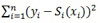 , but the result will be interpolated and not smooth at all [8, 9]. The cubic spline smoother does forces smoothness of S(x) We look at the function S(x) that minimizes
 |
(1) |
Where
 measures the “Wiggliness” of the function S, If the
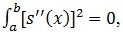 it indicates straight line which implies that we have the function of S that is linear. However, non-linear function S will produce value
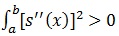 (smooth S is highly non-linear). A Large value of smoothing parameter λ will force S to be smooth. The smoothing parameter controls the tradeoff between goodness-of-fit that is measured by (yi - Si(xi))2 and the smoothness [7, 12, 13]. This parameter must be chosen wisely since it plays important role in estimation. Amongst methods used to estimate a smoothing parameter (λ), we have generalized cross validation (GCV). Suppose we are given the value of the smoothing parameter, the solution to the cubic spline. There are fast and stable iterative methods or algorithm available for computation of the fitted curve. One of these algorithms is known as back-fitting. Back-fitting can fit an additive model using any regression type fitting mechanism [14].
2.3. Generalized Additive Logistic Regression Model
One of the popular techniques for modeling binary data is a logistic regression since the data had a dichotomous response variable.
 |
X = (Xi1, Xi2, ....,Xip) is a vector of covariates and is the binary outcome variable in this study. The usual logistic model [8] for binary outcome is given as
 |
(2) |
The basic idea of the generalized Additive models is to replace the linear predictor with an additive predictor [6]. The assumption for logistic regression still applies except the linearity assumption. The generalized logistic additive model is given by
 |
(3) |
The functions S1, S2,....,Sp are estimated using the procedures described above. One can also have a semi-parametric generalized additive model. This happens when the model consists of parametric and non-parametric terms. The interaction effects can also be incorporated to the generalized additive model. This model with two parametric and two non-parametric predictors is of the form.
 |
(4) |
In general, the semiparametric logistic model is written as
 |
(5) |
This function Sj(Xj) can be estimated in a flexible manner using cubic spline smoother, in back-fitting methods discussed earlier and to estimate βj for categorical variable(s) penalized likelihood can be used. This likelihood is maximized by using iterative methods such as Newton-Raphson [9, 15].
2.4. Relationship Among Predictors
The technique used to measure the relationship between two or more variables is known as correlation. If two variables are correlated, this may imply that they vary together [5, 9]. The correlation value lies between (-1) and (+1) If the correlation coefficient is positive this means that one variable increases as the other variable increases. When the correlation is closer to 1, this means there is a strong relationship between two variables. This implies that the change in one variable is strongly correlated with the changes in the second variable. If the correlation is close to zero, this means that there is a weak relationship between two variables. The changes in one variable are not correlated with the changes in the second variable. However, we cannot conclude just based on this number. We can also test for the significance of the relationship between variables. The null hypothesis that can be tested is that there is no correlation between two variables.
3. RESULTS
The generalized additive models are useful in finding a predictor-response relationship in several kinds of data without using a specific model. The generalized additive models combine the abilities to explore the non-parametric relationship together with the distributional flexibility of generalized linear models [16, 17]. The SAS procedure proc gam scales well the increasing dimensionality and yield interpretable model. Carrying out exploratory modeling with generalized additive model under model option HIV status of the mother and breastfeeding are assumed to have a linear relationship with the log odds. Other predictors are assumed to have the non-linear relationship with log odds, this yield semi-parametric model. Table (1) shows the correlation among predictors with corresponding p-values. The p-value can be used to test if a correlation between two variables is significant or not. The study observes that the number of children alive and child birth order number had a significant positive strong correlation (p-value=0.0001). The correlation between mother age and number of children five year or under was significant and a correlation was weak and negative (p-value =0.0001). The age of the mother, childbirth order and breastfeeding were found to have a significant correlation with one another.
| Pearson Correlation Coefficients, N=10474 | |||||
|---|---|---|---|---|---|
| Prob > |r| under Ho : p = 0 | |||||
| BN | NLC | RCA | NC5U | TCEB | |
| Childbirth order number (BN) | 1 | ||||
| p-value | |||||
| Number of children alive (NLC) | 0.905 | 1 | |||
| p-value | 0.0001 | ||||
| Mother’s age (RCA) | 0.778 | 0.743 | 1 | ||
| p-value | 0.0001 | 0.0001 | |||
| Number of children 5 or under (NC5U) | 0.1001 | 0.2155 | -0.0630 | 1 | |
| p-value | 0.0001 | 0.0001 | 0.0001 | ||
| Number of children ever born (TCEB) | 0.9620 | 0.9470 | 0.7651 | 0.1766 | 1 |
| p-value | 0.0001 | 0.0001 | 0.0001 | 0.0001 | |
One of the critical parts of proc gam results is the “analysis of deviance” shown as part of Table (2) for each smoothing effect in the model, this table also provides chi-square test statistics for comparing the deviance between the full and reduced model (without nonparametric component). The analysis effects in all five continuous predictors were found to be significant at 5% significant level since their corresponding p-values were less than 5%. Table (2) also shows the linear portion and parameter estimates for parametric part of the model, standard errors, t-values, and p-values. In the same table smoothing parameters, degrees of freedom, the number of unique observation and the value of generalized cross validation are shown. The breastfeeding was to be negatively associated with under-five child mortality (p-value=0.0001) [18-20]. The HIV status which is positive was found to be positively associated with under-five child mortality (p-value=0.0478). The age of a mother was not found to be significantly associated with under-five child mortality (p-value=0.099) at 5% significant level. Other predictors such as child birth order number, the number of children alive, and the number of children five or under in a household and number of children ever born were found to be significantly associated under-five child mortality.
| Regression Model Analysis | ||||||||
|---|---|---|---|---|---|---|---|---|
| Parameter | Estimates | Standard errors | t-value | P-value | ||||
| Intercept | -0.40678 | 0.445 | -0.91 | 0.3607 | ||||
| Breastfeeding(BF) | ||||||||
| Yes | -0.54317 | 0.141 | -3.84 | 0.0001 | ||||
| Mother's hiv status (HS) | ||||||||
| Negative | -0.44369 | 0.224 | -1.98 | 0.0478 | ||||
| Child birth order number (BN) | ||||||||
| Linear(BN) | -1.00318 | 0.0884 | -11.34 | 0.0001 | ||||
| Number of children alive (NLC) | ||||||||
| Linear(NLC) | -1.84894 | 0.0698 | -26.49 | 0.0001 | ||||
| Mother’s age (RCA) | ||||||||
| Linear(RCA) | -0.02604 | 0.01578 | -1.65 | 0.099 | ||||
| Number of children 5 and under (NC5U) | ||||||||
| Linear(NC5U) | -0.5094 | 0.05997 | -8.49 | 0.0001 | ||||
| Number of children ever born (TCEB) | ||||||||
| Linear(TCEB) | 2.2481 | 0.1069 | 21.03 | 0.0001 | ||||
| Smoothing Model Analysis Fit Summary for Smoothing Component | ||||||||
| Component | Smoothing Parameter | GCV | Unique observation | |||||
| Spline(BN) | 0.999993 | 1130.244 | 16 | |||||
| Spline(NLC) | 0.998833 | 640.5070 | 15 | |||||
| Spline(RCA) | 0.999867 | 2.553898 | 35 | |||||
| Spline(NC5U) | 0.997705 | 67.08886 | 12 | |||||
| Spline(TCEB) | 0.99805 | 675.7124 | 16 | |||||
| Smoothing Model Analysis of Deviance | ||||||||
| Source | Degree of freedom | Sum of Squares | Chi-Square | P-value | ||||
| Spline(BN) | 1.83 | 6.519255 | 6.519255 | 0.0322 | ||||
| Spline(NLC) | 5.637 | 310.226235 | 310.226235 | 0.0001 | ||||
| Spline(RCA) | 2.137 | 7.341772 | 7.341772 | 0.0293 | ||||
| Spline(NC5U) | 2.489 | 18.549708 | 18.549708 | 0.0002 | ||||
| Spline(TCEB) | 7.532 | 176.09533 | 176.09533 | 0.0001 | ||||
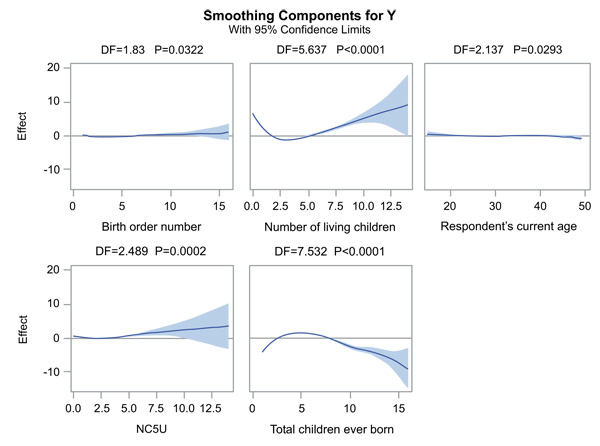
Fig. (1) shows plots of the partial prediction for each of the continuous predictors considered in this article. These plots could be used to investigate as to why fitting logistic regression assuming linearity relationship between log odds and predictors, produces the different result from the generalized additive logistic regression model. These plots were produced by including option plots=componants (commonaxes) which gives curve-wise Bayesian confidence band to each smoothing component, and plot shares the same vertical axis limits [16]. These confidence limits may be wider towards the end as the result of data. The plots show that the partial predictions corresponding to child birth order number, the number of children alive, the number of children ever born and the number of children 5 and under in a household have a quadratic pattern as we have observed on the above table. This suggests that under-five mortality is associated with a quadratic pattern for these predictors. The number of children 5 and under in a household have 95% confidence limits that contain almost the zero axes, but this still suggests a quadratic pattern and is significant which is shown on the table and has been discussed. The mother's age has 95% confidence limits containing zero axes and the line is almost straight, and this shows that mother's age has linear pattern. The child survival status has a linear relationship with the age of a mother.
4. DISCUSSION
The objective of this study was to investigate the relationship between binary response and independent variables which are also identified as the risk factors associated with the under-five mortality in Tanzania. The identified factors can be used to guide policy makers on speeding up the provision of better life to people and evaluate progress made towards achieving the MDG4. A generalized additive model that accommodates binary response variable was used to identify factors associated with under-five child mortality. Since linearity assumption may not hold the generalized additive models is used to make a valid statistical inference. Using generalized additive model, the under-five mortality was found to be significantly associated with the quadratic pattern of childbirth order number, the study by Lemani [6], also found that the birth order number of a child was associated with infant and child mortality. There was a quadratic pattern between under-five mortality and number of children alive, and there is a quadratic effect of the total number of under five children in a household. Under-five mortality was also found to be significantly associated with mother’s HIV status and significantly associated with breastfeeding also. The HIV status of a mother was also found to be significantly associated with infant and child mortality in the study by Lemani [6]. The quadratic effect of mother’s age had no significant effect on under five years’ child mortality.
Using logistic regression where the assumption of linearity between outcome and explanatory is made, would not identify the non-linear relationship between mothers age and under-five child mortality, thus leading to invalid statistical inference. The limitation of this study, the model used an account for the non-linear relationship but does not account for survey design features such as weighting, clustering, and stratification since survey data is used. Failure to account for the design feature may lead to invalid statistical inference such as standard errors being wider or narrower. The future study may involve generalized additive mixed model. The alternative models that may account for correlation between observation could be used as an extension of this study. The main aim of the study was to explore the data and visualize the relationship between dependent and independent variables. The recommendations that can be suggested to the government, policy makers and health department are that they should focus on the prevention of mother to child transmission, raising the awareness on importance of breastfeeding. This may play a significant role in reducing under-five child mortality and be in line with the Millennium Development Goal number four.
CONCLUSION
The objectives of this article were to explore, visualize the data set and identify risk factors associated with the under-five mortality in Tanzania. The identified factors may be used to guide the policy makers on speeding up the provision of better life to people. Generalized additive models were used to achieve the objective of this study. The assumption of linearity between log odds and predictors may not always hold. The alternative approach could the use of generalized additive models. Using generalized additive models, the under-five mortality was found to be significantly associated with the quadratic pattern of childbirth order number, the number of children alive, the number of children ever born and the total number of under five children in a household. Under-five mortality was also found to be significantly associated with mother’s HIV status and breastfeeding at 5% level of significant.
The findings of this article imply that the child survival status is likely to improve in Tanzania. Given breastfeeding is done by mothers. The reduction of mothers who are infected with HIV will also improve the child survival status. The child will likely to survive if the birth order of the child is two and above, more especially if the number of children alive not more than four. The improvement could be achieved by creating an enabling environment more socio-economic development programs, a well-controlled number of the child each mother should have, the improvement of awareness campaigns on health issues and the importance of breastfeeding in the growth of the child. There are avenues for further work on this study. The future study that may be done is to look where was the major occurrence of the under-five mortality contributing to the community in Tanzania by considering spatial analysis. This study may also be extended by considering the generalized additive mixed model by including random effects to the generalized additive models to account for correlation between the observations.
COMPETING INTERESTS
I, the first author, declare that this paper titled, ‘Logistic regression Additive Model: Application to Tanzania demographic and health survey data’ and the work presented is my own. I confirm that:
- Where I have consulted the published work of others, this is always clearly attributed.
- I have acknowledged all main sources of help.
- Where the thesis is based on work done by myself jointly with others,
I have made clear exactly what was done by others. I hereby confirm that all passages which are literally or in general matter taken out of publications or other sources are marked as such.
AUTHOR’S CONTRIBUTIONS
The research included in this paper could not have been performed if not for the assistance, patience, and support of many individuals. I would like to extend my gratitude first and foremost to the second author for monitoring and assistance over the course of this work. He has helped me through extremely difficult times over the course of the analysis and the writing of the paper and for that, I sincerely thank him for his confidence in me. I would additionally like to thank the third author for his support in both the research and especially the helpful advises that has led to this document.
ETHICS APPROVAL AND CONSENT TO PARTICIPATE
The data set used for this study was obtained on request from The Demographic and Health Surveys (DHS) on www.dhsprogram.com in 2015 and may not be passed to anyone. The demographic health survey program website is an open access that contains the recent and old survey data from different countries.
HUMAN AND ANIMAL RIGHTS
No Animals/Humans were used for studies that are base of this research.
CONSENT FOR PUBLICATION
Not applicable.
CONFLICT OF INTEREST
The authors declare no conflict of interest, financial or otherwise.
ACKNOWLEDGEMENTS
This study is made possible through the help and support from everyone. I would like to thank South African Center for Epidemiological Modelling and Analysis (SACEMA) for the financial support. SACEMA is known as a National Research Center established under the Center of Excellence program of the Department of Science and Technology and the National Research Foundation.

