All published articles of this journal are available on ScienceDirect.

Anthropometric Profiles of Child-bearing Women in Ghana — Past Measurements and Future Trends
Abstract
Background:
Temporal changes in anthropometric indices of Ghanaian adults have not been thoroughly researched. In this study, we present results and projections of mean BMI, underweight and obesity prevalence among women (15-49 years) in Ghana.
Methods:
This is a secondary analysis of the mean BMI, underweight and obesity prevalence data reported in the Demographic and Health Survey (DHS) studies in Ghana between 1993 and 2014. Using a simple linear change (regression) model approach, we determine the rate of change of the anthropometric measures and project estimates for the years 2020, 2025 and 2030.
Results:
Between 1993 and 2014, the mean BMI among Ghanaian women increased by 3 kg/m2 and by 2030, the average Ghanaian woman will have a BMI of around 27.3 Kg/m2. Underweight prevalence has decreased by about 45% from 11.3% in 1993/1998 to 6.2% in 2014 and projected to reach 2.2% by 2030. Obesity on the other hand has seen significant increase of over 400% from 3.4% in 1993 to 15.3% in 2014. By 2030, nearly 23% of Ghanaian women are projected to be obese.
Conclusions:
Among Ghanaian women, obesity has now outstripped underweight in terms of public health significance. Greater emphasis and urgent measures to address the rising obesity in this country are needed. While the observed trends should inform future healthcare planning and resource allocation, this should in no way undermine undernutrition prevention efforts, as preventing undernourishment is still a good investment for this country. Rather, a broader perspective that seeks to address both undernutrition and overnutrition healthy individuals should be rigorously pursued.
BACKGROUND
Undernutrition and overnutrition, which are used to represent instances where individuals do not get enough or exceed the nutrients requirements respectively, are both considered to be of significant global public health importance [1, 2]. The United Nations Food and Agriculture Organization (FAO) estimated that in 2014-2016, more than 790 million persons or one in nine individuals across the world were suffering from chronic undernourishment [3]. On the other hand, almost 2 billion individuals were estimated to be overweight including 600 million who were obese in 2014 [4]. The 2013 Global Burden of Disease study demonstrated that between 1980 and 2013, the prevalence of overweight and obesity increased across all parts of the world (both developing and developed countries) and reported that no national success in halting the rising trend has been reported over the last three decades [5].
While overnutrition (as depicted by overweight and obesity) is known to be a positive predictor for the occurrence of major non-communicable diseases (NCDs) including hypertension, diabetes, cardiovascular diseases, musculoskeletal disorders and some cancers [6-8], undernourished individuals are also often unable to maintain natural bodily functions, are at greater risk of infections and demonstrate learning and physical work difficulties [9]. Malnutrition has been estimated to cost the global economy as much as $ 3.5 trillion per year including $2.1 trillion from undernutrition and micronutrient deficiencies and $1.4 trillion from obesity and overweight related-NCDs [10] .
In epidemiology, anthropometric measurements have been considered to be efficient and reliable for assessing nutritional status of individuals [11]. Although, there are varied methods for assessing overweight and obesity in adults, the body mass index (BMI) remains the most frequently used [4]. Individuals have been categorized according to BMI as follows; underweight (BMI <18.5 kg/m2); normal (18.5-24.9 kg/m2); overweight (25.0-29.9 kg/m2) and obese (≥30 kg/m2) [4, 12].
In Sub-Saharan Africa (SSA), undernutrition has been documented for decades, although, recent trends indicate significant nutrition transition resulting in overnutrition [13-15]. Dietary patterns have been evolving across many parts of the continent including decline in consumption of plant-based protein sources such as legumes and an increasing consumption of high-fat and energy dense foods [16, 17].
In Ghana, dietary patterns have been changing along with an epidemiological transition that is resulting in a high burden of NCDs [18, 19]. Obesity and overweight are now considered the major issues of public health importance in this country. The WHO estimates that in 2008, around 7.5% of Ghanaians were obese with higher prevalence in women (10.9%) than men (4.1%) [20]. A major meta-analysis recently estimated that nearly 43% of Ghanaians are overweight or obese, further demonstrating a rising prevalence [21]. Yet, research indicates that undernutrition may still pose significant risk to many Ghanaians. A recent report indicates that Ghana lost over $2billion (almost 6% of GDP) in 2012 as a result undernutrition with the highest element in the cost attributed to potential productivity losses due to undernutrition-related mortalities [22].
The temporal changes in anthropometric profile of Ghanaian adults have not been thoroughly researched. While Dake [23], has previously explored the possible future changes in obesity prevalence among Ghanaian women, the consequent changes in undernutrition patterns has not been analyzed. We believe that simultaneous assessments of undernourishment and overnutrition individuals are important to guide policy decisions as government, health professionals and policy makers take steps to ration scarce resources and invest in areas that are likely to yield greater public health impacts. As such, this study seeks to summarize BMI, underweight and obesity patterns in child bearing Ghanaian women (15-49 years) from 1993 to 2014 and to make projections for the years 2020, 2025 and 2030.
METHODS
Data Sources
Since the early eighties, the Demographic and Health Surveys (DHS) program has collected, analyzed and disseminated population-based health and demographic indicators in over 90 countries [24]. In Ghana, six surveys have been conducted in 1988, 1993, 1998, 2003, 2008 and 2014 [25-30]. With the exception of the 1988 survey, subsequent ones collected weight and height measurements from women of child-bearing age (15-49 years) sampled across all regions of Ghana who gave consent. The weight and height measurements were then used to estimate mean BMI and overweight and obesity prevalence based on BMI classifications previously mentioned [12]. The number of non-pregnant women whose anthropometric measurements were reported were 1789, 1946, 4836, 4381 and 4268 for the surveys conducted in 1993, 1998, 2003, 2008 and 2014 respectively, from urban and rural Ghana (Table 1). We extracted the mean BMI and underweight prevalence from the 1993-2014 survey reports. Obesity prevalence data were also extracted directly from the 2003-2014 reports. The obesity prevalence results for 1993 and 1998 DHS were sourced from Dake [23].
| Participants summary | Survey year | ||||
|---|---|---|---|---|---|
| 1993 | 1998 | 2003 | 2008 | 2014 | |
| Composition by age | <20=121 (6.8%) 20-34=1279 (71.5%) ≥35=389 (21.7%) |
<20=99 (5.1%) 20-34=1282 (65.9%) ≥35=565 (29.0%) |
<20=1002 (20.7%) 20-34=2269 (46.9%) ≥35=1565 (32.4%) |
<20=947 (21.6%) 20-39=2588 (59.1%) ≥40=845 (19.3%) |
<20=778 (18.2%) 20-39=2587 (60.6%) ≥40=903 (21.2%) |
| Composition by Residence | Rural=1276 (71.3%) Urban=513 (28.7%) |
Rural=1425 (73.2%) Urban=521 (26.8%) |
Rural=2457 (50.8%) Urban=2379 (49.2%) |
Rural=2221 (50.7%) Urban=2160 (49.3%) |
Rural=1929 Urban=2340 |
Assumptions and Statistical Analysis
Using the retrieved information, we summarized five data points each for mean BMI, underweight prevalence and obesity rates. A simple linear change (regression) model/equation was created for each of the measures. In doing this, we assumed a linear relationship between the predictor variable (year) and the outcome variables (mean BMI, underweight and obesity prevalence) [31]. The strengths and level of association between the predictor variable and each outcome variable were expressed by the coefficient of correlation (r) [32, 33]. The closer r is to 1 or —1 the stronger the relationship. Additionally, r>0 or r<0 suggest positive and inverse relationships, respectively [32]. For each measure, the obtained linear regression equation and the rate of change were then used to predict the values for future years (2020, 2025 and 2030). This means that we considered the future changes in mean BMI, underweight and obesity prevalence to be a function of the change seen in these measures in the period 1993-2014 [23]. The analyses were conducted with StatsDirect statistical software (version 3.0.0, StatsDirect Ltd, Cheshire UK).
RESULTS
Mean BMI
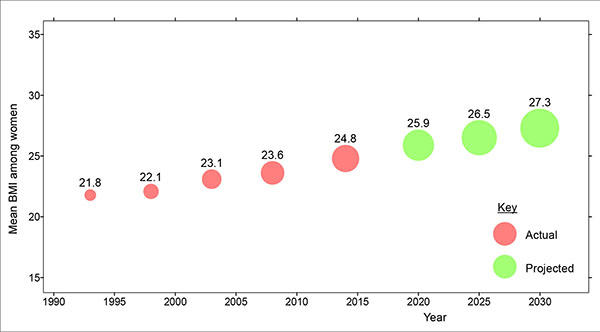
Among women (15-49 years) in Ghana, the mean BMI increased from 21.8 kg/m2 in 1993 to 24.8 kg/m2 in 2014. Based on the five data points, the linear regression model estimated the rate of change as 0.145 (14.5%; correlation coefficient (r) = 0.99). Going with the assumption that the future change in mean BMI will be a function of the change in mean BMI over the period 1993-2014, the mean BMI for Ghanaian women was estimated to reach 25.9 kg/m2, 26.5 kg/m2 and 27.3 kg/m2 for the years 2020, 2025 and 2030, respectively (Fig. 1).
Underweight (BMI<18.5 kg/m2) Prevalence
Underweight prevalence among Ghanaian women decreased from 11.3% in 1993/1998 to 6.2% in 2014 representing a decline of about 45.1%. Based on the five data points from the surveys, the linear regression model estimated the rate of change as -0.25 (25%; correlation coefficient (r) = -0.98). Adopting the same assumptions of a future consistent rate of change, the prevalence of underweight among Ghanaian women were estimated to be 4.7%, 3.5% and 2.2% for the years 2020, 2025 and 2030, respectively (Fig. 2).
Obesity (≥30 kg/m2) Prevalence
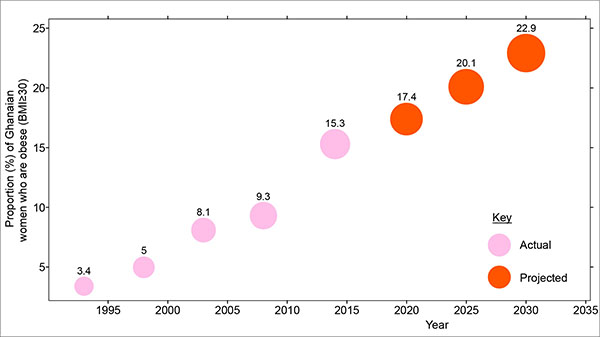
Obesity prevalence among Ghanaian women increased more than four hundred percent from 3.4% in 1993 to 15.3% in 2014. Based on the five data points, the linear regression model estimated the rate of change as 0.545 (54.5%; correlation coefficient (r) = 0.97). Adopting the similar assumptions of a future rate of change consistent with past data, the prevalence of obesity among Ghanaian women were estimated to reach 17.4%, 20.1% and 22.9% for the years 2020, 2025 and 2030, respectively (Fig. 3).

DISCUSSION
The findings of this study reveal a declining prevalence of underweight among Ghanaian women. This is consistent with trends across SSA as prevalence of undernourishment in the region has been estimated to have declined from 33.2% in 1990-92 to 23.2% in 2014-16 [3]. The decline in underweight prevalence in Ghana is a positive development and may highlight the success of the many years of hunger/undernourishment prevention interventions in the country which should give impetus for future directions. The reduction in undernourishment may have positive impacts on women’s health as the risk of infections, osteoporosis, menstrual irregularities, pregnancy complications, and reduced physical activity could all be reduced [9].
On the other hand, the mean BMI and obesity rates among Ghanaian women have increased, and if the observed trends persist then further increases are expected in the future. The increasing obesity is consistent with trends reported across many parts of Africa and globally [5]. The high rates of obesity seen in Ghanaian women is consistent with global trends which indicate obesity to be more prevalent in women [5]. A recent meta-analysis by Ofori-Asenso et al. reported a 1.3 times higher prevalence of overweight and about 3.7 times higher prevalence of obesity in Ghanaian women as compared to men [21]. The gender differences in obesity prevalence in Ghana have been attributed to a myriad of factors including occupational patterns (e.g. many women tend to settle for less physically demanding jobs. e.g., table-top trading) [34], social-cultural construction (women may perceive larger body size as a sign of beauty, happiness in marriage etc., while men may see it as a sign of affluence), appreciation of body size [34-36] and physical activity levels (which are often lower in Ghanaian women than men) [37].
The rising prevalence of obesity could be attributed to megatrends such as globalization along with rapid economic development and urbanization which are contributing to significant shifts in lifestyle across Ghana [18, 38]. Over the last few decades, Ghanaians have witnessed increased accessibility to telecommunication tools including internet, telephone and other communication channels. These have facilitated exposure to western lifestyle and cross-country marketing that promote products such as fatty-rich foods, alcoholic beverages and cigarette [38]. Before independence (late 50s) the Ghanaian diet had low fat content (most of which were plant based) as high-fat rich foods were deemed more expensive compared to high carbohydrate staples. In recent years, this has changed due to increased availability and access to fat-rich products as a result of widespread importation and marketing and this has increased consumption. Ghana still remains a net importer of food and agricultural products spending more than $1.2billion on food importation in 2012 [39]. The country’s dependence on importation is often traced to the lack of subsidies to local farmers and the interventions of institutions like the World Bank and IMF that encouraged governments in poor countries like Ghana in the period 1980-2000 to prioritize cash crop (e.g. cocoa) production in an effort to drive export oriented economic growth [18].
Improved economic environment in recent years also means that many Ghanaians now own cars and walk less. Studies have pointed out that “the nutrition transition and the rise in technology-aided, sedentary lifestyles (cars, computers at home and in internet cafes, games consoles for elite and middle class youth) are strongly implicated in Ghana’s obesity and chronic disease epidemics” [40]. Additionally, as Ofori-Asenso and Garcia [38] discussed, the built environment in many urban centres in Ghana has not evolved to meet the expanding population; roads are usually congested and there are not many sidewalks or parks that could encourage physical activities like running and walking. These poor urban planning if not properly addressed could be a catalyst for further escalation of obesity in the country even as other factors drive an obesogenic environment.
The health, social and economic consequences of a rising obesity prevalence could be far-reaching. Already, NCDs like hypertension have assumed greater prevalence among Ghanaians. In a systematic review, the prevalence of hypertension among Ghanaians was estimated to range from 19.3% in rural areas to 54.6% in urban centres with factors such as increased salt intake and raised BMI singled out as major contributors to the rise in prevalence [41]. The prevalence of type 2 diabetes, another condition in which obesity is known to significantly increase risk [42], has increased by about 15 times from 0.4% in 1956 to 6% in 2014 [19]. The impacts of all these changes on productivity losses when estimated could be enormous.
In terms of current and future outlook, our results indicate that obesity has now outstripped undernourishment in terms of public health significance. Yet in Ghana, government’s efforts have continually targeted at reducing hunger and often neglect the growing rate of obesity in the country. This has been compounded by the longstanding misconception that NCDs and risk factors like obesity do not pose significant health challenges [43]. Greater attention and emphasis will be needed from all stakeholders within the country to address the rising obesity prevalence. While more resources should be channelled into this area, issues of rationing are likely to emerge. The approach adopted should not in any way undermine undernutrition prevention efforts, as preventing undernourishment is still a good investment for this country. The perspective proposed is therefore to holistically address undernutrition and overnutrition in a broader “health for all” approach.
Limitations
The limitations of this study mainly relate to the assumption of a linear change in anthropometric measurements with time [31]. While this assumption allows us to easily project into the future, the temporal changes in health status of populations are by no way linear. The model fails to take into consideration possible future changes in lifestyle, adoption of preventive interventions and policies or other population factors which could all influence the overall population health profile. Our analysis, is also limited to women of reproductive age (15-49 years) and may not fully reflect the overall distribution of the measures described among the Ghanaian population. There is also a danger in generalising, as socioeconomic, cultural and regional differences in anthropometric indices among Ghanaian women may abound and all these may need further investigation.
CONCLUSION
Among Ghanaian women, obesity has outstripped undernourishment in terms of public health relevance. The rising obesity will require stronger efforts from government, health care professionals and all stakeholders to institute appropriate policies as well as identify innovative interventions that fit into the Ghanaian health system, which are cost-effective, culturally acceptable and financially sustainable. While the results presented should inform future healthcare planning and resource allocation, this should in no way lead to neglect hunger prevention. Rather, a broader perspective that seeks to address all forms of malnutrition (both undernutrition and overnutrition individuals) within a “health of all” approach should be rigorously pursued.
AUTHORSHIP CONTRIBUTIONS
RO and AAA contributed to study conception, data analysis and manuscript preparation. GA contributed to data analysis and manuscript preparation. All authors read and approved the final manuscript before submission.
SOURCE OF FUNDING
None.
AVAILABILITY OF DATA AND MATERIALS
We declare that the data supporting the conclusions of this article are fully described within the article.
CONSENT TO PUBLISH
Not applicable
ETHICS APPROVAL AND CONSENT TO PARTICIPATE
Not applicable
LIST OF ABBREVIATIONS
| BMI | = Body Mass Index |
| WHO | = World Health Organization |
| DHS | = Demographic and Health Survey |
| FAO | = Food and Agriculture Organization |
CONFLICT OF INTREST
The authors confirm that this article content has no conflict of interest.
ACKNOWLEDGEMENTS
Declared none

