All published articles of this journal are available on ScienceDirect.

Factors Associated with Physical Activity in South Africa: Evidence from a National Population Based Survey
Authors Info & Affiliations
Abstract
Background:
The health benefits of regular physical activity and exercise have been widely acknowledged. Yet physical inactivity remains an issue in South Africa. This study examines factors associated with physical activity amongst South Africans.
Methods:
This analysis used the 2012 nationally representative population-based household survey conducted using a multi-stage stratified cluster sampling design. Multinomial bivariate and multiple logistic regression models were used to determine whether physical activity is significantly influenced by socio-demographic and lifestyle related characteristics.
Results:
Out of 26339 individuals, 57.4 % (CI: 55.9-59) were not physically active, 14.8 % (CI: 13.6-16) were moderately physically active, and 27.8 % (CI: 26.6-29.1) were vigorously physically active. Relative to those who reported physical inactivity, having higher education and being of a higher socioeconomic status increased the likelihood of engaging in moderate physical activity. Increasing age, being female, and living in informal settlements decreased the likelihood of engaging in moderate physical activity. Increasing age, being female, being married, being from rural formal settlements, and having poorer self-rated health reduced the likelihood of engaging in vigorous physical activity.
Conclusion:
The findings suggest that there is a need for health promotion efforts targeting particular groups from selected socio-demographic strata including unhealthy individuals and those from disadvantaged communities.
1. INTRODUCTION
Globally, physical inactivity has been shown to be an independent risk factor for a range of chronic conditions and is one of the major public health challenges globally [1, 2]. Increased physical activity has been shown to lower the risk of coronary heart disease [3-5], type 2 diabetes [6], and hypertension [7]. Despite this knowledge about the benefits of physical activity, physical inactivity and its negative consequences remain a problem worldwide. More specifically, even though communicable diseases, such as HIV and Tuberculosis, are likely persist as the principal health concerns for Sub-Saharan African countries in the near future; non-communicable diseases such as heart disease, diabetes, and hypertension, which are linked to physical inactivity, have become more prevalent [8, 9].
In South Africa, a significant amount of the movement towards obesity and physical inactivity in adults can be accredited to the process of urbanization and associated socio-economic change. There has been a movement away from agriculturally-based economies to cash-based economies and this shift has reduced the need for physical labour and enhanced the need for sedentary or less intensive physical work [8-10]. This is particularly significant as a large amount of the physical activity in which the working class South Africans engage in is through walking for transportation and through physical activities related to their jobs. The levels of physical inactivity, which refers to being engaged in no or very little physical activity at work, at home, for transport or during discretionary time, has been projected to be between 43% and 49% in South African individuals aged 15 years or older [8-10].
Within the context of the above mentioned processes of economic and social change, an improved understanding of the factors associated with physical activity or inactivity is important for the development of effective interventions for promoting regular physical activity in a context of declining physical activity. A variety of factors have been shown to influence the levels of physical activity. These include intrapersonal, interpersonal, organisational, occupational and environmental, social, and lifestyle related factors [10-14].
In South Africa, the understanding of factors of greatest importance in promoting regular physical activity in the general population remains scarce. Studies assessing the prevalence and factors associated with physical activity in the country have largely focussed on specific subpopulations, such as children [15], rural populations [10], and Black women [16]. This study seeks to assess the prevalence and factors associated with physical activity in a representative sample of South African adults. Within these studies of more specific populations within South Africa, McVeigh et al. [15] found that children from low income households and those who had less educated parents were less likely to be physically active. Micklesfield et al. [10] also found that those from lower income households were less likely to be physical active in a sample of rural South Africans. They also found that males had higher levels of physical activity than females. A review by Muthuri et al. [9] found that all of the above mentioned factors influence the levels of physical activity in a review of studies conducted on sub-Saharan children. In addition, they also found that those living in urban areas were less likely to be physically active.
The above studies on eclectic populations within South Africa illustrate the varied contributors to physical inactivity within South Africa. These studies on more specific populations thus offer crucial information. It is however also necessary to get a general sense of the levels and predictors of physical activity and inactivity in South Africa. This study seeks to employ nationally representative data to give this general insight regarding the South African population. Though this study employs self-report data from 2012 [17], it is argued that it still offers crucial information regarding the factors related to physical inactivity in South Africa in general rather than focusing a specific subset of the South African populous. This study employs some of the most recent nationally representative data related to physical activity. It can therefore give researchers a general picture of the state of physical activity in South Africa and offer direction for future, more rigorous research.
2. METHODS
2.1. Data
This study used data from the 2012 population-based survey of HIV prevalence which was based on a multistage stratified cross-sectional design [17]. The 2012 population-based survey of HIV prevalence is the fourth in the series of national HIV-prevalence surveys whose main aim is to investigate HIV prevalence and related behaviour. These surveys have aided the country in understanding the nature of the HIV epidemic as well as related socio-behavioural and contextual factors that drive the epidemic. However, the wide range of information collected by these surveys, including socio-demographic and health related data, allows us to employ this rich data to assess the levels of physical activity and associated factors in South Africa.
Enumeration Areas (EAs) from the 2001 population census informed the master sample on which the sampling of the households was based. A systematic probability sample of 15 households was drawn from each of the 1000 randomly selected EAs stratified by province, locality type, and race in urban areas. Persons of all ages living in the selected households were eligible to participate in the survey. Consenting eligible individuals were given questionnaires to solicit information pertaining to demographic characteristics and behavioural patterns [17]. The current analysis used a sub-sample of those 15 years and older.
2.2. Ethical Consideration
Ethical approval for the study was obtained from the Research Ethics Committee of the Human Sciences Research Council, South Africa (REC: 5/17/11/10). The survey protocol was also approved by the Associate Director of Science of the National Center for HIV and AIDS, Viral Hepatitis, STD and TB Prevention at the USA’s Centers for Disease Control and Prevention (CDC) in Atlanta, USA who offered technical support to the survey.
2.3. Measures
2.3.1. Dependent Variable
The primary outcome variable was physical activity constructed from two questions adapted from the Global Physical Activity Questionnaire (GPAQ) [18]. In particular, the survey in question employed two questions from the GPAQ. Individuals were asked, “Do you do any vigorous intensity sport, fitness or recreational activities in your leisure or spare time, that cause large increases in breathing or heart rate (like running or strenuous sports, weightlifting) for three times a week at least 30 minutes at a time?” and “Do you do any moderate-intensity sport, fitness or recreational activities in your leisure or spare time that cause small increases in breathing and heart rate (like brisk walking, cycling or swimming) for three times a week at least 30 minutes at a time?”. If individuals answered yes to both of these questions, they were classified as vigorously physically active. If individuals answered no to engaging in vigorous activity and answered yes to engaging in moderate activity, they were classified as moderately active. If they answered no to both questions, they were classified as physically inactive. The resulting outcome variable was multinomial (physically inactive=0, and moderately physically active=1, and vigorously physically active=2).
2.3.2. Independent Variables
The explanatory variables were socio-demographic and lifestyle variables. Socio-demographic characteristics included sex (male/female), age in four categories (15 to 19 years, 20 to 24 years, 25 to 49 years, 50+ years), race (Black African/other races (White, Coloured, and Indians/Asians)), marital status (not married/married), educational level (no education/primary school, secondary school, and tertiary/post- school), employment status (not employed/employed), asset based socio-economic status (a composite measure based on availability of essential services and ownership of a range of household assets), and locality type (urban formal/urban informal/rural informal/rural formal). The lifestyle variables were self-reported health status (good/fair or poor), self-reported presence of at least one chronic condition (yes/no), alcohol use based on a questionnaire for Alcohol Use Disorder Identification Test (AUDIT) scale (Saunders et al., 1993), and whether individuals have medical aid (yes/no).
2.4. Statistical Analysis
Descriptive statistics were employed to summarise respondent’s physical activity by socio-demographic and lifestyle factors. Differences between categorical variables were assessed using Pearson's chi-squared test. The relationship between physical activity and each explanatory variable was first assessed using bivariate multinomial logistic regression models. Statistically significant explanatory variables were included in a multivariate multinomial logistic regression model to determine the factors independently associated with physical activity. For the primary outcome variable the reference category was physical inactivity. Relative Risk Ratios (RRR) with 95% Confidence Intervals (CIs) and p values ≤ 0.05 were reported for all statistically significant results. All statistical analyses were performed using Stata software version 12 (Stata Corp, College Station, Texas, USA) and the “syv” command was used to take into account complex survey design.
3. RESULTS
3.1. Descriptive Statistics
Out of the sample of 26339 individuals, 57.4% reported that they were physically inactive, 14.8% reported that they were moderately physically active, and 27.8% of individuals reported that they were vigorously physically active. Table 1 shows that physically inactivity was significantly higher among individuals aged 50 years and older (69.5%), females (67.1%), Black Africans (59.9%), those who were married (60.4%), those had no education/primary education (60.2%), the unemployed (58.5%), those from low SES household (64.3%), those from rural informal settlements (63.9%), those who reported fair/poor self-rated health (70.3%), those who had at least one chronic condition (64.7%), and those who were abstainers or low risk alcohol users (58.1%).
| Variables | Not Physically Active |
Moderately Physical Active |
Vigorously Physically Active |
- | ||||
|---|---|---|---|---|---|---|---|---|
| n | % | 95% CI | % | 95% CI | % | 95% CI | p-value | |
| Total | 26339 | 57.4 | 55.9-59 | 14.8 | 13.6-16 | 27.8 | 26.6-29.1 | |
| Age (years) | ||||||||
| 15 to 19 | 3683 | 39.4 | 36.8-41.9 | 11.9 | 10.2-13.8 | 48.7 | 45.9-51.6 | < 0.001 |
| 20 to 24 | 3415 | 46.6 | 43.6-49.6 | 14.4 | 12.4-16.8 | 38.9 | 36.2-41.8 | |
| 25 to 49 | 11537 | 60.3 | 58.4-62.2 | 14.5 | 13.1-16.0 | 25.2 | 23.7-26.8 | |
| 50+ | 7704 | 69.0 | 66.3-71.6 | 17.4 | 15.2-19.8 | 13.6 | 12.0-15.4 | |
| Gender | ||||||||
| Male | 11393 | 46.9 | 45.1-48.7 | 14.4 | 12.9-16 | 38.7 | 36.9-40.4 | < 0.001 |
| Female | 14946 | 67.1 | 65.3-69.0 | 15.1 | 13.7-16.6 | 17.8 | 16.5-19.1 | |
| Race group | ||||||||
| Black African | 15140 | 59.9 | 58.1-61.6 | 12.4 | 11.1-13.8 | 27.7 | 26.3-29.2 | < 0.001 |
| Others | 11179 | 48.9 | 46.2-51.6 | 23 | 20.8-25.3 | 28.2 | 26.0-30.4 | |
| Marital status | ||||||||
| Not Married | 16695 | 56.2 | 54.6-57.8 | 13.3 | 12.1-14.6 | 30.5 | 29.1-32.0 | < 0.001 |
| Married | 9256 | 60.4 | 57.8-62.9 | 18.1 | 16.2-20.2 | 21.5 | 19.7-23.4 | |
| Education level | ||||||||
| No education/Primary | 13578 | 60.2 | 58.5-61.9 | 12.9 | 11.7-14.2 | 26.9 | 25.4-28.4 | < 0.001 |
| Secondary | 6552 | 52.0 | 49.6-54.3 | 15.9 | 14.1-18.0 | 32.1 | 29.9-34.4 | |
| Tertiary | 2238 | 45.4 | 40.6-50.3 | 24.5 | 19.6-30.0 | 30.1 | 26.6-33.9 | |
| Employment status | ||||||||
| Unemployed | 14290 | 58.5 | 56.7-60.2 | 13.2 | 11.9-14.7 | 28.3 | 26.9-29.9 | 0.001 |
| Employed | 9638 | 55.2 | 53.0-57.4 | 16.3 | 14.7-18.0 | 28.5 | 26.6-30.4 | |
| Asset based SES | ||||||||
| Low SES | 9481 | 64.3 | 62.3-66.3 | 10.1 | 8.9-11.5 | 25.6 | 23.8-27.4 | < 0.001 |
| Middle SES | 8444 | 57.3 | 54.9-59.5 | 14.9 | 13.2-16.9 | 27.8 | 25.6-30.1 | |
| High SES | 8059 | 43.9 | 41.2-46.6 | 23.7 | 21.0-26.7 | 32.4 | 30.1-34.8 | |
| Locality type | ||||||||
| Urban formal | 15562 | 52.1 | 49.8-54.3 | 18.9 | 17.1-20.9 | 29.0 | 27.3-30.8 | < 0.001 |
| Urban informal | 2687 | 63.0 | 59.1-66.8 | 9.7 | 7.8-12.0 | 27.3 | 24.0-30.8 | |
| Rural informal | 5589 | 63.9 | 61.5-66.2 | 9.2 | 7.7-10.9 | 27.0 | 24.8-29.2 | |
| Rural formal | 2501 | 59.3 | 49.3-68.5 | 18.2 | 11.7-27.1 | 22.5 | 18.4-27.2 | |
| Health | ||||||||
| Good | 20977 | 54.3 | 52.6-55.9 | 14.9 | 13.6-16.2 | 30.9 | 29.5-32.3 | < 0.001 |
| Poorer | 5310 | 70.3 | 67.8-72.7 | 14.2 | 12.5-16.2 | 15.5 | 13.7-17.4 | |
| Chronic condition | ||||||||
| No | 20387 | 55.7 | 54-57.3 | 14.2 | 13-15.5 | 30.1 | 28.7-31.5 | < 0.001 |
| Yes | 5770 | 64.7 | 61.7-67.5 | 16.9 | 14.9-19.1 | 18.5 | 16.5-20.7 | |
| Alcohol use | ||||||||
| None/Non-excessive | 22355 | 58.1 | 56.4-59.7 | 14.4 | 13.1-15.8 | 27.5 | 26.2-28.9 | < 0.001 |
| Excessive | 1066 | 47.1 | 42.1-52.2 | 16.8 | 12.8-21.7 | 36.1 | 31.1-41.4 | |
| Medical aid | ||||||||
| Yes | 5977 | 44.3 | 41.1-47.5 | 22.0 | 19.3-25.0 | 33.8 | 31.2-36.4 | < 0.001 |
| No | 20,361 | 60.3 | 58.7-61.9 | 13.1 | 12.0-14.4 | 26.6 | 25.2-27.9 | |
Moderate physical activity was significantly higher among individuals aged 50 years and older (17.4%), females (15.1%), other race groups (23%), those who were married (18.1%), those who had a tertiary education (24.5%), the employed (16.3%), those from high SES households (23.7%), those from urban formal settlements (18.9%), those who reported good self-rated health (14.9%), those who had a chronic condition (16.9%), and those who were excessive alcohol users (16.8%). Vigorous physical activity was significantly higher among individuals aged 15 to 19 years (48.7%), males (38.7%), other race groups (28.2%), those not married (30.5%), those who had secondary education (32.1%), the employed (28.5%), those from high SES households (32.4%), those from urban formal settlements (29%), those who reported good self-rated health (30.9%), those who did not have any chronic condition (30.1%), and those who were excessive alcohol users (36.1%).
3.2. Bivariate Models
Table 2 shows that relative to physically inactive individuals, the decreased likelihood of moderate physical activity was significantly associated individuals 25 to 49 years, being female, those from urban informal, rural informal and rural formal settlements, and those who reported fair/poor self-rates health. The increased likelihood of moderate physical activity was significantly associated with other race groups, being married, having secondary and tertiary level education, unemployed individuals, those from high and middle SES households, and excessive alcohol users.
| - | Moderately Active | Vigorously Active | ||||
|---|---|---|---|---|---|---|
| Variable | RRR | 95% CIs | p-value | RRR | 95% CIs | p-value |
| Age (years) | ||||||
| 15 to 19 | Ref | - | - | - | - | - |
| 20 to 24 | 1.0 | 0.8-1.3 | 0.834 | 0.7 | 0.6-0.8 | < 0.001 |
| 25 to 49 | 0.8 | 0.7-0.9 | 0.020 | 0.3 | 0.3-0.4 | < 0.001 |
| 50+ | 0.8 | 0.7-1 | 0.087 | 0.2 | 0.1-0.2 | < 0.001 |
| Gender | ||||||
| Male | Ref | - | - | - | - | - |
| Female | 0.7 | 0.6-0.8 | < 0.001 | 0.3 | 0.3-0.4 | < 0.001 |
| Race group | ||||||
| Black African | Ref | - | - | - | - | - |
| Others | 2.3 | 1.9-2.7 | < 0.001 | 1.2 | 1.1-1.4 | 0.002 |
| Marital status | ||||||
| Not Married | Ref | - | - | - | - | - |
| Married | 1.3 | 1.1-1.5 | 0.001 | 0.7 | 0.6-0.7 | < 0.001 |
| Education level | ||||||
| No education/Primary | Ref | - | - | - | - | - |
| Secondary | 1.4 | 1.2-1.7 | < 0.001 | 1.4 | 1.2-1.6 | < 0.001 |
| Tertiary | 2.5 | 1.8-3.4 | < 0.001 | 1.5 | 1.2-1.8 | < 0.001 |
| Employment status | ||||||
| Unemployed | Ref | - | - | - | - | - |
| Employed | 1.3 | 1.1-1.5 | < 0.001 | 1.1 | 1-1.2 | 0.276 |
| Asset based SES | ||||||
| Low SES | Ref | - | - | - | - | - |
| Middle SES | 1.7 | 1.4-2.0 | < 0.001 | 1.2 | 1.1-1.4 | 0.005 |
| High SES | 3.4 | 2.8-4.2 | < 0.001 | 1.9 | 1.6-2.2 | < 0.001 |
| Locality type | ||||||
| Urban formal | Ref | - | - | - | - | - |
| Urban informal | 0.4 | 0.3-0.6 | < 0.001 | 0.8 | 0.6-0.9 | 0.015 |
| Rural informal | 0.4 | 0.3-0.5 | < 0.001 | 0.8 | 0.6-0.9 | < 0.001 |
| Rural formal | 0.8 | 0.5-1.5 | 0.576 | 0.7 | 0.5-0.9 | 0.026 |
| Health | ||||||
| Good | Ref | - | - | - | - | - |
| Fair/Poor | 0.7 | 0.6-0.9 | < 0.001 | 0.4 | 0.3-0.5 | < 0.001 |
| Chronic condition | ||||||
| No | Ref | - | - | - | - | - |
| Yes | 1.0 | 0.9-1.2 | 0.798 | 0.5 | 0.5-0.6 | < 0.001 |
| Alcohol use | ||||||
| None/Non-excessive | Ref | - | - | - | - | - |
| Excessive | 1.4 | 1.0-2.0 | 0.030 | 1.6 | 1.3-2.0 | < 0.001 |
| Medical aid | ||||||
| Yes | Ref | - | - | - | - | - |
| No | 0.4 | 0.3-0.6 | < 0.001 | 0.6 | 0.5-0.7 | < 0.001 |
Relative to physically inactive individuals, the increased likelihood of vigorous physical activity was significantly associated with other race groups, being married, secondary and tertiary level education, those from high and middle SES households. Relative to physically inactive individuals the decreased likelihood of vigorous physical activity was significantly associated with Individuals aged 20 to 24 years, 25 to 49 years, and those 50 years and older, being females, those from urban informal, rural informal, and rural formal settlements, and those who reported fair/poor self- rates health, and those s with a chronic medical conditions.
3.3. Multivariate Models
Fig. (1) shows that the decreased likelihood of moderate physical activity compared to physical inactivity remained significantly associated with individuals aged 25 to 49 [OR = 0.7 (0.5-0.9), p = 0.005] and those aged 50 years and older [OR = 0.7 (0.6-0.9), p = 0.045], being female [OR = 0.7 (0.6-0.8), p < 0.001], those from urban informal settlements [OR = 0.7 (0.5-0.9), p = 0.028] and those from rural informal settlements [OR = 0.7 (0.5-0.9), p = 0.009] compared to those from urban formal settlements. The increased likelihood of moderate physical activity compared to physical inactivity remained significantly associated with Individuals from high SES households [OR = 2.3 (1.6-3.3), p < 0.001] when compared to those from low SES households.
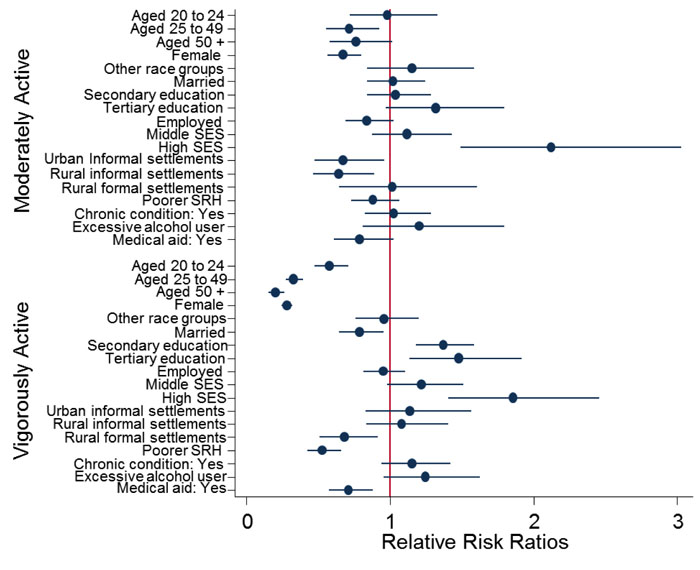
The decreased likelihood of vigorous activity remained significantly associated with those aged 20 to 24 years [OR = 0.6 (0.5-0.7), p < 0.001], 25 to 49 years [OR = 0.3 (0.3-0.4), p < 0.001], and those 50 years and older [OR = 0.2 (0.2-0.3), p < 0.001], being female, [OR = 0.2 (0.1-0.3), p < 0.001], married individuals [OR = 0.8 (0.7-0.9), p = 0.048], those with secondary education [OR = 1.43 (1.23-1.65), p < 0.001] and those with tertiary education [OR = 1.6 (1.2-1.7), p < 0.001] compared to those with no schooling/primary schooling, those from rural formal settlements [OR = 0.7 (0.5-0.9), p = 0.010] compared to those from urban formal settlements, those who reported fair/poor health[OR = 0.5 (0.4-0.7), p < 0.001], and those who did not belong to a medical aid scheme [OR = 0.68 (0.6-0.9), p = 0.002]. The increased likelihood of vigorous physical activity compared to physical inactivity remained significantly associated with those with tertiary level education compared to those with no schooling/.primary schooling [OR = 1.2 (1-1.5), p = 0.048] and those from high SES household compared to those from low SES households [OR = 2 (1.5-2.7), p < 0.001].
4. DISCUSSION
The aim of this study was to assess the factors that influence physical activity in a representative sample of South Africans. Although communicable diseases, including HIV and Tuberculosis, remain the primary health concern for South Africa; non-communicable diseases that are exacerbated by inactivity, such as heart disease, diabetes, and hypertension, have become more prevalent [8, 9]. Generally, the results of this study show that less than half of individuals were moderately or vigorously physically active. This is slightly higher than previously estimated levels in South Africa [10]. This is much lower than activity levels reported from other regions such as South-East Asia, the Americas, and the eastern Mediterranean region [12].
The difference between South Africa and these more developed regions could be linked to the fact that development allows for more leisure time and therefore more time to engage in physical activity outside of work [19]. This is linked to socioeconomic status as those of higher socioeconomic strata in developing regions often lead lifestyles comparable to those in developed regions, particularly in South Africa. This study found that those of a lower socioeconomic status are less likely to engage in physical activity. This finding is similar to previous findings in South Africa in studies of children and those living in rural areas [10, 15]. These lower levels of physical activity amongst those of low socioeconomic status may be because these individuals similarly have less leisure time to engage recreational activities such as sport [20]. This is related to the disparities in physical activity observed between more developed and less developed regions. Those living in developed regions are likely to have more leisure time than those living in less developed regions. Additionally, the disparities in physical activity between low and higher socioeconomic status individuals could be explained by a lack of accessibility to training facilities in low income areas [11, 14]. More educated individuals were also more likely to be physically active. This is similar to previous findings amongst South African subpopulations [10, 15].
Previous studies have consistently found that individuals living in urban areas are more likely to engage in physical activity than those living in rural areas. The physical environments of these areas appear to explain these disparities as individuals living in urban areas are more likely to report using neighbourhood streets, parks, and malls as spaces to exercise [21, 22]. This study has shown somewhat mixed results. While individuals living in informal settings where the above amenities are less available were less likely to engage in moderate physical activity, there was no difference in the levels of vigorous physical activity. Additionally, those in other formal settings (farms) were less likely engage in vigorous physical activity than those in formal urban settings. This suggests that the relationship between physical activity and setting may be more complex and more research is needed.
The results showed that older individuals were less likely to engage in physical activity. Several studies, including Hallal et al. [12] (a global review) and Milanović et al. [23] (Serbia), have found similar results. Indeed, this is the most consistent finding in physical activity epidemiology. Age-related declines in physical activity have been shown to be related to biological factors, particularly age-related changes in the dopamine system which controls motivation for movement [24, 25]. In addition, other factors that come with adulthood have also been postulated to influence physical activity. This study found that marriage reduces physical activity, particularly vigorous activity. This is similar to previous findings noting that family changes that occur in marriage, such as having children, are partially responsible for this reduction [26, 27].
The results showed that males were more likely to be physically active. This is similar to previous findings in North America [28], Europe [29], and Asia [30]. These differences have been attributed to gender norms and stereotypes. Even though natural physical differences are present between women and men, they do not sufficiently to account for sex differences the levels of physical activity, social differences also need to be considered. Men and women are argued to internalize social expectations and this informs their reality. Hence, the perception that physically strenuous activities are linked to masculinity motivates men to more readily engage in these activities while women become less motivated to do so [28].
The results of this study showed that those individuals with poor health were less likely to be physically active. This is similar to previous findings that show that poor health can discourage individuals from participating in physical activities [13]. There is ample evidence illustrating the negative consequences of physical inactivity on poor health [31], this suggests that these two facets may serve to reinforce each other over time.
5. LIMITATIONS
The study is limited by the self-reporting of physical activity, which is not the equivalent of an objective, accelerometry-based assessment. This may introduce a bias due to desirability resulting in over-reporting of physical activity. Self-report can also result in recall bias, which may lead to over- or underestimated physical activity. Nevertheless, the analysis is based on a nationally representative sample and contributes to the evidence base necessary for appropriate interventions in the adult population in South Africa.
CONCLUSION
The findings show that high levels of inactivity are closely associated with people’s socio-economic position, education, sex, race, and health status. Interventions should be tailored to the disadvantaged communities to maximise their effectiveness. Interventions such as the creation and improvement of access to places for physical activity with informational outreach activities, community-scale and street-scale urban design and land use, and active transport policy and practices could be useful in increasing the ease of access to physical activities and could therefore make it easier for marginalized individuals, such as low-income or ill individuals, to engage in physical activities. Additionally, more methodologically rigorous studies are needed to better understand and improve patterns of health-enhancing physical activity amongst South Africans.
AVAILABILITY OF DATA AND MATERIALS
The dataset(s) could be available through the Human Sciences Research Council data research repository via access dataset http://www.hsrc.ac.za/en/ research-data/ upon request.
ETHICAL APPROVAL AND CONSENT TO PARTICIPATE
Ethical approval for the study was obtained from the Research Ethics Committee of the Human Sciences Research Council, South Africa (REC: 5/17/11/10). The survey protocol was also approved by the Associate Director of Science of the National Center for HIV and AIDS, Viral Hepatitis, STD and TB Prevention at the USA’s Centers for Disease Control and Prevention (CDC) in Atlanta, USA who offered technical support to the survey.
HUMAN AND ANIMAL RIGHTS
No humans/ animals were used for the studies that are basis of this research.
CONSENT FOR PUBLICATION
Not applicable.
CONFLICT OF INTEREST
The authors declare that there are no conflicts on interests. This study has been supported by the President’s Emergency Plan for AIDS Relief (PEPFAR) through the Centers for Disease Control and Prevention (CDC) under the terms of 5U2GGH000570. Its contents are solely the responsibility of the authors and do not necessarily represent the official views of CDC.
ACKNOWLEDGEMENTS
The authors would like to thank the fieldworkers and other Human Sciences Research Council staff who assisted in the collection of the data. LM analysed the data. LM, LM, IN, ZL, BC, ZS, and, MM wrote the manuscript. This study was supported by the President's Emergency Plan for AIDS Relief through the CDC under the terms of 1U2GGH001629. Its contents are solely the responsibility of the authors and do not necessarily represent the official views of CDC. Additional support was also received from the Bill & Melinda Gates Foundation, the South African National AIDS Council and the United Nations Children's Fund.

