All published articles of this journal are available on ScienceDirect.

Prevalence and Predictors of Routine Prostate-specific Antigen Screening in Medicare Beneficiaries in the USA: Retrospective Cohort Analysis Using Machine Learning
Abstract
Objective:
To estimate the prevalence and predictors of Prostate-Specific Antigen (PSA) screening among Medicare beneficiary men using machine learning algorithms.
Methods:
A retrospective cohort analysis used the Medicare Current Beneficiary Survey Public Use File (MCBS PUF) data from 2015 and 2016. Predictors of PSA screening were examined through multivariable logistic regression and machine learning techniques.
Results:
Over half (56%) of Medicare beneficiary men had PSA screening during 2015-2016. Ages between 65 and 75 years, education above high school, being married, higher annual income (>$25,000), being overweight or obese, and more than 20 outpatient office visits were significant predictors.
Conclusion:
PSA screening uptake was 56 percent among Medicare beneficiaries and it was driven by beneficiaries’ age, education, marital status, income, body mass index, and number of outpatient visits. Although Medicare provides free annual PSA screening, uptake was higher among high-income beneficiaries. Awareness strategies would help inform privileges for PSA screening under Medicare and the advantages of routine screening for mitigating the health risks.
1. INTRODUCTION
Prostate cancer is one of the most common cancers in American men. At least one in nine American men is projected to be diagnosed with prostate cancer in his lifetime [1]. It is the second leading cause of cancer death in American men and they have a 2.5 percent lifetime risk of dying of prostate cancer [2, 3]. Among all men, the older white men and African-American men have the highest risk. The American Cancer Society (ACS) reported 174,650 new cases of prostate cancer and 31,620 deaths from prostate cancer in 2019 [1].
Timely Prostate-Specific Antigen (PSA) screening is considered essential for early diagnosis of prostate cancer, especially among high-risk men to reduce the development of symptomatic metastatic disease and the consequent morbidity and mortality of advanced cancer [4]. Typically, most men with prostate cancer never experience symptoms and early diagnosis would never happen without screening [3]. PSA is a protein produced by both normal and malignant cells of the prostate gland [5]. The PSA test measures the level of PSA in a man’s blood. A review by the US Cancer Preventive Service Task Force reported PSA-based screening programs in men aged 55 to 69 years may prevent about 1.3 deaths from prostate cancer over 13 years per 1,000 men screened [3]. Screening programs can also prevent at least three cases of metastatic prostate cancer per 1,000 men screened, although chances of false-positive cases and psychological harms cannot be ignored [3].
Nonetheless, the latest recommendation of the ACS and US preventive service task force does not encourage a routine prostate cancer screening for all men [6]. Rather, ACS recommends men with average and high risk of prostate cancer to having an informed decision on early screening [6]. If men of average and high risks are unable to decide on PSA test, the screening decision can be made by the health providers [6]. If no prostate cancer is found in the test, the timing of the next screening will depend on the level of PSA in the blood test [6]. Yearly rescreening is recommended for men with PSA level 2.5 ng/mL or higher [6].
In this scenario, the existing evidence indicates uncertainties in opting for routine PSA screening by patients and providers. Additionally, individual level characteristics and access barriers can also influence the uptake of PSA screening [7]. Insurance coverage remains another key barrier to most preventive care seeking in the USA [2]. However, the existing evidence on the uptake of routine PSA screening and its determinants is limited. A few studies examined the uptake of diagnostic PSA screening using the national cancer registry data [2, 7]. However, the registry gives screening data only for positively diagnosed patients. This study focuses on the uptake of routine preventive PSA screening after the implementation of the US preventive taskforce recommendations among Medicare beneficiaries. Medicare is the largest health insurance program by the U.S. Federal government for people above sixty years, certain young people with disabilities, and people with end-stage renal failure [8]. As older men are at higher risk of prostate cancer, examining Medicare would give a truly representative picture of the routine PSA screening, especially among high-risk older men in the country.
Additionally, this study made a unique attempt in applying machine learning techniques to understand the predictors of routine PSA screening. Although machine learning has a robust scope in predicting preventive care patterns, it has not been widely applied in general and for prostate cancer in the USA and elsewhere [9]. Machine learning applies computer algorithms and a range of statistical models to understand associations of predictive power from examples in data [10]. It has an incredible pattern recognizing ability in big and raw data such as Medicare and registries to inform policy and research.
In this context, the study had two objectives. First, it estimated the prevalence of PSA cancer screening among Medicare beneficiary men, using the beneficiary survey. Secondly, it determined the patient level predictors of PSA cancer screening among Medicare beneficiaries through both conventional regression analysis and machine learning techniques. This study compared machine learning with the conventional regression method in predictive analysis. Unlike the conventional regression analysis, machine learning can easily rank the predictors of PSA cancer screening for better policy navigation [11]. It tested six commonly used machine learning algorithms to understand their level of accuracy in predictive analysis of PSA screening [12].
2. METHODS
2.1. Data Source
We used the Medicare Current Beneficiary Survey public use file (MCBS PUF) data from 2015 and 2016. The MCBS PUF – conducted by the Center for Medicare and Medicaid Services (CMS) – includes a nationally representative sample of the Medicare population. They included Medicare beneficiaries with coverage of part A, part B, Medicare Advantage, prescription drug coverage and private insurance and dual coverage (Medicare and Medicaid). The survey collected information from community dwelling Medicare beneficiaries on self-reported socio-demographics, health status, health behaviors, as well as health insurance, utilization, and access to care. There were separate cohorts for 2015 and 2016 data as well as a pooled cohort combining both years.
2.2. Outcome Variable
The dependent variable was the use of PSA cancer screening test. In the MCBS data, the variable “PSA prostate blood test (past year)” was collected with either “yes” or “no” responses.
2.3. Predictors
We utilized demographic, socio-economic, insurance, health status, and healthcare utilization variables as predictors. Demographic predictors included race, age group, and marital status. Race included four categories – “non-Hispanic white”, “non-Hispanic black”, “Hispanic”, and “other”. There were three age groups – below 65 years, 65 to 75 years, and above 75 years. Marital status consisted of four categories – “married”, “widowed”, “divorced/separated”, and “never married”.
Socio-economic predictors were education, annual income, and place of stay. There were three education categories – “less than high school”, “high school or vocational, technical, business, etc.”, and “more than high school”. Annual income was dichotomized between below and above $25,000. Place of stay was a binary variable as well with respondents from metro and non-metro regions. Insurance predictors consisted of dual coverage (Medicare and Medicaid), part D coverage, enrollment in Medicare Advantage, and private insurance. All insurance predictors were binary variables with “yes” or “no” responses.
Body weight, perceived health, and number of limitations in Activities Of Daily Living (ADLs) were three health status predictors. Body weight predictor was derived out of the Body Mass Index (BMI) variable. The BMI variable had five possible categories - “healthy”, “underweight”, “overweight”, “obese”, and “extreme or high-risk obesity”. This variable was recoded into four categories in our analysis while combining obese and extreme or high-risk obesity to one obese category. Perceive health (asked as – General health compared to one year ago) had five categories “Much better”, “Somewhat better”, “About the same”, “Somewhat worse”, and “Much Worse”. Activities of Daily Living (ADLs) include the performance of the basic activities of self-care, such as dressing, ambulation, or eating. The ADL predictor was the count of limited activities coded as none, one, and two or more.
Healthcare utilization predictors were number of outpatient office visits and inpatient stays. Both outpatient office visits and inpatient stay variables were categorized into six responses – “no office visit”, “1 to 5 office visits”, “6 to 10 office visits”, “11 to 15 office visits”, “16 to 20 office visits”, and “21 or more office visits”.
2.4. Statistical Methods
2.4.1. Descriptive Analysis
Descriptive analyses were conducted for the predictors and the sample characteristics were presented by sub-groups under each predictor as weighted proportions. The correlation was tested among all predictors with Pearson’s correlation coefficient. Bivariable analyses were performed using Rao-Scott tests to demonstrate possible associations between the dependent variable and predictors [13]. Separate Rao-Scott tests were conducted by the year cohort (2015 and 2016) and for the pooled cohort.
2.4.2. Predictive Analysis
First, associations between PSA screening and predictors (demographic, socio-economic, insurance, health status, and healthcare utilization variables) were estimated using a multivariable logistic regression model. Associations were considered statistically significant if the p-value was below 0.05. All estimates were weighted by using sample weights to represent the population of all “ever-enrolled” Medicare beneficiaries.
Secondly, machine learning was used to predict the determinants of PSA screening and also to check if there was any variation in such predictors between conventional multivariate regression analysis and machine learning analysis. We tested five commonly used machine learning algorithms to understand which algorithm provides higher accuracy of prediction. We applied five commonly used supervised machine learning algorithms in healthcare research (logistic regression, support vector machine, K neighbor classification, random forest, and gradient boosting) along with a deep neural network. We employed machine learning predictive analysis on the pooled data [14].
2.4.3. Logistic Regression
Logistic regression is an algorithm used on classification problems (binary or categorical output), where the algorithm fits the best model to describe the relationship between the output (dependent) and input (independent) variables [12].
2.4.4. Support Vector Machine
In support Vector Machine (SVM), the data is classified into two classes based on the output variable over a hyperplane [12]. The algorithm tries to maximize the distance between the hyperplane and the two closest data points from each class.
2.4.5. K Nearest Neighbors
In this algorithm, the class of a new observation is decided by the majority class among its neighbors [15]. We selected 20 nearest neighbors in our model. So, the majority out of these neighbors would decide the predicted class for the new sample.
2.4.6. Random Forest
Random forest is an algorithm that uses a combination of decision trees. Decision trees consist of recursively partitioning the predictors [16]. The algorithm sequentially fits predictors to predict the output starting with the most important predictor and continuing until the weakest in the defined model of predictors. The final predicted result of a random forest model is a summary of the majority vote of results predicted by the individual decision trees. We used 501 decision trees in our model while the trees were extended up to a maximum depth of 10.
2.4.7. Gradient Boosting
Gradient boosting is an ensemble model using shallow and successive decision trees [17]. Each tree learns successively and improves on the previous. Eventually, these successive trees are weighted to produce a combined estimate.
2.4.8. Deep Neural Network
A neural network is a mathematical model that simulates the activity of the human brain [18]. In the Deep Neural Network (DNN), information passes from input to output through several hidden layers. Typically, the inputs are the predictors and the output is the dependent variable. In the course of the flow of information from input to output layers, the algorithm learns patterns in the data. We used a DNN with one input layer, six hidden layers, and one output layer. Further, we used the Rectified Linear Unit (ReLU) activation function to express the relationship between the input and output nodes [18, 19]. We also used dropouts to prevent over-fitting of the DNN. In a dropout, nodes are randomly dropped along with the network connections with other nodes.
For all algorithms, the pooled data was split into training (80 percent of the pooled sample) and validation segments (20 percent). The algorithms were initially trained on the training data and were later validated on the remaining validation segment for determining predictive strength. Five-Fold cross-validation of the data was performed where the data was split into 80% training and 20% validation observations randomly five times, and the average was taken as the final result. The models were evaluated with accuracy (correct prediction of screened candidates as screened and non-screened candidates as non-screened) along with the area under the receiver operating characteristics curve (AUC) [9]. Finally, relative contributions of the predictors were estimated with a relative decrease in the Gini index using the gradient boosting algorithm [20]. All statistical analyses were performed with Stata 15 software and Python programming language [21, 22]. The deep neural network was implemented on the Tensorflow framework [12].
3. RESULTS
3.1. Participants
As shown in Table 1, there were 5,140 and 5,202 respondents in 2015 and 2016 cohorts, respectively, with a combined population of 10,342 respondents. More than half of the sample belonged to the age group of 65 to 75 years, while slightly below two-thirds were above 75 years. Three-fourths of the sample was from the white non-Hispanic race. In terms of the annual income, two-thirds of the respondents had an income of above $25,000. Most of the respondents belonged to metro regions, while more than half were educated above high school level and were married. With insurance coverage, more than 80% did not have dual Medicare and Medicaid coverage and more than two-thirds had part D coverage. While more than half had private insurance, about a third were enrolled in Medicare Advantage.
With respect to body weight, 40.9% were overweight in the pooled sample followed by obese (32.2%) and healthy (26%) individuals. Perceived health was similar to the previous year in 62.2% of respondents, while 15.7% felt it was worse. The majority of the respondents (62.7% in the pooled sample) had no limitations in activities of daily living, while 27.4% had two or more limitations. About half of the sample did not have an outpatient visit whereas a fifth had up to five annual visits. More than 90% did not have an inpatient visit in the previous year.
3.2. Descriptive Data
Table 2 shows the distribution of PSA screening among various socio-demographic and other predictor groups. More than half of respondents (56% in the pooled cohort; 56.5% in 2015; and 55.5% in 2016) reported of PSA screening. Significantly higher proportions of respondents from the 65 to 75 years age group got themselves screened across all cohorts (p<0.001). Relatively more respondents from white non-Hispanic race, annual income above $25,000, education above high school, and married were likely to be screened (p<0.001).
In terms of insurance-related predictors, higher proportions of respondents without dual coverage, but with private insurance were likely to be screened for PSA. Bivariable results were similar in both the 2015 and 2016 cohorts. The probability of screening was higher among respondents with higher than normal body weight (p<0.001) and without any ADLs (not significant in the pooled cohort). Respondents with higher outpatient visits (p<0.001) had higher probabilities of screening.
Table 3 (from multivariable logistic regression) presents the social, demographic, health status, and insurance utilization factors associated with PSA cancer screening among Medicare beneficiaries. Among the 2015 cohort respondents, between 65 and 75 years, education above high school, being married, higher annual income (>$25,000), with Medicare advantage, being overweight or obese, and more than 20 outpatient office visits were significantly (all: p < 0.05) associated with PSA screening use. Similar associations were also observed for the 2016 cohort except for income (not significant) and private insurance (significant) predictors. The combined cohort had similar associations to the 2015 cohort and in addition, having dual Medicare and Medicaid coverage was positively associated with PSA screening.
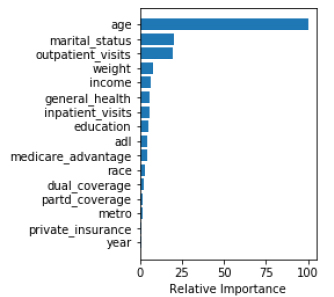
In agreement with the regression analysis, machine learning analysis also showed that age, marital status, number of outpatient visits, body weight, and income were the five most important predictors for PSA screening.
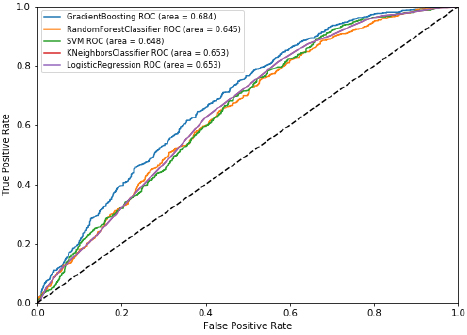
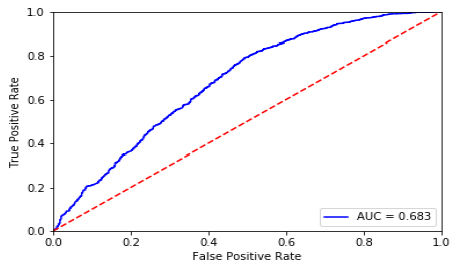
Among various machine learning algorithms (Table 4), random forest had the highest accuracy (65.5%), followed by deep neural networks (65.4%), gradient boosting (65.1%), logistic regression (63.3%), support vector machine (62.2%), and k nearest neighbor (62%). In terms of area under the receiver operating characteristics curve, gradient boosting performed the highest (68.4%), closely followed by deep neural networks (68.3%). Considering both measures, the deep neural networks model was the best performer. (Fig. 1A) presents the ROC and AUC for all models excluding DNN (shown in Fig. 1B). Using the gradient boosted algorithm, the relative importance of variables was plotted (Fig. 2).
| Cohorts | |||
|---|---|---|---|
| Variable | 2015 | 2016 | Total |
| n=5140 | n=5202 | n=10342 | |
| Age group, years | |||
| <65 | 17.5 | 16.5 | 17.0 |
| 65-75 | 51.6 | 51.7 | 51.6 |
| >75 | 31.0 | 31.8 | 31.4 |
| Race | |||
| White non-Hispanic | 74.8 | 75.6 | 75.2 |
| Black non-Hispanic | 9.1 | 9.2 | 9.2 |
| Hispanic | 9.3 | 7.7 | 8.5 |
| Other | 6.8 | 7.5 | 7.2 |
| Income, annual | |||
| <$25,000 | 33.0 | 31.6 | 32.3 |
| >$25,000 | 67.0 | 68.4 | 67.7 |
| Metro region | |||
| Metro | 79.5 | 79.0 | 79.2 |
| Non-metro | 20.5 | 21.0 | 20.8 |
| Education | |||
| No high school | 16.9 | 16.0 | 16.4 |
| High school | 31.0 | 30.4 | 30.7 |
| Above high school | 52.2 | 53.6 | 52.9 |
| Marital status | |||
| Married | 64.6 | 65.6 | 65.1 |
| Widowed | 10.3 | 9.7 | 10.0 |
| Divorced/separated | 14.6 | 14.9 | 14.8 |
| Never Married | 10.5 | 9.8 | 10.1 |
| Dual coverage (Medicare and Medicaid) | |||
| No | 84.5 | 85.4 | 85.0 |
| Yes | 15.5 | 14.6 | 15.0 |
| Part D coverage | |||
| No | 30.7 | 30.1 | 30.4 |
| Yes | 69.3 | 70.0 | 69.6 |
| Has private insurance | |||
| No | 47.1 | 47.3 | 47.2 |
| Yes | 52.9 | 52.7 | 52.8 |
| Enrolled in Medicare Advantage | |||
| No | 66.1 | 65.7 | 65.9 |
| Yes | 33.9 | 34.3 | 34.1 |
| Body weight | |||
| Healthy | 26.0 | 26.0 | 26.0 |
| Underweight | 0.9 | 1.0 | 0.9 |
| Overweight | 40.9 | 40.9 | 40.9 |
| Obese | 32.3 | 32.2 | 32.2 |
| Perceived health | |||
| Much Better | 7.6 | 7.3 | 7.5 |
| Somewhat better | 12.2 | 12.3 | 12.2 |
| About the same | 62.1 | 62.4 | 62.2 |
| Somewhat worse | 15.5 | 15.9 | 15.7 |
| Worse | 2.6 | 2.2 | 2.4 |
| No. of ADLs | |||
| 0 | 61.0 | 64.4 | 62.7 |
| 1 | 9.2 | 10.7 | 9.9 |
| >=2 | 29.9 | 25.0 | 27.4 |
| No. of outpatient visits | |||
| None | 49.3 | 50.7 | 50.0 |
| 1 to 5 | 22.7 | 21.5 | 22.1 |
| 6 to 10 | 13.7 | 13.8 | 13.8 |
| 11 to 15 | 7.4 | 7.3 | 7.3 |
| 16 to 20 | 3.4 | 3.8 | 3.6 |
| > 20 | 3.5 | 3.0 | 3.2 |
| No. of inpatient visits | |||
| None | 90.9 | 91.6 | 91.2 |
| 1 to 5 | 6.8 | 6.4 | 6.6 |
| 6 to 10 | 1.5 | 1.2 | 1.3 |
| 11 to 15 | 0.5 | 0.4 | 0.5 |
| 16 to 20 | 0.3 | 0.4 | 0.4 |
| Year | |||
| 2015 | 49.5 | ||
| 2016 | 50.5 | ||
| Cohorts | ||||||
|---|---|---|---|---|---|---|
| Variable | 2015 | Rao-Scott | 2016 | Rao-Scott | Total | Rao-Scott |
| n=5140 | (p) | n=5202 | (p) | n=10342 | (p) | |
| Age group, years | ||||||
| <65 | 33.7 | <0.001 | 33.0 | <0.001 | 33.4 | <0.001 |
| 65-75 | 62.6 | 62.3 | 62.4 | |||
| >75 | 59.2 | 56.3 | 57.7 | |||
| Race | ||||||
| White non-Hispanic | 58.9 | <0.001 | 56.6 | 0.079 | 57.7 | <0.001 |
| Black non-Hispanic | 48.3 | 51.3 | 49.8 | |||
| Hispanic | 51.1 | 57.0 | 53.8 | |||
| Other | 48.6 | 48.5 | 48.6 | |||
| Income, annual | ||||||
| <$25,000 | 40.3 | <0.001 | 45.7 | <0.001 | 43.0 | <0.001 |
| >$25,000 | 64.5 | 60.1 | 62.2 | |||
| Metro region | ||||||
| Metro | 55.9 | 0.246 | 55.9 | 0.426 | 55.9 | 0.756 |
| Non-metro | 58.7 | 54.2 | 56.4 | |||
| Education | ||||||
| No high school | 43.7 | <0.001 | 48.1 | <0.001 | 45.9 | <0.001 |
| High school | 53.3 | 50.9 | 52.1 | |||
| Above high school | 62.8 | 60.5 | 61.6 | |||
| Marital status | ||||||
| Married | 62.6 | <0.001 | 60.6 | <0.001 | 61.6 | <0.001 |
| Widowed | 53.9 | 52.7 | 53.3 | |||
| Divorced/separated | 51.0 | 49.5 | 50.2 | |||
| Never Married | 30.0 | 33.4 | 31.7 | |||
| Dual coverage (Medicare and Medicaid) | ||||||
| No | 60.5 | <0.001 | 58.3 | <0.001 | 59.4 | <0.001 |
| Yes | 35.0 | 39.2 | 37.0 | |||
| Part D coverage | ||||||
| No | 57.5 | 0.52 | 55.0 | 0.668 | 56.2 | 0.855 |
| Yes | 56.1 | 55.8 | 55.9 | |||
| Has private insurance | ||||||
| No | 50.5 | <0.001 | 49.7 | <0.001 | 50.1 | <0.001 |
| Yes | 61.9 | 60.7 | 61.3 | |||
| Enrolled in Medicare Advantage | ||||||
| No | 55.5 | 0.111 | 54.6 | 0.124 | 55.0 | 0.039 |
| Yes | 58.5 | 57.3 | 57.9 | |||
| Body weight | ||||||
| Healthy | 48.0 | <0.001 | 50.3 | <0.001 | 49.2 | <0.001 |
| Underweight | 42.0 | 49.8 | 46.1 | |||
| Overweight | 61.5 | 58.0 | 59.7 | |||
| Obese | 58.5 | 57.9 | 58.2 | |||
| Perceived health | ||||||
| Much Better | 60.4 | 0.438 | 57.8 | 0.697 | 59.1 | 0.540 |
| Somewhat better | 59.3 | 54.1 | 56.7 | |||
| About the same | 55.6 | 55.3 | 55.5 | |||
| Somewhat worse | 56.0 | 57.2 | 56.6 | |||
| Worse | 55.2 | 50.8 | 53.2 | |||
| No. of ADLs | ||||||
| 0 | 60.8 | <0.001 | 59.3 | 0.046 | 60.0 | 0.059 |
| 1 | 45.3 | 46.1 | 45.8 | |||
| >=2 | 51.2 | 49.8 | 50.5 | |||
| No. of outpatient visits | ||||||
| None | 52.7 | <0.001 | 51.9 | <0.001 | 52.3 | <0.001 |
| 1 to 5 | 54.7 | 53.1 | 53.9 | |||
| 6 to 10 | 62.1 | 61.8 | 62.0 | |||
| 11 to 15 | 68.5 | 64.2 | 66.4 | |||
| 16 to 20 | 57.5 | 69.1 | 63.6 | |||
| > 20 | 74.5 | 66.9 | 70.9 | |||
| No. of inpatient visits | ||||||
| None | 56.3 | 0.923 | 55.6 | 0.559 | 55.9 | 0.882 |
| 1 to 5 | 58.7 | 57.0 | 57.9 | |||
| 6 to 10 | 60.5 | 46.6 | 54.4 | |||
| 11 to 15 | 57.1 | 43.8 | 50.9 | |||
| 16 to 20 | 50.5 | 56.0 | 53.8 | |||
| Year | ||||||
| 2015 | 56.5 | 0.428 | ||||
| 2016 | 55.5 | |||||
| Total | 56.5 | 55.5 | 56.0 | |||
| Cohorts | |||||||||
|---|---|---|---|---|---|---|---|---|---|
| 2015 | 2016 | Total | |||||||
| Variables | Odds ratio | 95% CI | p value | Odds ratio | 95% CI | p value | Odds ratio | 95% CI | p value |
| Age group, years | |||||||||
| <65 | Reference | ||||||||
| 65-75 | 2.08 | 1.59 - 2.73 | <0.001 | 2.29 | 1.77 - 2.97 | <0.001 | 2.16 | 1.79 - 2.61 | <0.001 |
| >75 | 1.66 | 1.27 - 2.17 | <0.001 | 1.65 | 1.28 - 2.13 | <0.001 | 1.64 | 1.36 - 1.97 | <0.001 |
| Race | |||||||||
| White non-Hispanic | Reference | Reference | Reference | ||||||
| Black non-Hispanic | 1.00 | 0.77 - 1.31 | 0.994 | 1.16 | 0.87 - 1.55 | 0.313 | 1.08 | 0.89 - 1.32 | 0.448 |
| Hispanic | 1.09 | 0.82 - 1.43 | 0.558 | 1.38 | 1.05 - 1.81 | 0.023 | 1.21 | 0.99 - 1.48 | 0.059 |
| Other | 0.89 | 0.65 - 1.24 | 0.498 | 0.89 | 0.65 - 1.23 | 0.482 | 0.89 | 0.71 - 1.12 | 0.332 |
| Education | |||||||||
| No high school | Reference | Reference | Reference | ||||||
| High school | 1.27 | 1.01 - 1.59 | 0.041 | 1.07 | 0.86 - 1.33 | 0.556 | 1.16 | 0.99 - 1.36 | 0.063 |
| Above high school | 1.49 | 1.19 - 1.87 | <0.001 | 1.31 | 1.06 - 1.63 | 0.013 | 1.40 | 1.20 - 1.64 | <0.001 |
| Marital status | |||||||||
| Married | Reference | Reference | Reference | ||||||
| Widowed | 0.90 | 0.71 - 1.14 | 0.383 | 0.87 | 0.69 - 1.09 | 0.226 | 0.88 | 0.75 - 1.05 | 0.149 |
| Divorced/separated | 1.00 | 0.79 - 1.27 | 0.981 | 0.83 | 0.66 - 1.04 | 0.102 | 0.89 | 0.76 - 1.05 | 0.18 |
| Never Married | 0.56 | 0.41 - 0.76 | <0.001 | 0.60 | 0.45 - 0.80 | <0.001 | 0.59 | 0.47 - 0.72 | <0.001 |
| Income, annual | |||||||||
| <$25,000 | Reference | Reference | Reference | ||||||
| >$25,000 | 1.71 | 1.40 - 2.10 | <0.001 | 1.02 | 0.83 - 1.25 | 0.863 | 1.32 | 1.14 - 1.52 | <0.001 |
| Dual coverage (Medicare and Medicaid) | |||||||||
| No | Reference | Reference | Reference | ||||||
| Yes | 0.76 | 0.58 - 1.00 | 0.05 | 0.84 | 0.65 - 1.09 | 0.188 | 0.81 | 0.67 - 0.98 | 0.03 |
| Has private insurance | |||||||||
| No | Reference | Reference | Reference | ||||||
| Yes | 0.93 | 0.76 - 1.14 | 0.509 | 1.22 | 1.01 - 1.47 | 0.039 | 1.07 | 0.93 - 1.23 | 0.318 |
| Has Medicare advantage | |||||||||
| No | Reference | Reference | Reference | ||||||
| Yes | 2.14 | 1.66 - 2.77 | <0.001 | 1.99 | 1.57 - 2.53 | <0.001 | 2.05 | 1.72 - 2.44 | <0.001 |
| Body weight | |||||||||
| Healthy | Reference | Reference | Reference | ||||||
| Underweight | 1.34 | 0.68 - 2.64 | 0.404 | 1.35 | 0.66 - 2.73 | 0.411 | 1.31 | 0.79 - 2.15 | 0.291 |
| Overweight | 1.64 | 1.36 - 1.99 | <0.001 | 1.23 | 1.03 - 1.46 | 0.023 | 1.41 | 1.23 - 1.60 | <0.001 |
| Obese | 1.52 | 1.22 - 1.89 | <0.001 | 1.35 | 1.11 - 1.64 | 0.003 | 1.41 | 1.22 - 1.64 | <0.001 |
| No. of ADLs | |||||||||
| 0 | Reference | Reference | Reference | ||||||
| 1 | 0.81 | 0.63 - 1.05 | 0.108 | 0.84 | 0.67 - 1.06 | 0.139 | 0.83 | 0.70 - 0.98 | 0.032 |
| >=2 | 0.91 | 0.76 - 1.09 | 0.287 | 0.90 | 0.75 - 1.07 | 0.224 | 0.91 | 0.80 - 1.03 | 0.135 |
| No. of outpatient visits | |||||||||
| None | Reference | ||||||||
| 1 to 5 | 1.96 | 1.49 - 2.58 | <0.001 | 1.62 | 1.25 - 2.10 | <0.001 | 1.78 | 1.47 - 2.16 | <0.001 |
| 6 to 10 | 2.46 | 1.84 - 3.28 | <0.001 | 2.25 | 1.71 - 2.97 | <0.001 | 2.33 | 1.90 - 2.84 | <0.001 |
| 11 to 15 | 3.20 | 2.32 - 4.43 | <0.001 | 2.44 | 1.77 - 3.36 | <0.001 | 2.77 | 2.20 - 3.48 | <0.001 |
| 16 to 20 | 2.00 | 1.24 - 3.24 | 0.005 | 3.32 | 2.22 - 4.97 | <0.001 | 2.61 | 1.88 - 3.62 | <0.001 |
| > 20 | 5.17 | 3.14 - 8.52 | <0.001 | 2.86 | 1.85 - 4.43 | <0.001 | 3.80 | 2.73 - 5.29 | <0.001 |
| Year | |||||||||
| 2015 | Reference | ||||||||
| 2016 | 0.95 | 0.85 - 1.05 | 0.305 | ||||||
| Model |
Accuracy (%) |
AUC (%) |
|---|---|---|
| Gradient Boosting | 65.1 | 68.4 |
| Random Forest Classifier | 65.5 | 64.5 |
| SVM | 62.2 | 64.8 |
| K Neighbors Classifier | 62.0 | 65.3 |
| Logistic Regression | 63.3 | 65.3 |
| Deep Neural Networks | 65.4 | 68.3 |
4. DISCUSSION
This study assessed routine PSA cancer screening among Medicare beneficiaries in recent times after the USPSTF recommendations. It also applied artificial intelligence, i.e. machine learning algorithms to understand the predictors of PSA cancer screening. Predictive analysis through machine learning reflected similar patterns as in conventional regression analysis. This indicates the reliability and complementarity of machine learning in fetching quick and robust results during the predictive analysis of preventive care. Various machine learning algorithms could be applied in the predictive analysis of Medicare in the future, as it would reduce time and financial costs [12].
Only over half of the Medicare beneficiary men had PSA cancer screening during 2015-2016. Among the 2015 cohort, the 2016 cohort, and the combined cohort between 65 and 75 years, education above high school, being married, higher annual income (>$25,000), being overweight or obese, and more than 20 outpatient office visits were the predictors. Although income was not a predictor for the 2016 cohort, private insurance was to some extent associated with the PSA cancer screening. Additionally, the combined cohort showed having dual Medicare and Medicaid coverage was a predictor.
This study draws policy attention on the relatively lower PSA cancer screening among Medicare beneficiaries. Compared to the 2015 cohort, there was a small decrease for the 2016 cohort. Although Medicare provides absolutely free coverage for PSA cancer screening, the uptake was not considerable. This lower uptake could also be due to the recommendations of the USPSTF, as it does not recommend PSA screening except when men express a preference after being informed of its benefits and risks [3]. The American Urological Association (AUA) and ACS currently recommend PSA screening to all asymptomatic men aged 55–69 years or men older than 50 years with a minimum 10-year life expectancy after they are informed of harms and benefits of screening [2]. There were indications of a slight decline in PSA cancer screening even a couple of years before the USPSTF report 2012 and this decline could also be due to PLCO and ERSPC trials [23, 24]. Houston et al. reported a decline in overall screening with a 7.5% reduction in the incidence of localized prostate cancer, but a 1.4% increase in the incidence of metastatic disease [25]. Another study also found a decrease in PSA screening after the USPSTF’s recommendations [2]. It is worth noting that the results of the USPSTF recommendations are still being assessed in terms of uptake and prostate cancer-related deaths. Three recent studies indicated a decreased PSA screening may increase risks and that possible benefits of reduced PSA screening could be reversed by an increase in cancer-related morbidity and mortality [26-28]. Regular PSA tests prior to cancer diagnosis were associated with decreasing PSA levels at diagnosis, lower biopsy Gleason scores, lower clinical stages, and lower risk disease [26].
Existing evidence indicated strong opinions against PSA cancer screening among patients, providers, and medical bodies based on the USPSTF’s recommendations [2]. This study, on the contrary, found higher odds of PSA screening among men who regularly went to outpatient clinics. Outpatient provider interaction could be an effective health awareness source tool if providers are well-informed on the pros and cons of PSA cancer screening [7]. Also, men who have some existing health issues such as family history of prostate cancer or early signs and symptoms could be more cautious of preventive care [7]. Similarly, overweight or obesity was directly related to uptake. They probably had either higher health risks to consult providers or conscious of increased health risks due to obesity. The evidence reflects a strong interaction between the availability of health information, provider advice, and health service supply to promote preventive care [7].
Among other personal characteristics in agreement with the existing evidence, being married and educated secondary and above increased chances of PSA screening [29]. This study did not find race and location as predictors. However, other recent studies using cancer registry data reported Hispanic populations, African American, and rural men have a higher chance of a delayed diagnosis of prostate cancer and biochemical recurrence due to late diagnosis, while white men have a higher chance of routine screening [7, 30, 31].
In agreement with other recent studies, this study also found that income was a strong predictor for PSA cancer screening [32, 33]. Additionally, aligned with the existing evidence, insurance was a predictor for PSA cancer screening in the 2016 cohort, although Medicare freely covers one PSA screening annually for men over 50 without any co-pay or part B deductible [33]. Medicare beneficiaries with additional coverage of Advantage and Medicaid had a slightly higher odds of screening in the combined cohort. Awareness of Medicare privileges and benefits for PSA cancer screening needs to be more widespread and effective to encourage uptake among low-income groups. Effective multi-faceted awareness strategies are proven to augment the uptake of PSA cancer screening [7].
5. LIMITATIONS
A retrospective cohort design was one of the study limitations and findings need to be interpreted within the study design. The cohort included only Medicare beneficiaries and results cannot be generalizable to the rest of the populations, especially younger men in the country. The study did not include health system predictors, deeper geographical variations, and other individual predictors e.g. smoking, co-morbidity, preventive behavior, and family history of prostate cancer. Study findings are still insightful for Medicare and PSA screening policies in the country.
CONCLUSION
PSA screening uptake was over half among Medicare beneficiaries with education, marital status, income, insurance coverage, obesity, number of outpatient visits being the predictors. Although Medicare provides free PSA screening coverage, income, and having multiple insurance coverage and private insurance coverage were decisive factors for uptake. Awareness strategies would help inform privileges for PSA screening under Medicare. Machine learning and its diverse algorithms could be used further in predicting preventive care patterns under Medicare.
ETHICS APPROVAL AND CONSENT TO PARTICIPATE
Not applicable.
HUMAN AND ANIMAL RIGHTS
Not applicable.
CONSENT FOR PUBLICATION
Not applicable.
AVAILABILITY OF DATA AND MATERIALS
Study used open access data available through CMMS website.
FUNDING
None.
CONFLICT OF INTEREST
The authors declare that there is no conflict of interest, financial or otherwise. The views expressed in the paper are that of authors and do not reflect that of their affiliations.
ACKNOWLEDGEMENTS
Declared none.

