All published articles of this journal are available on ScienceDirect.
Influence of Climate on the Spatiotemporal Distribution of Malaria in Thulamela Municipality, Limpopo Province, South Africa
Abstract
Background:
Malaria, though curable, continues to be a major health and socioeconomic challenge. Malaria cases have been on the rise for the last two years in the malaria-endemic region of South Africa. Thulamela Municipality in Limpopo, South Africa, which falls within several municipalities at Vhembe district that are affected by malaria. About 33,448 malaria cases were reported over a period of 20 years (1998 January-2018 December).
Objective:
The study aims to determine the influence of climate on the spatiotemporal distribution of malaria cases in Thulamela Municipality for the last two decades (1998 January-2018 December).
Methods:
The analysis is divided into two sections, including temporal and spatial distribution of malaria cases, and the correlating climatic and environmental factors. Time series analysis is conducted to determine the variations of malaria and climate. Malaria and climatic factors (rainfall, maximum temperature, minimum temperature) were globally correlated using matrix scatterplot spearman correlation with a certain significance level. The Ordinary Least Squares (OLS) regression was performed to determine the significant climate factors that locally affect the spatial distribution of malaria cases. The local environmental factor (rivers) was analyzed using buffering and terrain analysis.
Results:
A positive spearman correlation of the time series was found with the significance level of 0.01. The climate variables were not strongly significant to the spatial distribution of malaria at the village level. The villages which continued to record high malaria cases were in proximity to rivers by 2km. The Thulamela municipality falls within 20-30°C, which is essential for the incubation of mosquitoes and transmission of malaria. The areas receiving about 125 to 135 mm of total monthly rainfall record high malaria cases. The temperature, rainfall, and rivers are important factors for malaria transmission.
Conclusion:
Knowledge of the drivers of the spatiotemporal distribution of malaria is essential for a predicting system to enhance effective malaria control in communities such as the Thulamela municipality.
1. INTRODUCTION
Malaria is regarded as a life-threatening disease in the world, with approximately 3.4 billion people recorded to be vulnerable to the disease [1]. In 2017, about 231 million malaria cases were recorded with an estimated 416,000 deaths globally. Out of this amount, the Africa region accounts for about 212 million or 92% of the total global cases [2]. Although about 20 million reductions in malaria cases were reported in 2017 than in 2010, the global data for the period of 2015-2017 indicated that there was no significant progress in reducing global malaria burden [2]. In addition, malaria incidence rate declined globally between 2010 and 2017, from 72 to 59 cases per 1000 population at risk. However, the number of cases per 1000 population at risk has stood at 59 for the past 3 years [2].
In South Africa (SA), records have shown that Mpumalanga, Limpopo, and Kwazulu-Natal provinces are mostly affected by malaria [3]. However, Limpopo districts were highly affected than any other provinces [4, 5]. In Limpopo, between the years 1998 and 2007, a total of 58,768 malaria cases were reported with 628 deaths [6]. High malaria outbreaks were recorded during warm and rainy seasons between the months of September and February [5, 7].
Malaria control in South Africa was implemented early around the year 1948. The Dichloro Diphenyl Trichloroethane (DDT), for indoor residual spraying, was reported to be successful, leading to the decline of malaria transmission in the country [8]. Around the year 1996, DDT was replaced with synthetic parathyroid insecticides. The replacement was in sync with a drastic increase in malaria cases between 1999-2000. Studies have shown that climatic, environmental, biological factors, and drug resistance contributed to malaria transmission. Climatic factors, such as temperature, rainfall, and relative humidity, are mostly reported in studies to be positively correlated with malaria outbreaks [7, 9-13]. However, other local environmental factors, such as rivers, cultivated land, and altitude, play a role in the distribution of malaria [14]. For example, a study [15] found a significant positive correlation between malaria cases and vegetation in a coastal area of Kenya and [16] reported that malaria prevalence has a correlation with variations in rainfall and maximum temperature in Baringo county of Kenya. In general, environmental and climatic variables affect the spatial and temporal distribution of malaria. The immature stage of mosquitoes is aquatic depending on atmospheric air for breathing. In the tropical zone, water temperatures range from 23-27°C, which is conducive for mosquitoes to complete their breeding in two weeks. Rainfall, although an important factor for mosquito incubation, could act as a disadvantage if the intensity of rainfall is high. High-intensity rainfall flushes away breeding sites of mosquitoes.
Despite the Limpopo Province accounting for the most malaria cases in South Africa, more studies have been done over Mpumalanga and KwaZulu-Natal. In addition, there is no existing study that has investigated the driving factors of the spatiotemporal distribution of malaria at the village level. As indicated in the National Climate Change Adaptation Strategy for South Africa [17], effective climate change adaptation and mitigation will require information at a very high resolution. Therefore, conducting malaria research at the local level is imperative. More so, notwithstanding having good malaria control measure in South Africa, the number of malaria cases continued to rise between the years 2012 and 2014 [5] and recently from 2017 [7]. Hence, understanding the influence of climate and environmental factors on the transmission of malaria, at a local scale, will improve the control measures. Therefore, this study aims to determine the spatial-temporal distribution of malaria cases as influenced by climatic and environmental factors at Thulamela Municipality, Limpopo. Knowing the pattern and spatial distribution of malaria and its relationship with a local climate, such as temperature and rainfall, and environmental factors, such as rivers, will play a role in improving the predictability of malaria in the future. This will inform appropriate mitigation methods, such as the indoor residual spraying, to be put in place before malaria cases intensify at Thulamela Municipality.
2. MATERIALS AND METHODS
2.1. Study Area
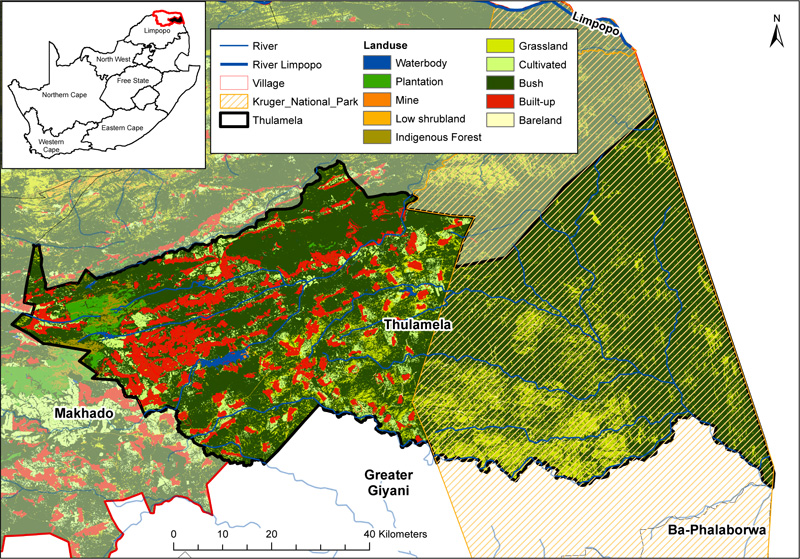
The Thulamela municipality is situated in Vhembe District in the far north of Limpopo province in South Africa. Limpopo is subdivided into 25 local municipalities (Fig. 1). The Limpopo province has 10% (5,404,868) of the population of South Africa (51,770,560) with 42% of the province accommodated by the Vhembe district [18]. The Kruger National Park occupies about 51% of the municipality in the east (Fig. 1). Small scale agriculture is the dominant economic activity producing bananas, mango, macadamia nuts, and cattle. Vhembe districts account for 63.2% of the total malaria cases within the province [19]. The study area experiences an average annual temperature of 21.9 °C, with an average annual rainfall of 350mm [20].
2.2. Data
2.2.1. Malaria Data
Daily data of malaria cases at the official geographical and administrative boundary of villages in the Vhembe district from the years 1998-2018 was obtained from malaria control programme located in Tzaneen, Limpopo. The data was exported from the malaria information system. The data contains both passive and active malaria data. The passive data are obtained from patients who tested positive of the Plasmodium falciparum at the hospital while the active data are those that were collected through screening methods. Screening methods that were considered were people that lived close or in the same areas with recently confirmed malaria cases. The malaria data also contained records of facility name, date of diagnosis, number of cases, deaths, age, gender, infection, and the facility co-ordinates.
2.2.2. Climate Data
Climate data consists of daily climate variables of daily maximum and minimum temperature, and daily total rainfall amounts from two AWS stations in Thohoyandou and Punda Maria. The data was collected from the South African Weather Service (SAWS) for the years between 1998-2018. Each year has data ranges from January-December.
2.2.3. Spatial Data
South African boundaries of local municipalities and village boundaries were acquired from the Municipal Demarcation Board, which was recently updated in 2016. Land cover data was obtained from the Department of Environmental Affairs, which was recently updated in 2013. Hydrology shapefiles were obtained from the Department of Water and Sanitation, which was recently updated in 2012.
2.3. Analysis
2.3.1. Time Series and Correlation Analysis
Time series analysis was performed using the R software [21]. A time series is a set of sequential data points measured over successive times in chronological order [22]. The time-series measurements are taken in a discrete time-lapse of yearly with twelve-month frequency from 1998-2018 (January to December). Correlation analysis between the malaria case and climate factors was carried out using a Spearman correlation. A p-value of < 0.01 was considered statistically significant. The correlation ranges from -1 to 1, meaning that if the relationship is closer to 1, then there is a strong positive correlation, otherwise, it is strong negative correlation [22].
2.3.2. Spatial Distribution Analysis
Using ArcGIS software (ArcMap 10.6) and spatial analyst tools, two stations with climate variable values (maximum temperature, minimum temperature, and rainfall) were interpolated using Inverse Distance Weight (IDW) interpolation method to get climate values for each village at Thulamela Municipality, Vhembe district [19]. Through spatial join, malaria data and climate data were joined with the shapefile at the village level to perform further statistical methods. The distribution maps of malaria from 1998-2018 were evaluated using ArcMap [23]. The Moran's I values for malaria distribution were obtained through Geoda statistical software with a spatial weight type of distance weight with the use of a distance metric method of Euclidean distance with a bandwidth of 0.046.
The Ordinary Least Squares (OLS) regression was performed to determine the climatic factors that best describe the distribution of malaria at the village level in Thulamela municipality using malaria data of years with the highest malaria cases from January to March and from September to November [5, 7]. If none of the climate factors is significant to the distribution of malaria, then through previous studies, environmental factors will be taken into consideration. The OLS regression model results contain probability fields, VIF (Variance Inflation Factor) values, Jarque-Bera statistics (JB stats), Jarque-Bera p-value (JB p-value), R-squared and Adjusted R-Square values to check if the model is biased and if it performed well [23].
3. RESULTS AND DISCUSSIONS
3.1. Temporal Distribution
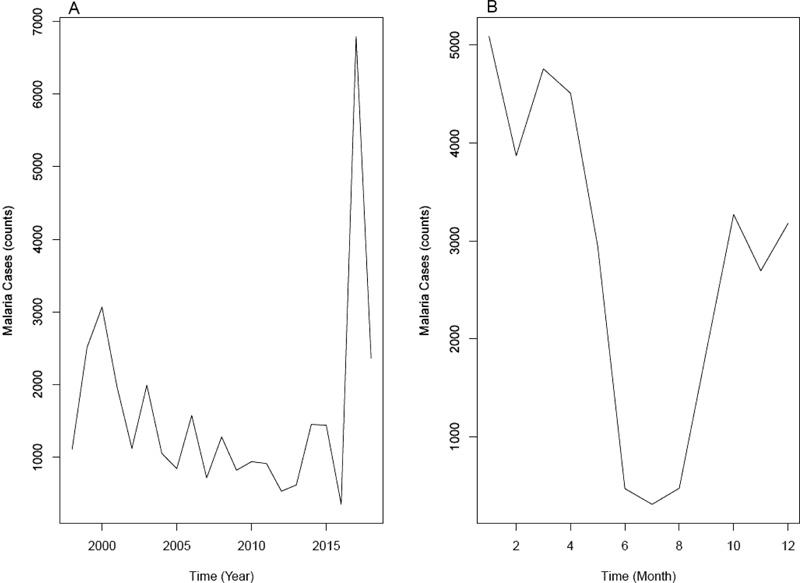
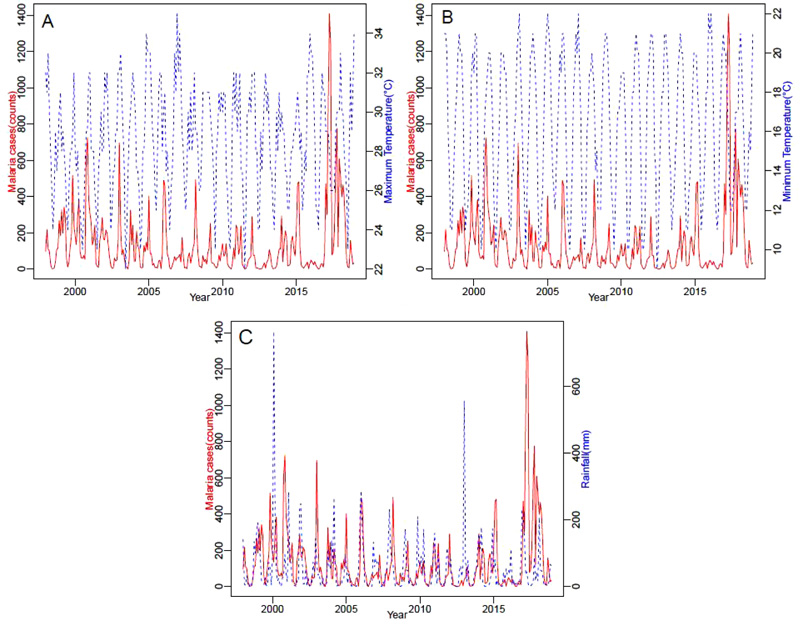
Throughout the years from 1998-2018 (20 years), there have been 33,448 malaria cases reported in Thulamela municipality, out of which, the year 2017 had the highest malaria cases, i.e. 6793, than any other year (2002, 2003, 2006, 2014, then 2008, respectively) (Fig. 2a). The results further reveal that malaria cases increased by more than double from 704 cases in 2010 to 1815 cases in 2013. The year 2012 recorded the lowest number of cases which is 74. Seasonally, as shown in Fig. (2b), malaria cases are more in the summer season from December to February (DJF), including March with peaks in January. Malaria cases are low in the winter seasonduring the months of June till August (JJA). The time series describes the pattern with different chronological time lapse. The time series of malaria cases, maximum temperature, minimum temperature, and rainfall was taken in discrete time-lapse, monthly from 1998-2018 (Fig. 3). There are several peaks and fluctuations in the time series. The peaks in the time series are separated by a few months. Hence, there is a seasonal pattern in the variables. Malaria and climate factors have a decreasing trend from January-July and an upward trend from July-December.
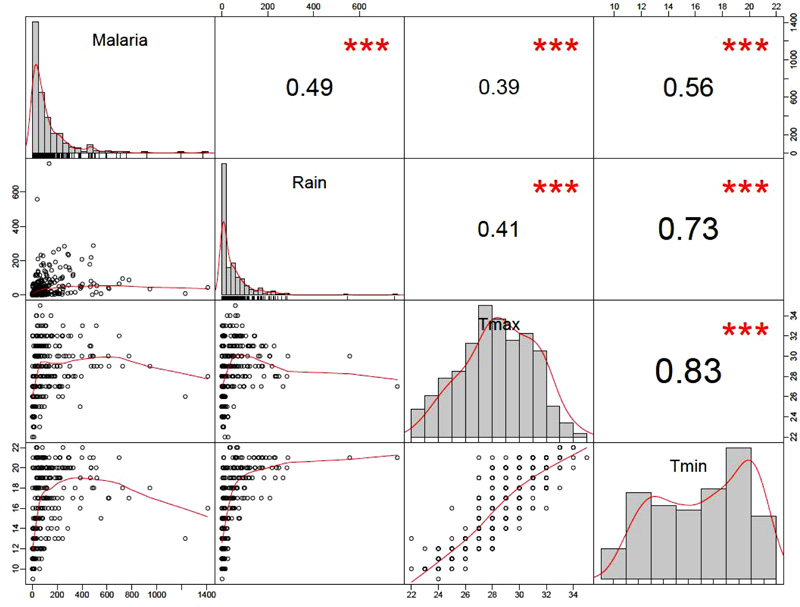
Using Spearman correlation, the relationship between the time series was computed with a significant level of p-value < 0.01 and displayed using matrix scatterplot visualization. The result indicates that minimum, maximum temperature, and total rainfall can account for 56%, 39%, and 49% of the variation in malaria cases, respectively (Fig. 4). The climate variables have a significance level of 0.01 (p-value).
3.2. Spatial Distribution
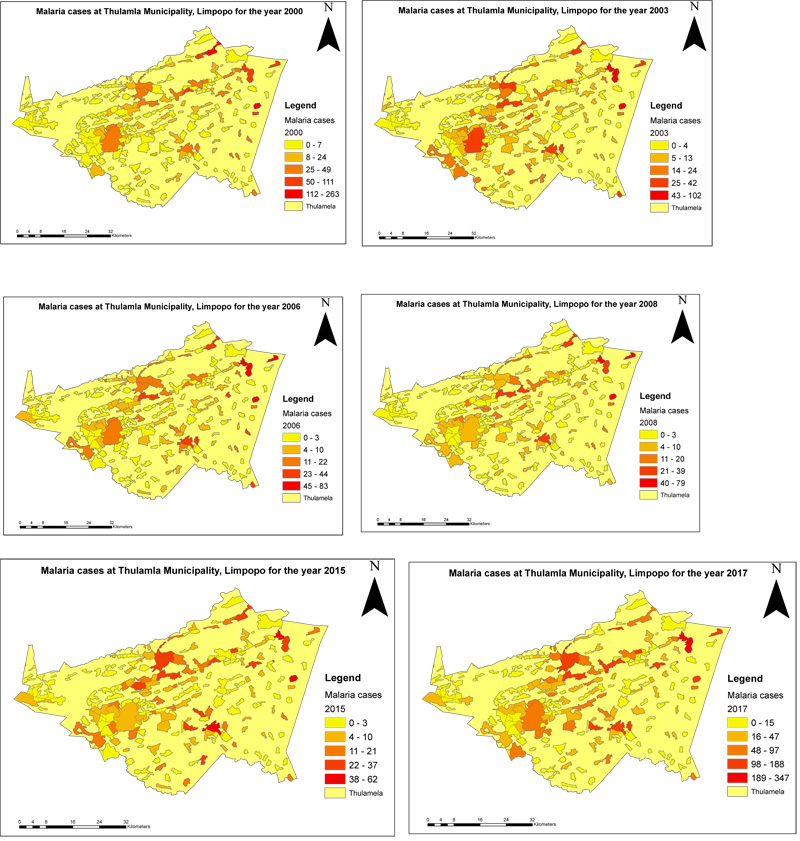
Malaria cases are randomly distributed over the years (1998-2018) with Moran’s I value of <0.05 (Table 1). High malaria cases were dispersed over the study area due to village distribution (far away from each other) (Fig. 5).
The OLS regression was performed to check if the climate variables are significant to the distribution of malaria cases at a village level [19]. The OLS regression was performed for the years 2000, 2003, 2006, 2008, 2014, and 2017. These years were considered since they were the highest peaks compared to others (Fig. 2a). The regression model was conducted from January-March and September-November [5]. The procedure to follow is that the OLS regression residuals must have a random distribution (p-value >0.1). If the requirements are not met, the OLS regression model is biased. When the OLS regression is subjective, then the results on the OLS report are reliable. On the reliable OLS regression report, the independent variables (climate factors) must have a p-value that ranges from 0.01-0.1 and a VIF (Variance Inflation Factor) value of less than 7.5 to be significant [19]. The Jarque-Bera statistics should be insignificant. As shown in Table 2, the year 2003 (January-March), 2006 (September-November), 2008 (January-March and September-November), 2014 (January-March) and 2017 (January-March) have residuals that are randomly distributed. This suggests that the OLS regression model is reliable.
The OLS regression shows that the level of significance (p-value >0.01) of climate factors' influence on the spatial distribution of malaria is not strong (Table 3). From the OLS regression report in the table, the JB stats are not significant, suggesting that the OLS regression is reliable. Locally, the climate factors are uniform and the OLS regression depicted it. With high differences in malaria cases per village and low differences in climate extremes, environmental factors must be correlated to understand the distribution of malaria locally [14]. Hence, their influence may be jointly explained by local environmental factors (rivers, and land use) that added to the influence of the distribution of malaria. Thus, the results support the findings of a previous study [14], suggesting that the relationship between environmental factors and climate factors jointly influence the distribution of malaria.
| Year | Moran’s I Coefficient |
|---|---|
| 1998 | 0.198919 |
| 1999 | 0.168539 |
| 2000 | 0.143164 |
| 2001 | 0.141894 |
| 2002 | 0.106928 |
| 2003 | 0.126237 |
| 2004 | 0.14066 |
| 2005 | 0.183876 |
| 2006 | 0.093537 |
| 2007 | 0.0861056 |
| 2008 | 0.0496228 |
| 2009 | 0.0978582 |
| 2010 | 0.149647 |
| 2011 | 0.1921105 |
| 2012 | 0.132255 |
| 2013 | 0.162482 |
| 2014 | 0.143247 |
| 2015 | 0.0942481 |
| 2016 | 0.247506 |
| 2017 | 0.153692 |
| 2018 | 0.132608 |
| Year | Months | Distribution | Moran’s I index | z-score | P-Value |
|---|---|---|---|---|---|
| 2000 | Jan-Mar | Clustered | 0.087 | 2.104 | 0.04 |
| 2000 | Sep-Nov | Clustered | 0.086 | 2.274 | 0.02 |
| 2003 | Jan-Mar | Random | 0.060 | 1.475 | 0.14 |
| 2003 | Sep-Nov | Clustered | 0.084 | 2.096 | 0.04 |
| 2006 | Jan-Mar | Clustered | 0.079 | 1.878 | 0.06 |
| 2006 | Sep-Nov | Random | 0.036 | 1.186 | 0.85 |
| 2008 | Jan-Mar | Random | 0.045 | 1.127 | 0.26 |
| 2008 | Sep-Nov | Random | 0.041 | 1.037 | 0.30 |
| 2014 | Jan-Mar | Random | 0.048 | 1.219 | 0.22 |
| 2017 | Jan-Mar | Random | 0.059 | 1.452 | 0.15 |
| 2017 | Sep-Nov | Clustered | 0.069 | 1.715 | 0.09 |
| Year | Month | Explanatory Variables | Probability | VIF value | JB-stats | R-squared value |
|---|---|---|---|---|---|---|
| 2003 | Jan-Mar | Max T | 0.999 | >7.5 | 2705.20 | 0.032 |
| 2003 | Jan-Mar | MinT | 0.343 | >7.5 | 2705.20 | 0.032 |
| 2003 | Jan-Mar | Rain | 0.999 | >7.5 | 2705.20 | 0.032 |
| 2006 | Sep-Nov | Max T | 0.563 | >7.5 | 3512.27 | 0.030 |
| 2006 | Sep-Nov | MinT | 0.563 | >7.5 | 3512.27 | 0.030 |
| 2006 | Sep-Nov | Rain | 0.118 | >7.5 | 3512.27 | 0.030 |
| 2008 | Jan-Mar | Max T | 0.569 | >7.5 | 4153.38 | 0.072 |
| 2008 | Jan-Mar | MinT | 0.569 | >7.5 | 4153.38 | 0.072 |
| 2008 | Jan-Mar | Rain | 0.652 | >7.5 | 4153.38 | 0.072 |
| 2008 | Sep-Nov | Max T | NaN | >7.5 | 1751.54 | 0.019 |
| 2008 | Sep-Nov | MinT | NaN | >7.5 | 1751.54 | 0.019 |
| 2008 | Sep-Nov | Rain | 0.171 | >7.5 | 1751.54 | 0.019 |
| 2014 | Jan-Mar | Max T | 0.140 | >7.5 | 6817.15 | 0.097 |
| 2014 | Jan-Mar | MinT | 0.140 | >7.5 | 6817,15 | 0.097 |
| 2014 | Jan-Mar | Rain | 0.693 | >7.5 | 6817,15 | 0.097 |
| 2017 | Jan-Mar | Max T | 0.801 | >7.5 | 6817,15 | 0.097 |
| 2017 | Jan-Mar | MinT | 0.801 | >7.5 | 6817,15 | 0.097 |
| 2017 | Jan-Mar | Rain | 0.801 | >7.5 | 6817,15 | 0,097 |
3.3. Global Versus Local Malaria Analysis
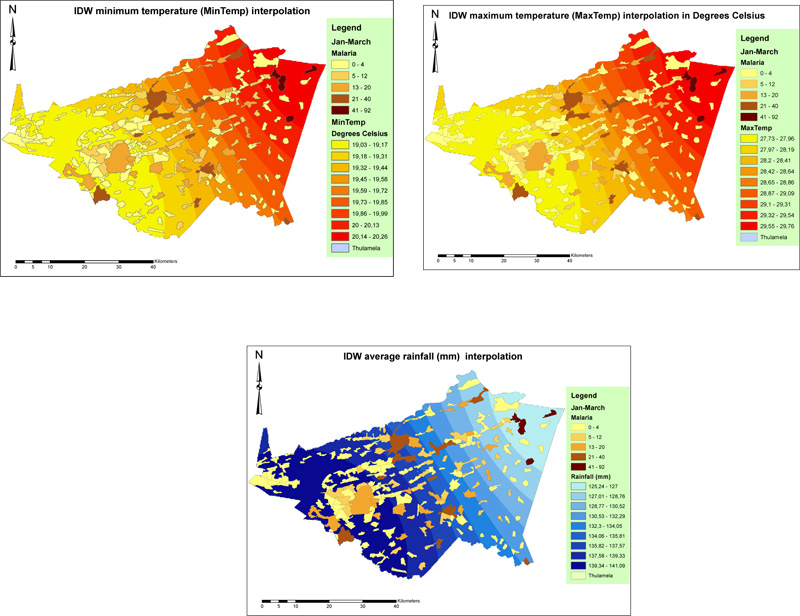
As indicated by the Spearman correlation, the minimum temperature has more influence than other climate variables on the significance level of 0.01. All climatic factors are significant globally with a significance level of 0.01. Spatial analysis is conducted for the year 2017 (January-March) and it was found that villages with high malaria cases are situated in an area of high minimum temperature. Since malaria is randomly distributed and the variations of minimum temperatures across Thulamela is small, the significance of the minimum temperature locally was low, and globally significant. It is evident by spatial visualization where malaria is high, the minimum temperature is also high (Fig. 6). Same applies to the variations of maximum temperature within Thulamela. This result correlates with the findings of the global temporal distribution of malaria at Thulamela. The maximum temperature explains less on the distribution of malaria compared to other climate variables. The temperature range determines the efficiency of mosquitoes to spread malaria over an area [20] (Table 4). As shown in Fig. (6), temperatures at Thulamela municipality are 19-33o C. According to Abiodun Adeola [20], temperature ranges from 20-27 o C (minimum temperature) are ideal to shorten the incubation period of malaria leading to an abundance of malaria vector. These temperature ranges are mainly found in the central and eastern parts of the municipality. Furthermore, total rainfall explains 49% of the variation in malaria in the Thulamela municipality. Looking at the local level (village), high malaria cases are situated in areas that receive less rainfall compared to others-indicating that about 125-135 mm of rainfall is associated with areas of high malaria cases. While areas of high rainfall amount are associated with areas of low malaria cases. This could be in line with the findings of a previous study [21] that high rainfall could wash away breeding sites of the malaria vector leading to the destruction of eggs and less amount of matured adults.
3.4. Environmental Analysis and Climate Factors
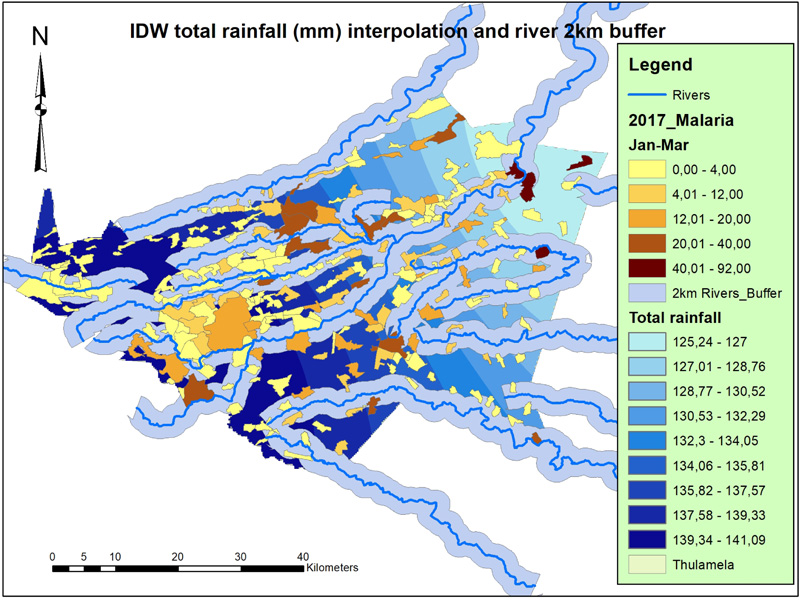
With a buffer of 2 km, it was found that all the villages that have high malaria cases were closer to rivers (Fig. 7). This implies environmental factors contributed to the distribution of malaria and that the OLS regression model was biased since some of the independent variables from local environmental factors were not imported in the model. The rivers are dependent on rainfall.
Hence, villages with high malaria cases are noticed to be in proximity to rivers. The rivers are suitable breeding sites for the vector [24, 25]. The results also indicate that there are villages with rivers in proximity of about 2 km but records low malaria cases. This could be explained by the importance of the combination of environmental and climatic variables at appropriate thresholds that will favor the breeding and survival of the vector and the parasite [7, 24]. Hence, areas in proximity to rivers and high rainfall that recorded low malaria cases, could be a result of the variation in temperature in those areas not meeting the ideal threshold, as shown in Table 4. Also, the low record of malaria cases could be due to the effectiveness of the control measures in the villages, which are not considered in this study.
| Temperature (Degrees Celsius) | Effects on Malaria Transmission |
|---|---|
| >25 | Very important for mosquito lifecycles and must be maintained for a minimum of nine days. |
| 20-30 | Needed temperature for transmission of malaria |
| 20-27 | The incubation of malaria shortens |
| <=16 or >=30 | The rate of malaria is negatively affected |
CONCLUSION
The study demonstrates that for efficient malaria prediction, climate variables alone are not sufficient but should be combined in appropriate weight with environmental variables spatially. Time series analysis has shown that high malaria cases occur in summer seasons. Essential significant variables playing a role in a high occurrence of malaria, as shown in the study, are minimum temperature, total rainfall, and maximum temperature, respectively. Hence, they contain the same pattern with malaria cases of high averages and totals during summer seasons, as evident by the spearman correlation results. The correlation results are significant at the p-value of 0.01.
The malaria distribution over the Thulamela municipality is random at a village level. Hence, predictions need to incorporate the influence of local environmental factors in the area. Local environmental factors are variable over the study area. The climate factors level of significance is not strong. OLS regression aid a way to use local environmental factors as another predictor for malaria distribution over Thulamela municipality.
The climate factors and environmental factors prerequisites are required for efficient malaria transmission of mosquitoes. It was found that one factor is not solitary for the development of vector. Mosquitoes breed well in a wet, humid, and warm area. The rivers act as the habitat for mosquitoes. Hence, villages close to the river by 2km are found to record high malaria cases.
This study could serve as a catalyst for the prediction of malaria cases at Thulamela municipality, which is essential for effective malaria control. This study reveals that even at a local scale, malaria cases distribution varies spatially hinged on the spatial variation of the environmental and climatic variables. Hence, the results of the study can be used by malaria control agencies to enhance their strategies for effectively targeting the indoor residual spraying, among other interventions.
ETHICS APPROVAL AND CONSENT TO PARTICIPATE
This study was approved by the research ethics committee of the University of Pretoria, South Africa with approval no (EC140721-065).
HUMAN AND ANIMAL RIGHTS
Not applicable.
CONSENT FOR PUBLICATION
Not applicable.
AVAILABILITY OF DATA AND MATERIALS
The data supporting the findings of the article is available in the Limpopo provincial malaria information system at http://www.doh.limpopo.gov.za/, reference number Limpopo Malaria Cases.
FUNDING
None.
CONFLICT OF INTEREST
The authors declare no conflict of interest, financial or otherwise.
ACKNOWLEDGEMENTS
We acknowledge the support of the University of Pretoria Institute for Sustainable Malaria Control (UP ISMC) and Malaria Research Control (MRC) collaborating center for malaria research, South Africa. The authors thank the Malaria Control Programme, Limpopo Department of Health for kindly providing data that was used in this paper. We are also grateful to the South African Society for Atmospheric Sciences, where major inputs, that have improved the article, were received during the research presentation during the conference in October 2019.


