All published articles of this journal are available on ScienceDirect.
Prioritizing Factors Affecting Health Service Quality using Integrated Fuzzy DEMATEL and ANP: A Case of Iran
Abstract
Background:
Quality of services is one of the important factors affecting the success of service organizations. However, due to limited resources, organizations should identify the most important dimensions of service quality and take some measures to improve them.
Objective:
To identify and prioritize the factors affecting service quality from the viewpoints of all health care stakeholders in the teaching hospitals and the headquarters affiliated to Shiraz University of Medical Sciences.
Methods:
This is an applied, cross-sectional and descriptive-analytical study conducted in the teaching hospitals and the headquarters affiliated to Shiraz University of Medical Sciences. The study population consisted of all health care stakeholders, including patients, patients' families and relatives, general population, health care policymakers and managers, and health service providers such as matrons and supervisors. Six people of each studied stakeholder group were selected as the study sample using a purposive sampling method (n=30). A pair-wise comparison matrix designed based on the SERVQUAL dimensions was used for making pair-wise comparisons and collecting the required data. The collected pair-wise comparison data were analyzed through Fuzzy DEMATEL and ANP techniques using Super Decision 2.2 and Excel 2007.
Results:
The results showed that Access (NW=0.39018) and Tangibility (NW=0.05873) had the highest and lowest priorities.
Conclusion:
According to the results of the present study and from the studied health care stakeholders' viewpoint, access to care was the most affecting and most important dimension to be improved. Therefore, in order to improve patients' access to the health care services, some suggestions can be made such as providing appropriate facilities for patients' families and relatives, offering special discounts to the poor, providing easier access to the emergency entrance, providing parking and accommodation for patients and their relatives, employing and using the appropriate number of staff, and delivering 24-hour and high-quality health care services.
1. INTRODUCTION
Paying attention to the quality of goods and services and providing better services are among vital issues to which the international community has given major priority at the present time [1]. Quality of service is one of the important factors affecting the success of service organizations. The results of many studies have shown that providing high quality services directly influences the organization's profitability, market share, and cost reduction. Moreover, it can affect customer satisfaction and behaviours such as loyalty, ensure the continuity of purchase, and change the customer into a good marketing agent [2-7]. Parasuraman et al. defined service quality as the difference between customers' expectations and perceptions of services [8].
In the past few decades, due to fundamental changes in the markets and the increases in the competitive pressures, the quality of services has become an important issue in management research and many tools have been developed to measure it. These tools are different in terms of definition, content and type of assessment. However, “SERVQUAL”, which was developed based on the gap model by the marketing team of Parasuraman, Zeithaml and Berry in 1988, has been the most widely used tool for measuring the quality of services [5]. The studied dimensions in SERVQUAL tool include:
- Tangibility: The conditions and physical space of service environment including facilities, equipment, personnel and communication channels;
- Reliability: The ability to provide services in the form of being reliable and trustworthy;
- Responsiveness: The willingness to cooperate with and assist the customer;
- Assurance: The merit and ability of employees to instil a sense of confidence into the customer;
- Empathy: The special behaviour towards each of the customers according to their characteristics so that they become convinced that the organization has understood them;
- Access: The lack of financial, geographical and cultural obstacles in the way of getting the services and also the availability of adequate employees and service providers when referring patients to the medical centres. This dimension was adopted from Mohammadi's thesis [9, 10] and added to the questionnaire used in the present study.
However, the decision about which one of these dimensions has a greater impact on the customers' perception of service quality is very complicated. Today, the complex issues of prioritization have dramatically been taken into consideration because of the shortages of resources and the need to make an effort to save money and time of reaching maximum efficiency in gaining customer satisfaction [11].
The competence of today's decision-makers is revealed in their simultaneous consideration of the multiple dimensions or criteria, which are sometimes contradictory (i.e., a decrease in one of them can result in an increase in another one), and then comparing and ranking them. Due to the complexity of the planning environment, a high volume of data and information, and many problems today's world is faced with, one-dimensional approach and judgement based on only one index are no longer appropriate and a comprehensive approach in decision-making is required. However, it should be noted that the conversion of qualitative criteria to quantitative ones has its own problems. The decision-making process, due to the lack of any appropriate standard, becomes greatly dependent on the decision-maker, and this reduces the accuracy of the decisions. To resolve this problem or minimize its side effects, multi-criteria decision-making methods have been developed [12, 13].
There are different models for multi-criteria decision making, one of which being the Analytic Network Process (ANP). ANP was developed by Thomas L. Saaty in 1996. When the dependence and relationship are mutual and one element affects the other elements in any order and direction and even has an impact on its own, the issue does not have hierarchical mode and forms a network or non-linear system. In this case, ANP should be used to calculate the weight of elements [14].
On the other hand, in a complex system, all elements are connected with each other directly or indirectly. DEMATEL technique is used for finding solutions and solving complex problems. DEMATEL was developed by the Science and Human Affairs Program of the Battelle Memorial Institute of Geneva between 1972 and 1976. This method confirms the relationships between variables and elements and helps to show their relationships by creating a directed graph. Therefore, this allows us to plan and solve the problems theatrically and visually. An important feature of this technique is its use in the field of multi-criteria decision making which structures the interactions between variables and elements. After identifying the relationships between variables and elements, the results of DEMATEL can be used in ANP in order to measure the dependence of different variables. When the DEMATEL approach is used as a part of combined decision-making models, its results can affect the final decisions [15].
In addition to the complexity discussed above, it should be noted that the world we live in is a world of ambiguity and uncertainty. Ambiguity about a variable indicates that there is not enough information about its value and status. Uncertainty about a variable also means that there is not enough certainty and confidence about all or part of the information related to that variable. Usually, the uncertainties cannot be removed from the life issues for different reasons, including the weaknesses of available technology, limited resources, and increasing costs. Therefore, some approaches and methods should be looked for in order to cope with issues which are ambiguous and uncertain. One of the appropriate methods for this purpose is the fuzzy logic [16].
Some researchers have conducted studies on determining the priorities of the factors influencing the quality of services using ANP, DEMATEL, etc. in the health care organizations.
The results of Rub Nawaz and Reza's study showed that the most affecting dimensions were the employees' patient-cantered performance and, then, detection and diagnosis mechanisms; the least effective dimensions were confidence-building mechanisms and environmental suitability [17]. Hamidi and colleagues also in their study found that the quality of information and appearance had the highest and lowest effects on the quality of electronic health services. Moreover, customers' trust and design were the most and least important sub-factors, respectively [18]. Jin and colleagues in their study concluded that the most and least important and effective criteria were, respectively, highly skilled medical staff and reliable health instructions [19].
Due to the importance of services and complexity of decision-making in this area, this study aimed to determine how much the dimensions of SERVQUAL model affect the quality of health services and also are affected by it using Fuzzy DEMATEL and then prioritize them using ANP.
The proposed approach in the present study was using the viewpoints of all health care stakeholders, including patients, patients' families and relatives, general population, health care policymakers and managers, and health service providers such as matrons and supervisors about the importance of each dimension affecting the service quality in the teaching hospitals and the headquarters affiliated to Shiraz University of Medical Sciences in order to achieve more realistic and applicable findings. This study attempted to answer the following three questions from the viewpoint of health care stakeholders: 1) What are the relationships between the dimensions of quality of services provided in the studied hospitals?, 2) What are the priorities of the dimensions of the quality of services provided in the hospitals?, and 3) What are the most important dimensions of health care quality to be focused and improved in the future plans?
2. METHODS
This is an applied, cross-sectional and descriptive-analytical study conducted in the teaching hospitals and the headquarters affiliated to Shiraz University of Medical Sciences. The study population in the present study consisted of all health care stakeholders, including patients, patients' families and relatives, the general population, health care policymakers and managers, and health service providers such as matrons and supervisors. Given that a sample of at least 15 experts in the related fields was required for using multi-criteria decision making methods [20], six subjects of each studied stakeholder group were selected as the study sample using the purposive sampling method (n=30). Then a pair-wise comparison matrix designed based on the SERVQUAL dimensions, including tangibility, reliability, responsiveness, assurance, empathy, and access, was used for making pair-wise comparisons and the presence or absence of the relationships between those dimensions and their intensity, as well as the most affecting and mostly affected dimensions were determined using the Fuzzy DEMATEL technique and the related strategy map was drawn. Finally, the studied SERVQUAL dimensions were prioritized by using the ANP model. The collected pair-wise comparison data were analyzed using Super Decision 2.2 and Excel 2007.
2.1. Analytic Network Process (ANP)
ANP considers each issue and problem as a network of criteria, sub-criteria and alternatives, all of which being called elements, which are gathered together in clusters. In a network, feedback and interaction among clusters are possible. ANP consists of 2 parts: 1) Control hierarchy, which consists of the relationships among goals, criteria and sub-criteria and influences the internal communication of the system. 2) Network relationship, which includes the dependence of various clusters. In ANP, the effects of each element on the other elements are presented by a super matrix.
Analytic network process (ANP) is carried out in four steps as follows:
Step 1. Building a model and changing the issue to a network structure: Firstly, the studied issue should be changed clearly to a rational system, like a network. The network structure can be created by some methods such as brainstorming, Delphi, nominal group, or any other suitable method. In this step, the issue is converted to a network structure in which each node is a cluster. There can be two types of relationships between the clusters and their elements, including:
1) Outer dependence in which the elements of a cluster have relationship/s with one or all elements of other clusters, which is/are shown by vector/s.
2) Inner relationship in which the elements of a cluster have interrelationships and mutual connections and are presented by vectors connected to the related cluster.
Step 2. Forming the pair-wise comparison matrix and determining the relative weight vectors: The decision elements in each of the clusters should be compared mutually based on their importance in relation to the control criteria (similar to the pair-wise comparison in AHP). The clusters are also mutually compared based on their role and influence in achieving goals. Moreover, pair-wise comparisons are made between the elements of a cluster according to their interdependencies. It should be noted that the decision-makers should make pair-wise comparisons mentioned above.
Step 3. Forming a super matrix and converting it into a limit super matrix: To achieve final weights in the network, the relative weight vectors (calculated Ws) are entered into the right columns of a matrix. As a result, a super matrix is formed, the sections of which represent the relationship between two clusters of a system.
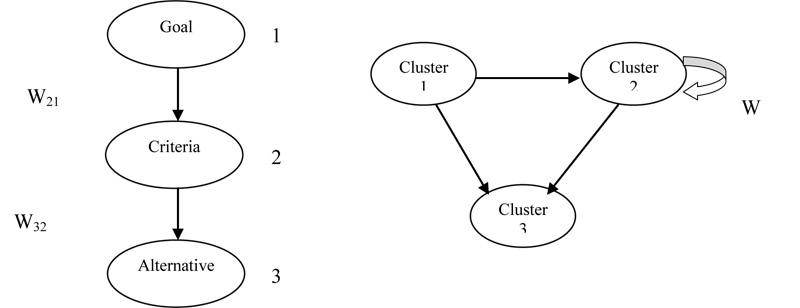
For example, in Fig. (1), a three-level structure consisting of the goal, criteria and alternatives in the forms of hierarchical and network structures has been presented.
A hierarchical super matrix is given in Table 1, which has 1, 2, and 3 levels.
| Alternatives (3) | Criteria (2) | Goal (1) | |
|---|---|---|---|
| 0 | 0 | 0 | Goal (1) |
| 0 | 0 | W21 | Criteria (2) |
| I | W32 | 0 | Alternatives (3) |
In this super matrix, W21 is a vector showing the effect of the Goal on the Criteria and W32 is a vector representing the effects of criteria on the alternatives, and I is an identity matrix. If the criteria have interactions, the hierarchical process will be changed to the network process. The criteria interactions are shown in Table 2 by entering the W22 matrix into the Wh Super matrix.
| Cluster (3) | Cluster (2) | Cluster (1) | |
|---|---|---|---|
| 0 | 0 | 0 | Cluster (1) |
| 0 | W22 | W21 | Cluster (2) |
| 0 | W32 | 0 | Cluster (3) |
This matrix is the unweighted super matrix, which is obtained by replacing the internal priorities vector (the importance coefficients or the relative weights) of the clusters and elements. Then, the unweighted super matrix should be normalized so that the sum of each column becomes equal to 1 and the weighted super matrix is achieved. Finally, the weighted super matrix should be raised to the power so that the convergence on the importance weights is achieved.
Mathematically, the following formula is used to form the limit matrix (Equation 1):
 |
(1) |
Step 4. Selecting the best alternatives:
The overall priority weights of the alternatives can be determined by the columns related to the alternatives in the normalized limit super matrix [21].
2.2. Fuzzy DEMATEL Technique
Wu and Lee used the Fuzzy DEMATEL technique for the first time. The Fuzzy technique is used to deal with the uncertainty and ambiguity of the respondents' linguistic expressions. Therefore, for performing Fuzzy DEMATEL calculations, an appropriate linguistic range should be used for data collection at first. Various ranges have been suggested based on the common DEMATEL scoring scales, among which the fuzzy range, as presented in Table 3, has gained more attention.
| Linguistic terms | Crisp Terms | Linguistic values |
|---|---|---|
| Very high influence | 4 | (0.5, 0.75, 1) |
| High influence | 3 | (0.25, 0.5, 0.75) |
| Low influence | 2 | (0, 0.25, 0.5) |
| Very low influence | 1 | (0, 0, 0.25) |
| No influence | 0 | (0, 0, 0) |
2.3. Fuzzy DEMATEL Algorithm
The Fuzzy DEMATEL algorithm is as follows:
Step 1: Calculating the initial direct-relation fuzzy matrix: After collecting the experts' views, the initial direct-relation fuzzy matrix (
 ) is formed. The simple method of fuzzy average is used for aggregation of the experts' views. If there are n experts and each array of the direct-relation fuzzy matrix is displayed by,
 then
then
 will be calculated as follows (Equation 2):
 |
(2) |
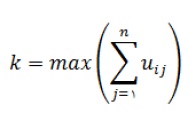
Step 2: Normalization of the direct-relation fuzzy matrix: For normalizing the values,
 should be calculated for each row. The normalized direct-relation fuzzy matrix (
 ) is acquired by dividing the arrays
 of by the maximum value of
 (Equation 3 & 4).
 |
(3) |
 |
(4) |
Step 3: Calculating the total relation matrix:
N x (I-N)-1 is used to calculate the total relation matrix. In the Fuzzy DEMATEL technique, the normalized fuzzy matrix is partitioned into the following three definite matrixes:
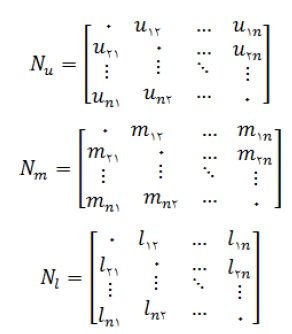 |
Then, the identity matrix (I n × n) is formed and the following operations are performed (Equation 5-7) [22]:
 |
(5) |
 |
(6) |
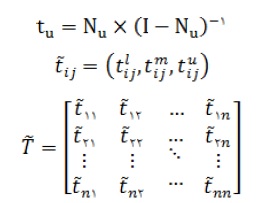 |
(7) |
After calculating the total relation matrix (
 ), the defuzzification can be done by the following equation (Equation 8) to obtain the crisp total relation matrix (T) which can be used for developing the causal relationship model and diagram:
Equation 8 [23]:
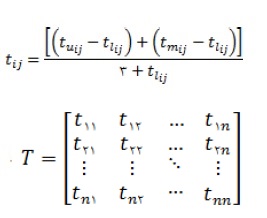 |
(8) |
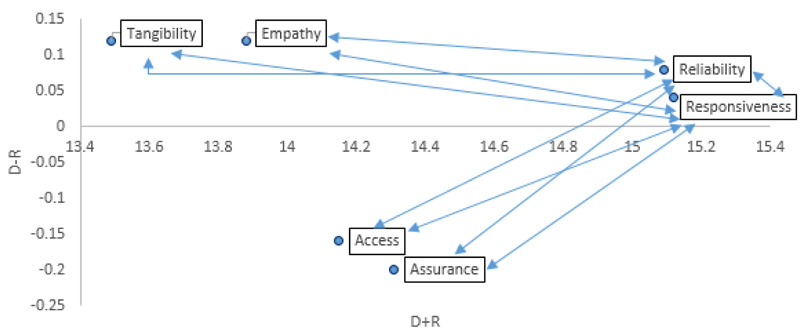
The sum of the rows and columns is separately denoted as vector Di and vector Ri. The horizontal axis vector (Di+Ri) named “Prominence” is made by adding Di to Ri, which represents how important the criterion is. Equally, the vertical axis (Di−Ri), which is named “Relation,” is made by subtracting Di from Ri, which can divide the criteria into a cause group and an effect group. Accordingly, when (Di−Ri) is positive, the criterion belongs to the cause group. Otherwise, the criterion belongs to the effect group. Therefore, the casual diagram can be acquired by mapping the dataset of the (Di+Ri, D−Ri) [22, 23].
The Convergence Index, which is an index in the DEMATEL method to show whether the experts have had sufficient accuracy in answering the questionnaire questions, is also calculated using the following formula:
 |
Where
 and
and
 represent the integration matrix of n experts' opinions and the integration matrix of n-1 experts' opinions, respectively.
If the calculated value is less than 0.05, the convergence is acceptable [24].
3. ETHICS
The present study was approved by the Ethics Committee of Shiraz University of Medical Sciences (Code: IR.SUMS.REC.1394.S1176). Informed consent was obtained from all health care stakeholders participating in the study.
4. RESULTS
In this study and in FDEMATEL steps, all the studied stakeholders' opinions about the relationship between hospital service quality dimensions were collected at first using a cause and effect questionnaire and then integrated using the arithmetic mean. The results are shown in Table 4. It should be noted that the Convergence Index in the DEMATEL method, which demonstrates the validity of the respondents' views, was equal to 0.0034 in the present study, which is smaller than 0.05, indicating the convergence between experts' opinions.
Next, the total direct relation matrix was changed to a total fuzzy direct relation matrix using equations 2 to 7 (Table 5).
Then, to determine the causal relationships between the studied dimensions and create the network structure, the total fuzzy direct relation matrix was converted into the total defuzzy direct relation matrix using equation 8 (Table 6).
After defuzzification, the threshold value of the total defuzzy direct relation matrix was calculated using the arithmetic mean of all matrix arrays, which was equal to 1.20 and the arrays of total defuzzy direct relation matrix were compared with 1.2. If the arrays were less than 1.2, they were considered as zero; otherwise, the value of those arrays was placed in the matrix. Therefore, the affecting and affected dimensions matrix was formed (Table 7).
The lack of affecting and being affected relations was shown by zero and its existence was displayed by 1 (Table 8). In other words, the results showed that the most affecting dimensions were Reliability and Responsiveness and the most affected dimensions were Tangibility, Empathy, and Access to care.
| SERVQUAL Dimensions | Tangibility | Reliability | Responsiveness | Assurance | Empathy | Access | ||||||||||||
|---|---|---|---|---|---|---|---|---|---|---|---|---|---|---|---|---|---|---|
| Tangibility | 0.00 | 0.00 | 0.05 | 0.11 | 0.16 | 0.18 | 0.11 | 0.16 | 0.19 | 0.09 | 0.14 | 0.17 | 0.06 | 0.10 | 0.14 | 0.09 | 0.13 | 0.16 |
| Reliability | 0.10 | 0.15 | 0.18 | 0.00 | 0.00 | 0.05 | 0.12 | 0.17 | 0.20 | 0.12 | 0.17 | 0.20 | 0.11 | 0.16 | 0.19 | 0.11 | 0.16 | 0.19 |
| Responsiveness | 0.11 | 0.15 | 0.18 | 0.12 | 0.17 | 0.20 | 0.00 | 0.00 | 0.05 | 0.12 | 0.17 | 0.20 | 0.12 | 0.16 | 0.19 | 0.11 | 0.16 | 0.19 |
| Assurance | 0.08 | 0.13 | 0.16 | 0.12 | 0.17 | 0.19 | 0.11 | 0.16 | 0.19 | 0.00 | 0.00 | 0.05 | 0.07 | 0.12 | 0.16 | 0.10 | 0.15 | 0.18 |
| Empathy | 0.07 | 0.12 | 0.16 | 0.10 | 0.15 | 0.18 | 0.11 | 0.16 | 0.18 | 0.09 | 0.13 | 0.18 | 0.00 | 0.00 | 0.05 | 0.10 | 0.14 | 0.18 |
| Access | 0.08 | 0.12 | 0.15 | 0.12 | 0.17 | 0.19 | 0.11 | 0.16 | 0.19 | 0.09 | 0.14 | 0.17 | 0.09 | 0.14 | 0.17 | 0.00 | 0.00 | 0.05 |
| SERVQUAL Dimensions | Tangibility | Reliability | Responsiveness | Assurance | Empathy | Access | ||||||||||||
|---|---|---|---|---|---|---|---|---|---|---|---|---|---|---|---|---|---|---|
| Tangibility | 0.07 7 |
0.32 8 |
2.53 6 |
0.19 1 |
0.51 9 |
2.92 4 |
0.19 1 |
0.51 9 |
2.94 4 |
0.17 4 |
0.49 0 |
2.83 9 |
0.13 4 |
0.43 0 |
2.69 9 |
0.16 | 0.47 | 2.79 |
| Reliability | 0.18 8 |
0.51 1 |
2.90 1 |
0.11 6 |
0.44 5 |
3.08 2 |
0.22 4 |
0.59 0 |
3.22 8 |
0.21 9 |
0.57 0 |
3.12 5 |
0.19 7 |
0.52 8 |
2.99 5 |
0.20 | 0.55 | 3.08 |
| Responsiveness | 0.18 9 |
0.51 4 |
2.89 6 |
0.22 2 |
0.58 9 |
3.20 4 |
0.11 7 |
0.44 6 |
3.09 5 |
0.21 5 |
0.56 7 |
3.12 0 |
0.20 0 |
0.53 1 |
2.98 8 |
0.20 | 0.55 | 3.08 |
| Assurance | 0.15 9 |
0.45 7 |
2.71 9 |
0.20 6 |
0.54 5 |
3.01 7 |
0.20 0 |
0.53 8 |
3.03 6 |
0.09 5 |
0.38 2 |
2.81 8 |
0.15 4 |
0.46 0 |
2.80 2 |
0.18 | 0.50 | 2.90 |
| Empathy | 0.14 5 |
0.44 1 |
2.70 6 |
0.18 6 |
0.52 2 |
3.00 4 |
0.19 8 |
0.53 2 |
3.02 2 |
0.16 8 |
0.49 2 |
2.92 0 |
0.08 1 |
0.34 4 |
2.68 9 |
0.17 | 0.49 | 2.89 |
| Access | 0.15 8 |
0.45 2 |
2.68 0 |
0.20 8 |
0.54 5 |
2.98 7 |
0.20 5 |
0.54 1 |
3.00 0 |
0.18 2 |
0.50 3 |
2.88 9 |
0.16 8 |
0.47 2 |
2.77 5 |
0.09 | 0.37 | 2.75 |
| SERVQUAL Dimensions | Tangibility | Reliability | Responsiveness | Assurance | Empathy | Access |
|---|---|---|---|---|---|---|
| Tangibility | 0.98 | 1.21 | 1.22 | 1.17 | 1.09 | 1.14 |
| Reliability | 1.20 | 1.21 | 1.35 | 1.30 | 1.24 | 1.28 |
| Responsiveness | 1.20 | 1.34 | 1.22 | 1.30 | 1.24 | 1.28 |
| Assurance | 1.11 | 1.26 | 1.26 | 1.10 | 1.14 | 1.20 |
| Empathy | 1.10 | 1.24 | 1.25 | 1.19 | 1.04 | 1.19 |
| Access | 1.10 | 1.25 | 1.25 | 1.19 | 1.14 | 1.07 |
| SERVQUAL Dimensions | Tangibility | Reliability | Responsiveness | Assurance | Empathy | Access |
|---|---|---|---|---|---|---|
| Tangibility | × | 1.21 | 1.22 | × | × | × |
| Reliability | 1.20 | 1.21 | 1.35 | 1.30 | 1.24 | 1.28 |
| Responsiveness | 1.20 | 1.34 | 1.22 | 1.30 | 1.24 | 1.28 |
| Assurance | × | 1.26 | 1.26 | × | × | 1.20 |
| Empathy | × | 1.24 | 1.25 | × | × | × |
| Access | × | 1.25 | 1.25 | × | × | × |
| W22 | C1 | C2 | C3 | C4 | C5 | C6 |
|---|---|---|---|---|---|---|
| Tangibility | 0 | 1 | 1 | 0 | 0 | 0 |
| Reliability | 1 | 1 | 1 | 1 | 1 | 1 |
| Responsiveness | 1 | 1 | 1 | 1 | 1 | 1 |
| Assurance | 0 | 1 | 1 | 0 | 0 | 1 |
| Empathy | 0 | 1 | 1 | 0 | 0 | 0 |
| Access | 0 | 1 | 1 | 0 | 0 | 0 |
To draw a causal diagram and relation network between dimensions, it was necessary to calculate and show the sum of rows and columns of the total defuzzy direct relation matrix (Table 5) as two vectors of D and R, respectively. Then, two vectors of D+R and D-R were to be computed; D+R showed the prominence indicating the dimension's degree of influencing and being influenced and D-R was called a relation. If it was positive, the studied dimension would be an affecting dimension (the result dimension), and if it was negative, the studied dimension would be an affected one (the causal dimension). The results are shown in Table 9.
| SERVQUAL Dimensions | D | R | D+R | D-R |
|---|---|---|---|---|
| Tangibility | 6.81 | 6.69 | 13.49 | 0.12 |
| Reliability | 7.59 | 7.50 | 15.09 | 0.08 |
| Responsiveness | 7.58 | 7.54 | 15.12 | 0.04 |
| Assurance | 7.06 | 7.26 | 14.31 | -0.20 |
| Empathy | 7.00 | 6.88 | 13.88 | 0.12 |
| Access | 6.99 | 7.16 | 14.15 | -0.16 |
Finally, in order to draw the causal diagram and relation network, the values of Di+Ri were shown on the horizontal axis and the values of Di-Ri on the vertical axis (Fig. 2).
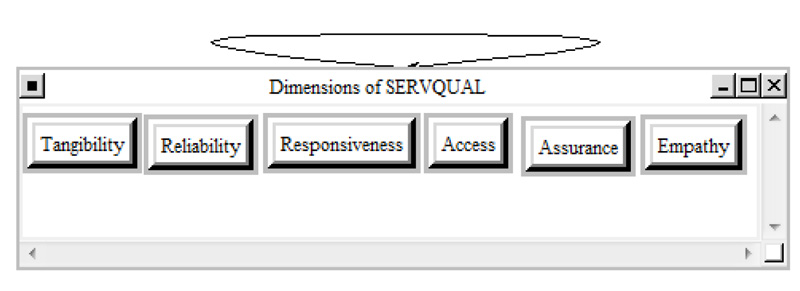
After determining the network structure of the studied dimensions influencing the hospital service quality using the FDMATEL technique, a pair-wise comparison questionnaire was used for collecting the experts' opinions in order to prioritize and determine the weight of each dimension; then, the experts' opinions were integrated using the geometric mean and used as the inputs of the ANP method. The relation network of the studied SERVQUAL dimensions is presented in (Fig. 3).
The prioritization of the studied SERVQUAL dimensions and their weights and normalized weights from the viewpoints of the health care stakeholders is shown in Table 10. The inconsistency ratio indicated the stakeholders' opinions convergence. The results showed that Access (NW=0.39018) and Tangibility (NW=0.05873) had the highest and lowest priorities, respectively.
| SERVQUAL Dimensions | Weights (W) | Normalized Weights (NW) | Priorities |
|---|---|---|---|
| Tangibility | 0.058731 | 0.05873 | 6 |
| Reliability | 0.0155453 | 0.15545 | 2 |
| Responsiveness | 0.128974 | 0.12897 | 4 |
| Assurance | 0.147676 | 0.14768 | 3 |
| Empathy | 0.118986 | 0.11899 | 5 |
| Access | 0.39018 | 0.39018 | 1 |
| Inconsistency Ratio: 0.01316 | |||
5. DISCUSSION
In the present study, the priorities and importance of the service quality dimensions of health care provided in the hospitals affiliated to Shiraz University of Medical Sciences based on the SERVQUAL model were determined using a combination of Fuzzy DEMATEL and ANP techniques. Generally, as used in this study, determining and using a sample of all health care stakeholders, including patients, patients' families and relatives, general population, health policy makers and managers, and health care providers such as matrons and supervisors can enable the researchers to analyze the research topic more comprehensively and accurately.
The results of ANP in the current study showed that Access to care was the most important dimension of health care quality from the stakeholders' viewpoint and the dimensions of Reliability, Assurance, Responsiveness, Empathy, and finally, Tangibility were the next priorities, respectively.
It seems that because of the lack of resources, prioritizing and identifying the most important dimensions and criteria in order to focus the available resources on the main priorities are necessary. In other words, by knowing that the most important dimension from the stakeholders' viewpoint in the present study has been Access to care, better results and outcome of service quality can be achieved through focusing more on it. In this regard, the managers and administrators of the studied hospitals should take some measures to provide better access to care such as providing appropriate facilities for patients' families and relatives, offering special discounts to the poor, providing easier access to the emergency entrance, providing parking and accommodation for patients and their relatives, employing and using the appropriate number of staff, and delivering 24-hour and high-quality health care services.
After Access, Reliability was the most important dimension from the health care stakeholders' viewpoint. Therefore, in order to improve Reliability, the studied hospitals' managers can take the following measures: providing timely and appropriate care for inpatients, proper and targeted training for physicians and employees and accurate medical documents and records related to the services for patients in times of need as soon as possible; establishing a logical relationship between the services offered and their costs; giving accurate information about the process and the time of providing health services to the patients; and providing quick and convenient access to the physicians and nurses for patients when necessary.
In the Assurance dimension, it can be stated that assurance indicates the competence and ability of employees in instilling a sense of confidence about the organization into the customer. This dimension is important in those services which have higher risks. Therefore, given the high sensitivity of activities and services provided for patients and the existence of high risks to the patients' lives, Assurance in the health care services is also of great importance. Some factors influencing Assurance include the employees and physicians' respectful and friendly behaviour towards patients, physicians' sufficient knowledge and expertise in diagnosis and treatment, employees and physicians' respect for human dignity, provision of complete description and prognosis of diseases and medical conditions for patients, respect for patients' privacy, etc..
In addition, the results of the Fuzzy DEMATEL technique showed that, from the stakeholders' perspective, the most affecting dimensions were Reliability and Responsiveness. Furthermore, the most affected dimensions were also Tangibility, Empathy, and Access to care. Therefore, the results of the present study showed that if hospitals focus more on Reliability and Responsiveness when prioritizing and allocating their scarce resources, this will result in drastic changes in the improvement of service quality.
Azizi and colleagues [11] in their study found that professional competence, as a sub-dimension of Reliability, was the most affecting factor on the patients' satisfaction of the health service quality from the studied patients' perspective, which is in line with the results of the present study.
The results of Gul and colleagues' study [25] showed that well-equipped personnel, as a sub-dimension of Reliability, and hygienic and comfortable environment, as a sub-dimension of Tangibility, were the most and the least affected factors, respectively, which are consistent with the results of the present study.
Jamalizadeh and colleagues in their study [26] concluded that the geographical area of the hospital, as a sub-dimension of Access to care, had the highest priority, which confirms the results of the current study. Moreover, the results of Hamidi and colleagues' study [18] showed that the service tangibility and physical appearance had the lowest impact on the service quality from the studied sample's viewpoint; this is similar to the present study results.
However, Büyüközkan and colleagues [27] in their study concluded that hospitals should focus more on Empathy in order to provide satisfactory services; their result is inconsistent with those of the current study.
CONCLUSION
According to the results of the present study, from the studied health care stakeholders' viewpoint, Access to care which refers to the ease of receiving health care or the patient's ability to get the required care at the time of need was the most affecting and most important dimension which should be improved from their viewpoint and any attention to and focus on ease of access to care can provide opportunities for achieving organizational goals and objectives of improving service quality and increasing the patients' satisfaction. Therefore, taking measures to identify the various physical, psychological, social, cultural and financial obstacles to receiving health services and attempts to remove them can be an effective step to increase the patients' satisfaction with service quality.
ETHICS APPROVAL AND CONSENT TO PARTICIPATE
The present study was approved by the Ethics Committee of Shiraz University of Medical Sciences.
HUMAN AND ANIMAL RIGHTS
No animals were used in this research. All human research procedures followed were in accordance with the ethical standards of the committee responsible for human experimentation (institutional and national), and with the Helsinki Declaration of 1975, as revised in 2013.
CONSENT FOR PUBLICATION
Informed consent was obtained from all health care stakeholders participating in the study.
AVAILABILITY OF DATA AND MATERIALS
The data from this study will be made available by the corresponding author on request.
FUNDING
This article was extracted from a research project supported financially by Shiraz University of Medical Sciences, Grant No. 94-01-68-9253.
CONFLICT OF INTEREST
The authors declare no conflict of interest, financial or otherwise.
ACKNOWLEDGEMENTS
The authors would like to thank all who cooperated with the researchers in gathering and analyzing the required data.


