All published articles of this journal are available on ScienceDirect.

Determinants of Malnutrition in Under-five Children in Angola, Malawi and Senegal
Abstract
Introduction:
Malnutrition is one of the leading causes of under-five mortality globally. With the estimated target of reducing mortality in this age group by 2030, understanding and determining the factors contributing to child mortality are critical.
Methods:
The current study used Demographic Health Survey (DHS) data from Angola (2016), Malawi (2016) and Senegal (2016). The DHS data for under-five children from these three countries were then combined in this study to create a pooled sample. This method allows for a comparison and generalization of the results across countries and has also been used in previous studies. The dependent variables (severely nourished, moderately nourished and nourished) were developed by using calculated Weight-for-age Z-scores (WAZ) from DHS data. The exploratory analysis was conducted by performing a gamma measure and chi-square test of independence to evaluate the association between malnutrition status and covariates.
Results & Discussion:
Based on the generalized linear mixed model, the type of residence, sex of the child, age of the child, mother’s level of education, birth interval, wealth index and the birth order are correlated to malnutrition in Angola, Malawi and Senegal. Children who are from rural communities, poor households, with a mother having attained primary education, are female and are between the age of 24 and 59 months are associated with malnutrition. The results of the study suggest that children from these three countries who reside with mothers who have attained only primary education are at the highest risk of being affected by malnutrition.
Conclusion:
The results show the necessity of collaboration among the three countries in order to achieve the Sustainable Development Goal (SDG) target.
1. INTRODUCTION
Malnutrition is defined as a lack of proper nutrition. This condition is observed when an individual does not receive a sufficient amount of vitamins, minerals and other nutrients [1]. Natural disasters such as earthquakes, droughts, floods, landslides, cyclones, tsunamis, hurricanes and tornados expose both children and adults to malnutrition [2]. Developing countries are highly affected by malnutrition and children are more prone to suffering from this condition than adults [3, 4].
Under-five child malnutrition is commonly measured using anthropometric indicators: 1) height-for-age (stunting); 2) weight-for-height (wasting); and 3) weight-for-age (underweight) [4-6]. Worldwide, 248 million children under five years of age are affected by malnutrition [7]. The prevalence of stunted children in this age group is estimated to be 23% globally. This form of malnutrition showed an approximate 10% decline from 2000 to 2016. Southern Africa, middle Africa, eastern Africa and western Africa have a greater
prevalence than the average global prevalence (28%, 33%, 37%, and 31%, respectively) [7]. There was an approximate 7% decline of stunting in under-five children in Africa from 2000 to 2016 [7].
The prevalence of wasting for children under five years of age is estimated to be 8% globally. Northern Africa and western Africa are the two African regions with greater local prevalence than the average global prevalence. An estimated 41 million under-five children are overweight (6% prevalence). There was a one percent climb in this form of malnutrition from 2000 to 2016. Southern and northern Africa are the two African regions with greater prevalence than the average global prevalence [7].
Malnutrition contributes to the highest percentage of under-five mortality causes [8-11]. Statistics released by UNICEF (2018) reveal that the under-five mortality rate has declined by more than half since 1990. However, sub-Saharan Africa still has the highest rate. The projections released by UNICEF (2018) indicate that under-five mortality in Africa in 2030 will be 54 deaths per 1 000 live births. One of the Sustainable Development Goal (SDG) targets is to reduce under-five mortality to 25 deaths per 1 000 live births by 2030 [12]. Based on the projections, Africa will represent more than half of the SDG target by 2030. Mayotte, Réunion, Seychelles and Egypt are the only African countries that currently have under-five mortality rates below the SDG 2030 target.
Angola is situated on the west coast of Africa with a population of approximately 25 million people where the 2016 under-five mortality was 82.5 deaths per 1 000 live births. Senegal, a country populated with 15 million, had under-five mortality of 47.1 deaths per 1 000 live births. Malawi’s under-five mortality rate was estimated to be 55.1 deaths per 1000 live births with a population of 18 million.
Angola, Malawi and Senegal are all expected to reduce their under-five mortality rate by at least half of their current rate. This requires serious interventions and targeting significant causes of under-five mortality. Hence, the aim of this paper is to assess malnutrition, identify its determinants and propose significant injections to meet the 2030 SDG target in these three countries. This study is significant in underpinning the improvement in collaboration among these three countries and recommends that their governments invest necessary resources in order to meet the SDG target. Furthermore, this strategy may be regarded as one of the many cost-effective ones in which these countries can share resources.
2. MATERIALS AND METHODS
2.1. Data Source
This study employed nationally representative data from three African countries: the Angola Demographic and Health Survey (ADHS, 2016), the Malawi Demographic and Health Survey (MDHS, 2016) and the Senegal Demographic and Health Survey (SDHS, 2016). There was no ethical approval required, since the study employed the secondary data obtained from Micro International. However, a written request was submitted to DHS Micro for approval.
2.1.1. ADHS, 2016
ADHS, 2016 was implemented jointly by the Angola National Institute of Statistics (INE), the Ministry of Health (MINSA) and the Ministry of Planning and Territory Development (MPDT). The objective of the survey, which was collected from October 2015 through March 2016, was to provide insightful information with regard to the demographic and health situation of women, men and children, which included fertility levels, marriage, sexual activity, fertility preferences, family planning methods, childhood and maternal mortality, maternal and child health, breast feeding practices, nutrition, malaria, HIV/AIDS, domestic violence and child well-being.
A sample of 16 109 households was selected, from which 14 379 women aged 15-49 years and 5 684 men aged 15-54 years participated. The response rate for women and men was 96% and 94%, respectively. The sample design was able to provide estimates at the national, provincial and place-of-residence levels.
2.1.2. MDHS, 2016
The 2015–2016 MDHS data were stratified and selected in two stages. In the first stage, 850 standard enumeration areas (SEAs), including 173 SEAs in urban areas and 677 in rural areas, were selected with the probability proportional to the SEA size and with independent selection in each sampling stratum. In the second stage, a fixed number of 30 households per urban cluster and 33 per rural cluster were selected with an equal probability systematic selection from the newly created household listing. A total sample of 27 516 households was selected, of which 26 564 were occupied and 26 361 were successfully interviewed. This yielded a response rate of 99%.
2.1.3. SDHS, 2016
The National Agency of Statistics and Demographic (ANSD) implemented SDHS, 2016 in collaboration with the Ministry of Health and Social Action (MSAS). One of the objectives of the survey was to respond to ongoing data needs for planning, monitoring and evaluating health and safety population programs.
A total sample of 4 437 households was selected and 8 865 women aged 15-49 years and 3 527 men aged 15-59 years were interviewed successfully. A total of 5, 722 under-five children were measured and weighed to determine their nutritional status, 5, 239 children aged 6-59 months were tested for anemia and 5, 237 were tested with the exam microscope for malaria parasitaemia. The sample was designed to provide results at national, provincial and place of residence levels.
2.2. Variables
2.2.1. Response Variable
As per the recommendation of the WHO, weight-for-age Z-score (WAZ) nutritional status of children was divided into three ordinal categories: Severe Malnutrition (<-3.0 WAZ), Moderate Malnutrition (-3.0 to -2.0 WAZ) and Nourished (>-2.0 WAZ) [16].
2.2.2. Explanatory Variables
The study employed the WHO’s Stunting Framework in choosing a set of socioeconomic and demographic variables related to child malnutrition, and these variables were considered as covariates in the development of the proportional odds model. The WHO’s Stunting Framework builds upon the traditional UNICEF framework, which focuses on the causes of malnutrition [8, 17]. The variables selected for this study were mother’s level of education (primary, secondary or higher), type of resident (rural or urban), household size (0-5, 6-10, 11-15 or 15), child’s age in months (<12, 12-23, 24-35, 36-47 or 48-59), sex of child (male or female), wealth index (poor, middle or not poor), birth interval in months (<24, 24-47 or >47) and birth order (2-3, 4-5 or >5).
2.3. Statistical Analysis
2.3.1. Test of association
The association between explanatory and response variables was examined by performing bivariate and multinomial analysis. Chi-square and gamma measures were employed to measure the strength of association. If the covariates were in the ordinal scale, the gamma measure was used to determine the strength of association, whereas, if the covariates were on a nominal scale, the chi-square was used to determine the strength of association. The estimator of gamma (γˆ) is given by [18]:
 |
(1) |
where C is the total number of concordant pairs
and D is the total number of discordant pairs. Chi-square has the form,
 |
(2) |
where O represents the observed frequency and E is the expected frequency under the null hypothesis. E is calculated as follows:
 |
(3) |
The association measure uses the fact that the statistic, gamˆma, follows a normal distribution with mean = γ and standard error (SE) calculated from the delta method. Chi-square uses the fact that it follows a chi-square distribution with (r-1)(c-1) degrees of freedom (df), where r is the number of categories of the covariates and c is the number of categories of the response variable.
2.3.2. Generalized Linear Mixed Model
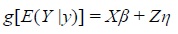
A generalized linear mixed model (GLMM) is a statistical model that extends the class of a generalized linear model by incorporating random effects that follow a distribution. A GLMM is useful in accommodating the over-dispersion often observed among outcomes that normally have binomial or Poisson distribution, and for modelling the dependence among outcome variables in longitudinal or repeated measure designs. A GLMM can be developed for non-linear distributed responses and will allow a non-linear link between the mean of the response and the predictor. Its broader application is useful in various disciplines, including analysis of clustered data with longitudinal data or repeated measures [19]. We consider the form of the GLMM:
 |
(4) |
where η is normal, distributed with mean 0,
Z is an N x q dimension model matrix for the random effect, β is the p x 1 dimension vector of fixed effect parameters, and X is an N x p dimension design matrix that includes covariates for the fixed effect.
3. RESULTS
3.1. Exploratory Data Analysis
The results of cross-tabulation for the pooled sample of children under five years of age are summarised in Table 1. The p-value of the covariates was obtained from chi-square test and gamma measure. The results from Table 1 indicate that type of residence, sex of the child, child’s age, mother’s level of education, birth interval, wealth index and birth order are significantly associated with malnutrition at a 5% level of significance. There is a high prevalence of under-five children residing in urban areas suffering from malnutrition when compared to under-five children residing in rural areas (24.4%, p-value = 0.000). Male children are more likely to suffer from malnutrition when compared to female children (17.9%, p-value = 0.000). Moreover, it is observed that a high proportion of under-five children that have malnutrition are among the age group 36–47 months (18%, p-value = 0.000). Children under five years of age with illiterate mothers are more vulnerable to malnutrition than those with literate mothers (20.5%, p-value = 0.000). Furthermore, children with short birth spacing are more exposed to malnutrition when compared to those with long birth spacing (20.2% and 22.1%, respectively).
In addition, under-five children from poor households are more likely to suffer from malnutrition, when compared to those from households considered middle and not poor according to the wealth index (37.2%, p-value = 0.000). Similarly, children of a birth order of 4-5 and greater than 5 are more likely to suffer from malnutrition, when compared to children of birth order of 2-3 (18.9% and 18.9%, respectively, p-value = 0.000).
3.2. GLMM Application
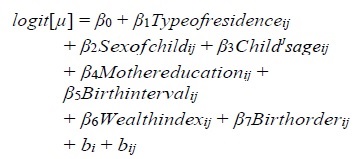
Model selection was attained, firstly, by including all the covariates and interaction terms in the model. Only the statistically significant covariates were retained for the final model. There are seven covariates included in the final model, as shown below:
 |
(5) |
where β0, β1, ..., β7 are the unknown parameter coefficients of fixed effects, bi and βij are country and cluster level random effects, respectively.
Table 2 shows the information criteria for the comparison of the two random intercept models. The results reveal that the AIC of one random intercept model is lower than that of two random intercept models (2663.7). These findings indicate that the one random intercept model is a parsimonious one.
The final model incorporated one random intercept (country), excluding cluster random effects. Table 3 presents odds ratio estimates associated with the type of residence, sex of the child, child’s age, mother’s level of education, birth interval, wealth index and birth order. The results indicate that children residing in rural areas are more likely to be affected by malnutrition (OR = 1.034, p-value = 0.820), when compared to children residing in urban areas. This finding is confirmation of the lack of service delivery in rural areas and the inaccessibility of health services for rural communities. Female children are more likely to be exposed to malnutrition (OR = 1.042, p-value= 0.705) when compared to male children.
| Covariates | Severe Malnutrition (%) | Moderate Malnutrition (%) |
Nourished (%) | γˆ(p − value) | χ2(p − value) | ||||
|---|---|---|---|---|---|---|---|---|---|
| Type of residence | – | – | – | – | – | – | |||
| Rural | 412 (7.9%) | 805 (15.4%) | 4014 | (76.7%) | 0.000 | - | |||
| Urban | 2241 (25.4%) | 1191 (13.5%) | 5398 | (61.1%) | – | – | |||
| Sex of child | – | – | – | – | – | – | |||
| Male | 1142 (17.9%) | 859 | (13.5%) | 4376 | (68.6%) | - | 0.000 | ||
| Female | 997 (14.4%) | 814 | (12.8%) | 4550 | (71.8%) | – | – | ||
| Child’s | Age | – | – | – | – | – | – | – | – |
| (months) | – | – | – | – | – | – | – | – | – |
| < 12 | 199 | (14.1%) | 144 | (10.2%) | 1014 | (75.8%) | 0.000 | - | |
| 12-23 | 278 | (15.3%) | 199 | (10.9%) | 1343 | (73.8%) | – | – | |
| 24-35 | 380 | (14.7%) | 356 | (13.8%) | 1843 | (71.5%) | – | – | |
| 36-47 | 619 | (18.0%) | 496 | (14.4%) | 2319 | (67.5%) | – | – | |
| 48-59 | 643 | (18.5%) | 478 | (13.8%) | 2349 | (67.7%) | – | – | |
| Mother’s level of education | – | – | |||||||
| – | – | – | – | – | – | ||||
| Primary | 1869 (20.5%) | 1276 (14.0%) | 5962 (65.5%) | 0.000 | - | ||||
| Secondary | 124 (5.1%) | 258 (710.6%) | 2054 (84.3%) | – | – | ||||
| Higher | 1 (0.5%) | 5 (2.6%) | 184 (96.8%) | ||||||
| Birth interval (months) | – | – | – | – | – | – | – | ||
| < 24 | 182 | (20.2%) | 144 | (16.0%) | 576 (63.9%) | 0.000 | - | ||
| 24-47 | 922 | (22.1%) | 556 | (13.3%) | 2698 (64.6%) | – | – | ||
| > 47 | 424 | (11.6%) | 435 | (11.9%) | 2798 (76.5%) | - | 0.001 | ||
| Wealth index | – | – | – | – | – | – | |||
| Poor | 2540 (37.2%) | 614 (9.0%) | 3676 | (53.8%) | 0.000 | - | |||
| Middle | 66 (2.2%) | 1161 (38.2%) | 1816 | (59.7%) | – | – | |||
| Not poor | 47 (1.1%) | 221 (5.3%) | 3920 | (93.6%) | – | – | |||
| Birth order | – | – | – | – | – | – | – | – | |
| 2-3 | 466 | (12.5%) | 479 | (12.9%) | 2773 | (74.6%) | 0.000 | - | |
| 4-5 | 451 | (18.9%) | 334 | (14.0%) | 1604 | (67.1%) | – | – | |
| >5 | 626 | (18.9%) | 389 | (11.8%) | 2295 | (69.3%) | – | – | |
Table 2.
| Model | AIC | BIC | log link | Deviance |
|---|---|---|---|---|
| One RIM | 2663.7 | 2776.1 | -1315.8 | 2631.7 |
| Two RIM | 2665.7 | 2785.2 | -1315.8 | 2631.7 |
| Covariates | Estimates | SE | OR | P-Value |
|---|---|---|---|---|
| Intercept | 0.666 | 1.509 | 0.659 | |
|
Residence Ref: Urban Rural |
0.033 | 0.145 | 1.034 | 0.820 |
|
Sex of child Ref: Male Female |
0.041 | 0.109 | 1.042 | 0.705 |
|
Child’s age (months) Ref: <12 12-23 24-35 36-47 48-59 |
-0.56 0.031 0.099 0.206 |
0.249 0.234 0.228 0.228 |
0.571 1.031 1.104 1.229 |
0.823 0.895 0.662 0.366 |
|
Mother’s level of education Ref: Primary Secondary Higher |
-0.446 -0.451 |
0.196 28.808 |
0.640 0.637 |
0.023 0.667 |
| Birth interval | ||||
| Ref: <24 months | ||||
| 24-47 | 0.085 | 0.167 | 1.089 | 0.613 |
| > 47 | 0.350 | 0.183 | 1.419 | 0.056 |
| Wealth index | ||||
| Ref: Poor | ||||
| Middle Not poor |
-0.119 -0.438 |
0.204 0.254 |
0.888 0.645 |
< 0.001 < 0.001 |
| Birth order | ||||
| Ref: 2-3 | ||||
| 4-5 | -0.081 | 0.132 | 0.922 | 0.553 |
| > 5 | -0.385 | 0.132 | 0.680 | 0.004 |
| Random effect | Variance | SD | ||
| Country | 6.6 | 2.569 |
With reference to younger children (<12 months), the likelihood for them to be affected by malnutrition is higher for children between the age of 24 and 35 months (OR = 1.031, p-value = 0.895), 36 and 47 months (OR = 1.104, p-value = 0.662) and 48 to 59 months (OR = 1.229, p-value = 0.336).
Results further reveal that children residing with mothers who have attained secondary education are 36% less likely to be affected by malnutrition when compared to children residing with mothers who have attained only primary education. Similarly, children from households with mothers who have attained higher education are 37% less likely to be affected by malnutrition, when compared to children residing with mothers who have attained only primary education. These findings indicate that improving mothers’ education levels will reduce the prevalence of malnutrition among under-five children in Angola, Malawi and Senegal.
With reference to short birth spacing (<24 months), children with long birth spacing are more likely to be affected by malnutrition. The results indicated that children of birth spacing of 24-47 months (OR = 1.089, p-value = 0.613) and >47 months (OR = 1.419, p-value = 0.056) are more likely to be affected by malnutrition, when compared to children with short birth spacing (<24 months).
Moreover, children from households with mothers who have attained at least secondary education are less likely to be affected by malnutrition. Children from households that are not poor are 36% less likely to be exposed to malnutrition, when compared to children from poor households. Children from households considered middle according to the wealth index are 22% less likely to be exposed to malnutrition, when compared to children from poor households.
In addition, it is observed that children of the birth order 4-5 (OR = 0.992, p-value = 0.553) and >5 (OR = 0.680, p-value = 0.004) are less likely to be affected by malnutrition, when compared to children of the birth order 2–3.
4. DISCUSSION
In this study, the GLMM was employed to identify the key determinants of malnutrition for children under five years of age in Angola, Malawi and Senegal. The study used 2016 ADHS, MDHS and SDHS data. The data from the three countries were then combined to create a pooled sample. A similar method was used in other studies [13-15].
Descriptive analysis was performed in SPSS and GLMM was performed in R version 3.5.2. The analysis confirmed the type of residence, sex of the child, age of the child, mother’s level of education, birth interval, wealth index and birth order as statistically significant risk factors of malnutrition in Angola, Malawi and Senegal.
The results showed that children residing in rural areas of these countries are at a higher risk of being affected by malnutrition than those residing in urban areas. Therefore, the governments of these countries need to focus on how to bring equity to rural communities to eradicate child malnutrition.
Based on demographic factors associated with malnutrition, the analysis showed that female children in Angola, Malawi and Senegal are at a higher risk of being affected by malnutrition when compared to their male counterparts. Results also reveal that an increase in children’s age is positively associated with being exposed to malnutrition. Children aged 24-35 months are at a higher risk of being affected. These findings have indicated the need for the health institutes of Angola, Malawi and Senegal to monitor the well-being of children of all ages, not only younger children, as malnutrition affects older children as well. A mother’s level of education is associated with malnutrition. The higher the mother’s level of education the more the child’s risk of being affected by malnutrition is reduced. Angola, Malawi and Senegal need to strengthen the educational system and develop strategies for channelling educational services to designated populations. The results indicated that children with mothers having attained at least secondary level education are less likely to be affected by malnutrition. These results are in agreement with [13].
The household wealth index is another determinant found to be associated with malnutrition. Improving household wealth reduces the risk of child exposure to malnutrition. This might be the result of affording access to health services and food security. This finding is similar to the results of the studies that were conducted in Burkina Faso, Bangladesh and Ethiopia [18, 20, 21]. Hence, this risk factor can be observed as likely to affect all developing countries, globally.
5. CONCLUSION
Based on the GLMM, this paper identified the determinants of malnutrition for children less than five years old in Angola, Malawi and Senegal. The results showed that type of residence, sex of the child, age of the child, mother’s level of education, birth interval, wealth index and birth order are the correlates of malnutrition in these three countries. Children from rural communities, from poor households with a mother having attained only primary education, who are female and who are between 24-59 months of age are associated with malnutrition problems. These results of the study suggest that children residing with mothers who have only attained primary education are at a higher risk of being affected by malnutrition.
The results have shown the necessity for collaboration among the three countries in order to achieve the SGD target. The African continent is a developing one with limited resources for equity in communities and for meeting their needs. Therefore, it is recommended that Angola, Malawi and Senegal work jointly to eradicate child malnutrition.
Limitations of the study include modelling common covariates. This logical explanation resulted in excluding variables that are found in the literature to be significant in defining the mortality of under-five children.
Future studies should focus on incorporating mothers’ dietary explanatory variable(s) before and after giving birth. This would ensure a better understanding of under-five malnutritional causes. It is also suggested that a similar study should be carried out including more than three countries. This would address the distribution of services aimed at reducing under-five mortality across the African continent and encourage better collaboration among African countries.
ETHICS APPROVAL AND CONSENT TO PARTICIPATE
written request was submitted to DHS: Micro Angola, Malawi and Senegal for approval.
HUMAN AND ANIMAL RIGHTS
Not applicable.
CONSENT FOR PUBLICATION
Not applicable.
AVAILABILITY OF DATA AND MATERIALS
The data supporting the findings of the article are available in the DHS program at http://dhsprogram.com.
FUNDING
None.
CONFLICT OF INTEREST
The author declares no conflict of interest, financial or otherwise.
ACKNOWLEDGEMENTS
The author would like to thank all the relevant contributors for the collection of the data from Angola, Malawi and Senegal.

