All published articles of this journal are available on ScienceDirect.

Variations in Desired Fertility Preferences among Young and Older Women in Nigeria: Evidence from Demographic Health Survey 2018
Abstract
Background:
Despite many countries of the world with fertility below replacement level, fertility rate in Nigeria remains high with contributing factors associated with high fertility preference and the desire for large families.
Objectives:
This paper explores variations in desired fertility preference among Nigerian women within the reproductive ages 15 to 49. It considers the impact of proximate factors of age, wealth, education, use of contraceptives, and other associated factors on fertility preference.
Methods:
Using Nigeria Demographic and Health Survey (NDHS 2018) data, responses of 33924 women with children of 0-60months (birth recode file) were considered. Fertility preference is measured by “ideal no of children”. Responses from the dataset were coded into two groups (desire 1-4 children and desire more than 4 children) based on the implicit Four-child Policy of National Policy on Population for Development, Unity, Progress, and Self-reliance of 1988. We use descriptive statistics, logistic regression and cox proportional regression to identify the size and associating impacts of identified explanatory variables on the two groups.
Results:
Many Nigerian women desire more than four children, with ideal family desire of more than four children higher in rural areas than in urban areas. Wealthy and educated households have lower fertility preferences. Younger women within ages 15-29 tend to desire lower fertility but use fewer contraceptives than middle-aged women 30-49. Only 12% of Nigerian women within the reproductive ages use contraceptives.
Conclusion:
Educating younger women through community-based sensitization programs would reduce the desire for large family size and prevent unintended pregnancy.
1. INTRODUCTION
Global fertility has fallen with a rise in women empowerment, increasing labor market participation, and declining child mortality [1], yet, in Sub-Sahara Africa, fertility remains at a high rate [2]. Due to the high fertility rate in sub-Sahara Africa, Africa's population is expected to be above 2 billion in 2050, with a tendency of rising to up to 4 billion in 2100 [3]. Fertility preferences remain highly unstable and higher in developing countries of the world than in the West [4, 5]. Its flexible nature across Africa tends to be distinct from that of developing countries of Latin America and Asia [6].
High value is placed on fertility in Sub-Saharan Africa, with younger women having no desire to reduce their relatively high birth rates [7]. The debate on-trend, pattern, and nature of fertility transition in Africa are on-going [6, 8-10]. This debate is associated with its poor, weak program implementation of family planning schemes [11] and the preference for large family size [6]. The fertility gap abounds in Africa [12], observed that for two to three decades, Africa's real fertility rate had surpassed the wanted or preferred fertility by at least two children. The causal factor of this gap can be attributed to low capability to achieve the desired number of childbirth, high gender disparity, and low educational attainments. Other notable literature attributes this gap to unmet contraceptive needs, which remains high in Africa [13, 14].
The weak relationship between family planning programs and fertility reduction [12] has been observed as a contributing factor to slow fertility transition in Africa. The slow fertility transition has also been linked to poor social and health services [15] and Africa's desire for large families driven by structure and pattern of family, social ties, religion, and attitude towards fertility. Fertility preferences have a strong link to socioeconomic determinants of fertility and are important measures for forecasting fertility [7]. The high desire for family size observed in sub-Saharan Africa is an obstacle to rapid fertility decline [10]. A decline in fertility desire and ideal fertility preference across households has been identified as important factors that can help reduce the fertility rate in Sub-Saharan Africa [10, 6]. The decline in preferences that accompanies development, in turn, leads to a decline in actual fertility with the adoption of birth control, induced abortion, and/or contraception [6].
Although half of the world’s country presently has a fertility rate below replacement level [16], yet the fertility rate in Nigeria remains high, with a slight drop from 5.5 to 5.4 in 2017 [17]. Earlier studies have shown that despite a slight reduction in fertility rate in Nigeria, the desired number of children remains very high [18] and the rate at which fertility preference and desires are met and achieved remains high [19]. The 2018 Demographic Health Survey report for Nigeria revealed a slight reduction in the fertility rate from 6.0 children in 1990 to 5.3 children per woman in 2018 with fertility in women in rural areas higher than those in urban areas by 1.4 children. The fertility transition in Nigeria is regarded to be very slow [20].A notable factor promoting high fertility rate is the issue of high fertility preference in Nigeria and low gap between births; NDHS 2018 reported that about 34percent of women within the age of 15-49 who are currently married in Nigeria want to have a child within two years while 30 percent anticipate on waiting for another two years to follow before having a child [21].
This paper investigates associated factors of variations in fertility preference in Nigerian women across regions with a focus on an ideal family size of more than four children and that of within 1-4 children using data from the latest Demographic and Health Surveys, 2018 (DHS). It builds upon the debate on the high fertility rate and the desired fertility preference in Nigeria with consideration of the individual factors of the region, residence place, religion, wealth, education, use of contraceptives, and other associated factors that shape fertility preferences. Information on fertility preferences can help family planning program planners assess the desire for children, the extent of mistimed and unwanted pregnancies, and the demand for contraception to space or limit births.
The remainder of this paper is arranged in this sequence. Section two describes the materials and methods of the analysis. Section 3 presents the result, while section 4 discusses findings and section 5 concludes the study.
2. MATERIALS AND METHODS
2.1. Materials
A secondary analysis of quantitative data was undertaken using nationally representative survey datasets from the Nigerian Demographic and Health Survey (NDHS). NDHS 2018 is implemented by the National Population Commission as a national sample survey that provides up-to-date information on demographic and health indicators. NDHS dataset cut across the six geopolitical zones in Nigeria, that of the 36 states and the Federal Capital Territory (FCT) and also reflect the area of residence (rural and urban). It provides a dataset on child health, maternal health, fertility levels, awareness and usage of family planning, fertility preferences, and women's reproductive health issues. This study considered the childbirth Recode file, which provides information on women within the reproductive ages 15-49 with children of 0-60 months born within the previous five-year to the survey.
2.2. Econometric Model
The dependent variable is fertility preference measured by the question “ideal no of children”, this question is classified as a form of fertility preference in Demographic Health Survey. It captures the exact number of children a woman could choose to have in her lifetime with the question “If you could go back to the time before you married and could choose exactly the number of children to have in your whole life, how many would that be?”. Responses from the dataset are diverse and for the purpose of this study, these were coded into two groups (1-4 children and more than 4 children); far from the replacement level and the two-child norms associated with developed nations. The rationale for this is based on the implicit Four-child Policy of National Policy on Population for Development, Unity, Progress, and Self-reliance of 1988. In 1988, National Policy on Population for Development, Unity, Progress, and Self-reliance was set in Nigeria towards reducing population growth rate through reduced fertility rate, within ten specific policy targeted towards “having 50% reduction in the number of women with childbirth of more than four children by 1995 with 80% achievement met by year 2000”. The shortcomings of the 1988 policy led to the formulation of the 2004 National Policy on Population for Sustainable Development. The 2004 population policy mainly set 2015 as the target point for achieving the goals contained therein but remained unachievable in Nigeria.
Explanatory variables of interest are embedded in demographic factors of age, region(6 geographical zones), place of residence(urban, rural), religion (Catholic, Other church, Islam and Traditionalist), educational attainment (higher, complete, incomplete, no education), literacy(able to read and cannot read), wealth status (Richest, richer, middle, poorer, poorest), use of contraceptives(modern method, traditional method and no method use), age at first birth(age 15-18, above 18years) and total children ever-born(0-4 children, more than 4 children). We restrict this sample to women with children of 0-60 months because they are presently caring for children and understood what childbearing means in their present situation. ii. It limits responses to currently reproducing mothers only and not to a large group of women within the reproductive ages
2.3. Methods
Our method of analysis involves the use of:
i. Descriptive statistics using counts and percentages to identify the proportion of women in each covariate. We describe statistics for the population sample of 33924 women with childbirth in the previous five-year to 2018 NDHS report in model 1and also considers the descriptive statistics of 8069 women classified as the success group with a desire of less than four children as ideal family size in model 2.
ii. Logistic regression on the nationally represented 33924 women classified into six geopolitical regions. This helps generate regions with a high desire for a large family of more than four children and their associating factors. The general model of the logistic regression equation used in the analysis is of the form:
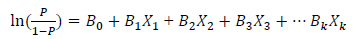 |
Where X1, X2...,Xk are set of independent explanatory variables,
B0 is a constant and B1-Bk are regression coefficients.
P is the probability of an ideal family size larger than 4 children.
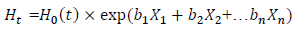
iii. our second model considers the Cox proportional regression with a focus on only the 8069 women with the desire of having not more than 4 children (0-4) as ideal family size(considered as the success group). The general model of the Cox proportional regression equation used in the analysis is of the form:
 |
By dividing both sides of the above equation by H0(t) and taking logarithms, we obtain:
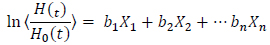 |
Where:
t is the survival time(age); H(t) is the hazard function determined by a set of covariates Where X1, X2...,Xk are set of independent variables
B0 is a constant and B1-Bk are regression coefficients which measure the size of covariates and H0 is the baseline hazard and time t indicates the hazard may vary over time.
The Cox proportional regression analysis considers the history of an event in examining the factors of risk.
3. RESULTS
3.1. Descriptive Result
This section discusses the descriptive statistics of 33924 women in Table 1.
| Model 1 (N=33,924) | Model 2 (N= 8069) | |||
|---|---|---|---|---|
| Variable | Size Percentage | Size Percentage | ||
| 15-35 | 27364 | 81% | 6706 | 83% |
| 36-49 | 6560 | 19% | 1363 | 17% |
| North Central | 5875 | 17% | 1528 | 19% |
| North East | 7211 | 21% | 566 | 7% |
| North West | 10305 | 30% | 960 | 12% |
| South East | 3798 | 11% | 1269 | 16% |
| South South | 3202 | 9% | 1480 | 18% |
| South West | 3533 | 10% | 2266 | 28% |
| Urban | 11699 | 34% | 4219 | 52% |
| Rural | 22225 | 66% | 3850 | 48% |
| Other Church | 10326 | 30% | 4390 | 54% |
| Catholic | 2913 | 9% | 1101 | 14% |
| Islam | 20412 | 60% | 2483 | 31% |
| Traditional | 116 | 0.8% | 11 | 0.1% |
| Education(Higher) | 2636 | 8% | 1468 | 18% |
| Education (Complete) | 10351 | 31% | 3770 | 47% |
| Education(Incomplete) | 5546 | 16% | 1516 | 19% |
| Education(No education) | 15391 | 45% | 1315 | 16% |
| Able to read | 13847 | 41% | 5560 | 69% |
| Cannot Read | 20066 | 59% | 2509 | 31% |
| Richest | 4778 | 14% | 2434 | 30% |
| Richer | 6166 | 18% | 2088 | 26% |
| Middle | 7171 | 21% | 1702 | 21% |
| Poorer | 7743 | 23% | 1116 | 14% |
| Poorest | 8066 | 24% | 729 | 9% |
| total child ever-born(<5) | 20472 | 60% | 6530 | 81% |
| total child ever-born(>4) | 13452 | 40% | 1539 | 19% |
| Use of contraceptives (Modern method) | 4101 | 12% | 1561 | 19% |
| No method | 28468 | 84% | 5920 | 73% |
| Traditional method | 1182 | 3% | 544 | 7% |
| husband education(higher) | 4593 | 14% | 1816 | 23% |
| Secondary | 11009 | 32% | 3630 | 45% |
| primary | 4637 | 14% | 921 | 11% |
| no education | 11551 | 34% | 941 | 12% |
| age at first birth (15-18) | 16474 | 49% | 2305 | 29% |
| (above 18) | 17450 | 51% | 5764 | 71% |
| Ideal no of children(0-4) | 8069 | 24% | ||
| Ideal no of children(>4) | 25855 | 76% | ||
Model 1 in Table 1 considered the general population sample of 33,924 women, with 81% within the age of 15-35 and 19% of 36-49 ages. 30% are from the Northwest and the least population are from the south-south(9%). 66% are in rural areas while the rest 34% live in urban areas. 60% practices Islam and about 39% are Christians(Catholic and other churches. About 84% of women are not using any contraceptive method, 12% use the modern method, and 3% use the traditional method. 8069(24%) desire not more than 4 children, while about 76% (25855) desire a family with more than 4 children.
Model 2 considered the descriptive statistics of the 8069 women who desire no more than 4 children as ideal family size. Statistics revealed that about 83% are within the age of 15-35years. 28% are from the Southwest, 19% from Northcentral, South-south with 18%, Southeast 16%, Northwest 12% and the least is 7% from the Northeast region. 52% are from urban areas, and about 71% of mothers had their first child at the age above 18 years.
3.2. Ideal Family Size and use of Modern Method of Contraceptives Across Age Group
This section presents the classification of ideal family size based on age groups as presented in Table 2.
Results revealed that more than 75% of each age group desire to have children more than four. Ideal family size increases with ages except for ages 30-34, with a slight reduction in the size of respondents desiring more than four children. A large number within age45-49 years (87%) desire more than four children; perhaps they have been born, while 76% of those within age 15-29 desire more than four children. A slight variation is found in the proportion across younger age and older adult women desiring children more than four; above 83% of those within 35-49 desire more than four children as ideal family size than 75% of younger age group.
| Age | Total No of Women within Age Group (33,924) | % That Desire Family >4 Children | % Using Modern Contraceptives |
|---|---|---|---|
| 15-19 | 1434 | 76% | 4.7% |
| 20-24 | 6626 | 76% | 8.6% |
| 25-29 | 9470 | 75% | 12.3% |
| 30-34 | 7644 | 74% | 13.6% |
| 35-39 | 5448 | 77% | 15% |
| 40-44 | 2409 | 82% | 14% |
| 45-49 | 893 | 87% | 11% |
Use of contraceptives also varies among women with children of 0-60 months, the highest being only 15% (5448 women) in the age group 35-39 years with the use of modern contraceptives to safeguard against unwanted pregnancy and create timing/spacing for the next pregnancy. In general, the use of contraceptives is low but tends to be lower among teenage mothers and younger age groups who are married and has started reproducing at early years. This descriptive analysis posits that knowledge of child spacing and timing of next pregnancy lacks among younger age group women even with the desire to have lesser family size.
Earlier studies have shown that fertility gap abounds [12, 22] revealed that about 18% women had more children than their desired number of children. The presence of a higher fertility rate than the wanted rate provides evidence of low reproductive health service delivery strength, especially on the implementation of family planning delivery programs in Nigeria. Improvement is needed in making birth control technologies available(to curb the unmet need thereby satisfying demand), accessible and affordable to their populace as well as improved contraceptive technology. High unmet need for contraception is a function of the lower total supply of family planning commodities required by all those women in need, implying a low proportion of demand satisfied by birth.NDHS 2018 reported that trend of contraceptive uses had been low over the past years in Nigeria, with a rise in unwanted pregnancies, as reported in Table 3.
3.3. Estimation Results
3.3.1. Logistic Regression Result
The regression results analysis presented in Table 4 reveals that women in the Northern region have a high magnitude association with desiring ideal family of more than four children, with women in the Northeast having more than 8times likelihood of having a larger family than those in the southwest. Result also shows that all regions have more than 2 times odd ratio which signifies that the reference region (southwest) have a lower chance of desiring larger family than all other geopolitical zones; with the highest record in the northeast and northwest. The place of residence also showcases disparity, with the urban areas having a significantly lower chance of desiring larger families than the rural areas. Religion has large explanatory power on the ideal family size with Islam and traditional religion having a high magnitude of association with large ideal family size than those of Catholic and other church with the result of women in younger age group slightly lower than older women. This result can be attributed to religious beliefs, practices, and norms that encourage polygamy and discourage the use of contraceptives, as supported by evidence from the Middle East, Africa, and Asia that religiosity is strongly associated with fertility among Muslims in the global south [23, 24].
| 1990 | 2003 | 2008 | 2013 | 2018 | |
|---|---|---|---|---|---|
| Total fertility rate | 6.0 | 5.7 | 5.7 | 5.5 | 5.3 |
| Wanted/desire fertility rate | 5.65 | 5.31 | 5.24 | 5.16 | 4.8 |
| Fertility gap(actual fertility minus wanted) | 0.35 | 0.39 | 0.46 | 0.34 | 0.5 |
| % of currently married women using contraceptive (any modern method) |
4 | 8 | 10 | 10 | 12 |
| % of women with knowledge of any modern contraceptive method | 95.8 | 92.1 | |||
| Ideal Family >4 | (Odds Ratio) | (Std. Error) | (P>|z|) |
|---|---|---|---|
| Age 15-35 | 0.93 | 0.041 | 0.128 |
| 36-49 | ref | ||
| RegionNorth central | 3.39*** | 0.174 | 0.000 |
| Northeast | 7.91*** | 0.503 | 0.000 |
| Northwest | 5.12*** | 0.306 | 0.000 |
| Southeast | 4.69*** | 0.269 | 0.000 |
| South-south | 2.43*** | 0.138 | 0.000 |
| Southwest | ref | Ref | ref |
| Place Urban | 0.80*** | 0.028 | 0.000 |
| Rural | ref | Ref | ref |
| Religion | |||
| Other church | 1.44** | 0.246834 | 0.033 |
| Catholic | 1.27 | 0.225138 | 0.170 |
| Islam | 3.13*** | 0.549995 | 0.000 |
| Traditional | 3.84*** | 1.437415 | 0.000 |
| Women Educational Attainment | |||
| Higher | 0.52*** | 0.041156 | 0.000 |
| Complete | 0.74*** | 0.042686 | 0.000 |
| Incomplete | 0.84*** | 0.049113 | 0.003 |
| No education | ref | ref | ref |
| Household Wealth Status | |||
| Richest | 0.65*** | 0.044965 | 0.000 |
| Richer | 0.77*** | 0.047423 | 0.000 |
| Middle | 0.83*** | 0.047945 | 0.002 |
| Poorer | 0.95 | 0.053137 | 0.372 |
| Poorest | ref | ref | ref |
| Fertility Rate | |||
| Total child born<5 | 0.45*** | 0.01854 | 0.000 |
| Total child born >4 | ref | ref | ref |
|
Birth Entry Age at 1st birth <19 |
1.18*** | 0.04165 | 0.000 |
| Age at 1st birth >18 | ref | ref | ref |
| Use of Contraceptives | |||
| Modern contraceptive | 0.77 | 0.168791 | 0.233 |
| No method of contraceptive | 0.93 | 0.201598 | 0.735 |
| Traditional contraceptive method | 0.74 | 0.167965 | 0.189 |
| Husband Educational Attainment | |||
| Higher | 1.34*** | 0.091145 | 0.000 |
| Secondary | 1.48*** | 0.084699 | 0.000 |
| Primary | 1.72*** | 0.113847 | 0.000 |
| None | 1.66*** | 0.116553 | 0.000 |
| _cons | 0.39 | 0.271632 | 0.176 |
On educational attainment, the result indicates that education has a significant correlation with desire on ideal family size. Women with higher education have a lower desire for a larger family size of more than four children than those with incomplete and no education. This finding supports the [25] assertion on educational attainment being not just a socio-economic factor but an important observable factor of change. Studies have shown that on the ideal family size, the effect of education is stronger than that of income [26]. Husband education has a positive association with desire for a large family; those with higher (34%) and secondary education (48%) have reduced magnitude than primary (78%). It reveals that husband education only may not be sufficient if a reduction in household desire for family size is to be obtained in Nigeria, but women's educational attainment has a high tendency of reducing the desire for family size.
Household wealth reflects the household living standard. Results revealed it has a significant association with the desire for family size. With women in the middle, richer, and the richest class having a lower odd ratio, thus women in wealthy households desire a lower family. This can be attributed to women in the rich group being more knowledgeable and with the desire to create more wealth with their time. Although the poorer group has a lower odd ratio than the poorest group (reference), this result is not significant. The total number of children ever-born by a woman is also associated with her ideal family size; women with children not more than 4 have a 55% chance of not desiring large families of more than 4. Having a first child in teenage years also influences fertility preference; results support this with an odds ratio of 1.18. Age at first birth and entry at marriage has a significant role in women's reproductive system. The result of the use of modern contraceptives also has a lower odd ratio with desiring large family thus signifying that women using contraceptive have no desire for more than four children and give no room for unwanted or unintended pregnancy,
3.3.2. Cox Proportional Regression Result
The Cox proportional regression considered the success group (8069) that desire not more than four children and the associating covariates as presented in Table 5. The result revealed that all the regions performed below the reference region (Southwest) with the least hazard ratio of success in not more than four children as ideal family size found in the Northeast (HR=0.37, p<0.001, CI 0.3-0.4), an indication that the region has only 37% chance of success in the group with 63% hazard of having more than four children as ideal family size. The risk of success is higher in South-south and the Northcentral (HR=0.74, CI 0.6-0.8 and HR=0.69, CI 0.6-0.9 p<0.001), signifying that women in these regions have a 74% and 69% chance of desiring children not more than four as ideal family size.
| Ideal Family <4 | (Hazard Ratio) | (Std. Error) | (P>|z|) |
95% C.I (lower upper boundary) |
|
|---|---|---|---|---|---|
| Region | |||||
| North central | 0.693*** | 0.024 | 0.000 | 0.647 | 0.743 |
| Northeast | 0.371*** | 0.019 | 0.000 | 0.335 | 0.411 |
| Northwest | 0.537*** | 0.026 | 0.000 | 0.489 | 0.590 |
| Southeast | 0.519*** | 0.021 | 0.000 | 0.480 | 0.561 |
| South-south | 0.747*** | 0.027 | 0.000 | 0.696 | 0.802 |
| Southwest | Ref | ||||
| Residence | |||||
| Urban | 1.08** | 0.028 | 0.004 | 1.025 | 1.136 |
| Rural | Ref | ||||
| Religion | |||||
| Other church | 0.644*** | 0.073 | 0.000 | 0.517 | 0.803 |
| Catholic | 0.751* | 0.088 | 0.015 | 0.597 | 0.945 |
| Islam | 0.505*** | 0.059 | 0.000 | 0.402 | 0.635 |
| Traditional | 0.303*** | 0.098 | 0.000 | 0.161 | 0.570 |
| Women Educational Attainment | |||||
| Higher | 1.487*** | 0.082 | 0.000 | 1.335 | 1.657 |
| Complete | 1.708*** | 0.075 | 0.000 | 1.568 | 1.862 |
| Incomplete | 1.695*** | 0.078 | 0.000 | 1.548 | 1.855 |
| No education | Ref | ||||
| Household Wealth Status | |||||
| Richest | 0.946 | 0.052 | 0.309 | 0.849 | 1.053 |
| Richer | 1.118** | 0.057 | 0.03 | 1.011 | 1.236 |
| Middle | 1.144*** | 0.056 | 0.006 | 1.039 | 1.259 |
| Poorer | 1.049 | 0.052 | 0.334 | 0.952 | 1.155 |
| Poorest | Ref | ||||
| Fertility rate and Birth entry | |||||
| Total child born<5 | 7.47*** | 0.25 | 0.000 | 7.003 | 7.983 |
| Total child born >4 | ref | ref | ref | ||
| Age at 1st birth <19 | 2.116*** | 0.061 | 0.000 | 2.000 | 2.239 |
| Age at 1st birth >18 | Ref | ||||
| Use of Contraceptives | |||||
| Modern contraceptive | 1.379** | 0.212 | 0.036 | 1.021 | 1.863 |
| No method of contraceptive | 1.284 | 0.195 | 0.10 | 0.953 | 1.729 |
| Traditional contraceptive method | 1.335** | 0.21 | 0.067 | 0.980 | 1.819 |
| Husband Educational Attainment | |||||
| Husband education(higher) | 0.801*** | 0.038 | 0.000 | 0.730 | 0.879 |
| Husband education(secondary) | 0.800*** | 0.032 | 0.000 | 0.739 | 0.866 |
| Husband education(primary) | 0.612*** | 0.03 | 0.000 | 0.556 | 0.675 |
| Husband education(none) | 0.613*** | 0.034 | 0.000 | 0.549 | 0.684 |
With the urban areas having a higher hazard ratio than the rural areas, this indicates that women living in urban centres have a high desire for not more than four children than those in the rural areas. On religion, Christians (Catholic and Other church) has the highest hazard ratio (HR=0.75, CI 0.5-0.9 and 0.64, CI 0.5-0.8 p<0.001) among all the religions, Islam has HR=0.5, CI 0.4-0.6 and traditionalist recorded HR=0.30, CI 0.1-0.5; an indication that Christians women have a higher chance of not desiring more than four children than those practicing Islam and traditional religion.
Women with higher, complete, and incomplete education have a higher hazard ratio than those with no form of education (reference point). Husband education also correlates with the desire for family size below four children with those with higher and secondary education has a high hazard ratio than those with primary and no form of education. Women in the richer and middle wealth status have a higher hazard ratio (HR=1.11, CI 1.0-1.2 and HR=1.14,CI 1.0-1.2, p<0.01), and although poorer households respond positively yet the result is not significant. On childbirth, women with not more than four children have a higher hazard ratio (HR=7.47, p<0.001, CI 7.0-7.9) than those with more than four children. Age at first birth also has a positive association with those with childbirth at age lesser than 19 having a high hazard ratio of not desiring more than four children as ideal family size.
3.3.3. The Graphical Assessment of Proportional-hazards Assumption
To confirm if our observed major covariates meet the proportional-hazard assumption; we use the Log- minus log plot assessment to visualize the proportional-hazards assumption. We consider the covariates of Religion (Islam), Education (No education), birth entry age(1st child at above 18), use of contraceptive (no method), place of residence (rural) and fertility rate (having more than four children). Fig. (1) present the result which revealed that our major covariates of religion, education, fertility rate, birth entry age, mothers’ age at birth and use of contraceptive meet the proportional-hazard function with the lines parallel to each other’s and not crossing each other for a covariate in a cohort group.
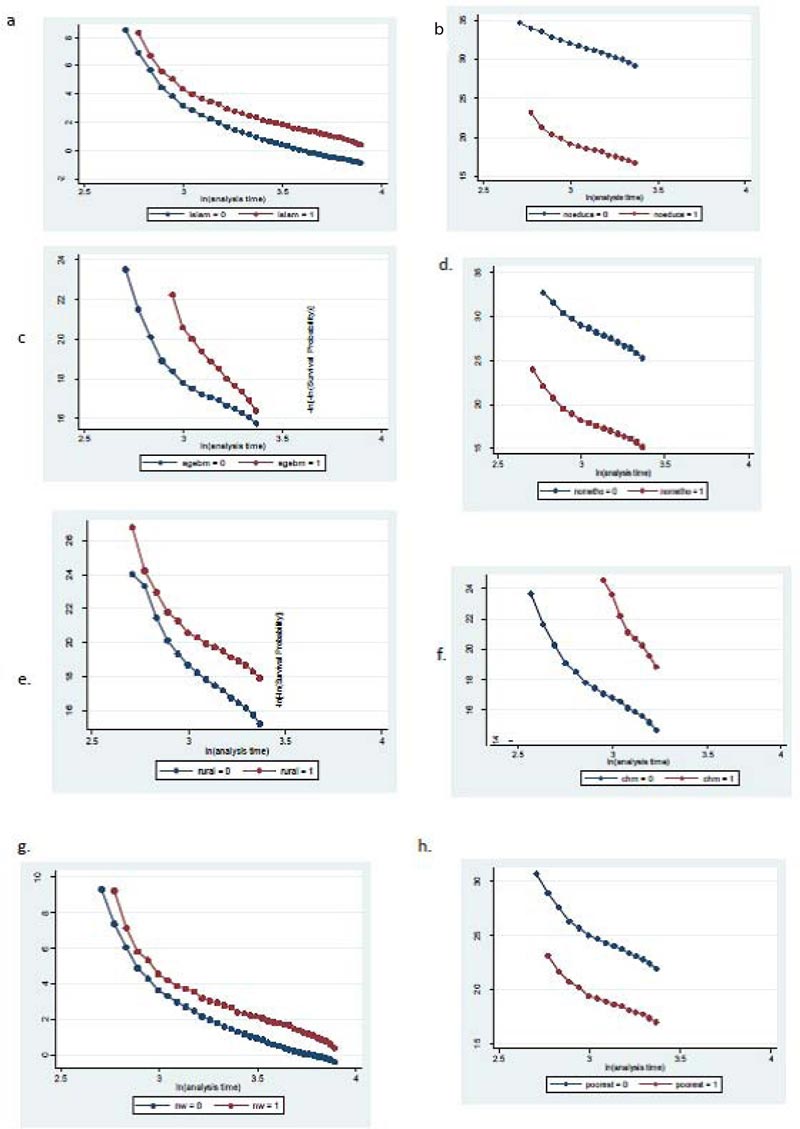
a. Religion-Islam, b. Education-No education, c. Birth entry age- 18+, d. Use of contraceptive- No method use, e Place of residence- rural, f. Fertility rate- children 4+, g. Region-Northwest, h. Wealth-poorest.
4. DISCUSSION OF FINDINGS
Although the challenges associated with childbirths are not hidden from women in Nigeria, yet fertility remains high with low use of family planning programs. The desire to have children in Nigeria's context is borne out of many factors associated with culture, norms, and social practice. Regional variations abound, with the Northeast and Northwest regions having the highest fertility rate and the lowest preference for a family size of not more than four children. A report from NDHS indicates that the Northern part has a higher fertility rate than the South, with North West having 6.6 children per woman while the Southwest takes the least with 3.9 children per woman. Across states; Katsina in the North West has the highest fertility rate of 7.3, followed by 7.2 in Bauchi and Jigawa with 7.1. In the Southern part, only Ebonyi in South East recorded a fertility rate of 5.4 children, with other states having a rate below 5.0 children per woman [21].
The huge disparity and variation between the Northern and Southern parts of Nigeria have created which reveal a huge gap in norms, beliefs, and form of living. Often household headship also contributes to high fertility preference; the man as the head of the family sometimes indicates that the wife will always accept her husband's desire. Thus, a woman with a husband wants more children and unlikely to use contraceptives [27]. The use of family planning becomes essential as it can reduce up to 29% maternal mortality [28]. Although different modern methods of contraceptives are used as family planning across the world, differences in the usage and forms shape the success result across countries [29].
Our results show several significant relationships between events in women’s lives and their ideal family size. We found evidence that a woman with higher educational attainment desires a smaller family size and those at a young age have a higher chance of not desiring children more than four than the older women. Shred of evidence support that improvement in female education and women empowerment are dominant factors that drive changes in reproductive behaviour [30, 25]. We found that women’s fertility preferences were sensitive to household economic status, with those in wealthy households desiring lesser children than the poorest. It has been acknowledged that economic status also influences fertility [31]. A large number of Nigerian women have unmet needs for family planning; younger age women were found to have low use of contraceptives than older women. Thus, there is a need to improve on family planning measures in Nigeria as indicated by [32, 33] study on Africa. We found that early entry into marriage and having a first child in teenage years is closely associated with high fertility and a desire for a larger family. Nigeria large dependent population promote deficits in the economic lifecycle [34], and to reduce the burden, the reproductive rights of women need to be enhanced; it is essential that Nigeria eliminate laws, practices, and policies that exacerbate inequalities and restrict access to essential services including sexual and reproductive health services.
CONCLUSION
With Nigeria fertility and policy on population far from the replacement policy [35], various fertility discussions should involve not only religious leaders but also the different government ministries, departments, and agencies and should be designed in such a way that every ministry sees the population program as theirs, or as compatible with their goals. There is a need for reproductive education through an increase in exposure to family planning messages by health care providers and various media channels. School curriculum should include the provision of family life education, while the family planning program needs to be evaluated and adequately monitored to capture younger women in early life. There must be deliberate government action seeking to reduce fertility by adopting and implementing policies as well as devoting actions necessary to achieve a decline in fertility.
ETHICS APPROVAL AND CONSENT TO PARTICIPATE
Not applicable.
HUMAN AND ANIMAL RIGHTS
No animals/humans were used for studies that are the basis of this research.
CONSENT FOR PUBLICATION
Not applicable.
AVAILABILITY OF DATA AND MATERIALS
The data supporting the findings of this article is available in the DHS archive at [https://dhsprogram.com/data/dataset/ Nigeria_Standard-DHS_2018.cfm?flag=0]. Permission from the DHS program is required to access the data.
FUNDING
None.
CONFLICT OF INTEREST
The authors declare no conflicts of interest, financial or otherwise.
ACKNOWLEDGEMENTS
All relevant contributors are hereby acknowledged for their review and collation of data.

