All published articles of this journal are available on ScienceDirect.

Built Environment and Its Association with Depression among Older Adults: A Systematic Review
Abstract
Background:
There is an increasing global quest to understand the influence of built environment (BE) on the mental health of people, particularly in later life. Older adults may be more susceptible to environmental factors than other adults for several reasons.
Objective:
The study aims to provide an overview and synthesis of the scientific literature on the relationships between built environment (BE) and depression among older people and examine possible rural-urban differences in the association.
Methods:
We conducted a systematic search for articles published in English from 2000-2018 in three electronic databases – PubMed, Cumulative Index to Nursing and Allied Health Literature (CINAHL), and PsycInfo. We used the Population, Exposure, Comparator, and Outcomes (PECO) framework to guide the search keywords’ development and inclusion and exclusion criteria. Studies examining associations between built environment attributes and depression were only included if they were original, peer-reviewed, reported at least one objectively measured built environment attribute, any type of depression as an outcome of interest, and the sample included people aged 50 or older.
Results:
Of 617 citations identified, 13 met our inclusion criteria. BE attributes assessed by studies varied; however, all studies reported a relationship between depression and at least one BE attribute. Four of six papers reported a protective association between green spaces and depression, while other BE attributes did not demonstrate a consistent association with depression.
Conclusion:
Adverse BE is related to depressive symptoms and should be considered in interventions targeted at preventing depression among older adults who are particularly vulnerable. Future studies focused on the relationship between the urban and rural built environment and depression among older adults are needed.
1. INTRODUCTION
Depression is a critical public health issue. It is a common but serious affective disorder characterized by persistent feelings of sadness, low energy level, poor or increased appetite, changes in sleeping pattern, hopelessness, or guilt, and it may ultimately lead to suicide [1]. In addition, depression is a leading cause of disability and illness worldwide, with an estimated 300 million people affected globally [1]. In the U.S., an estimated 8.1% of adults aged 20 years or older have depression in any given 2-week period, with women and non-Hispanic black adults more likely than other groups to report depression, 10.4% and 9.2%, respectively [2].
Depression is the most prevalent mental health condition in late life [3, 4], affecting approximately 8% to 16% of U.S. adults aged 65 years or older [3, 5, 6]. Many studies have reported that individual characteristics may influence the risk of developing depressive symptoms later in life [7-9], such as female gender, previous depressive episodes, cognitive and functional decline, stressful life events, terminal or chronic illness, lower income level, retirement, bereavement, and living alone [4, 7-9].
Depression has been associated with a number of adverse outcomes, including reduced quality of life, increased morbidity and mortality, and suicide [9-11]. Accepted treatments, including the use of antidepressants, have been shown to be less effective for late-life depression. Considering the unique set of factors that influence depression onset in later life and the difficulty in treating it using standard approaches, this age group may be at differential risk for depression development and progression [12, 13].
There is an increased global interest in understanding the influence of neighborhood characteristics on health, including mental health, and more specifically, depression [9, 10, 14-20]. Built environment (BE) can be described as the physical components of where we live and work [21], such as green spaces and parks, availability of sidewalks, and access to destinations. BE has been linked to mental health status [6-8, 14-17, 22, 23] and is believed to interact with individual-level characteristics in different ways [4, 6, 15, 20]. For example, research has demonstrated that a lack of BE resources, such as recreational parks, green spaces, sidewalks, and accessible services, may act as a stressor [4, 6, 15, 20]. Conversely, the availability of these infrastructures in a community has been shown to ameliorate personal maladaptive responses, improve social connections and a sense of community, and, thus, promote physical and mental health [6].
The influence of BE on the mental and physical health of people in later life is similarly gaining attention [4]. Older adults may be more susceptible to environmental factors than other adults for several reasons [4, 24]. Older adults may experience decreased physical mobility; combined with retired status, they may be increasingly dependent on their local communities [4]. Additionally, older adults may experience impaired cognitive and physical function, which can reduce adaptive skills and reduced social support (possibly due to loss of loved ones or children relocating out of the area), which may result in increased engagement with and reliance on their neighborhoods, especially the built attributes [4, 7].
Several review studies have focused on the relationship between neighborhood characteristics and depression. A prior review assessing the link between neighborhood characteristics (including social and BE) and depression found that only BE was consistently associated with reduced depression, even after adjusting for sociodemographic and social attributes [15]. However, BE was not consistently measured across the studies included in the review [15]. A review of 11 cross-sectional studies evaluated the relationship between urban BE and psychological distress in a general population of individuals aged 16 to 75 years [20]. The findings demonstrated a relationship between urban BE and psychological distress, which was defined as including depression, anxiety, depression, and psychological stress [20]. However, results were not broken out by age group, and so it is difficult to say whether the relationship was held among the older adult participants.
Depression in later life is a critical public health problem. Late-life depression is associated with increased risks of metabolic and cardiovascular diseases, increased rates of morbidity and mortality, and suicide [3, 9-11]. Furthermore, depression in older age is more difficult to treat because older adults may resist seeking treatment and tend to respond poorly to antidepressant medications [12, 13]. As a result, efforts to better understand the factors associated with depression onset later in life may spur interventions to prevent depression among older adults.
In 2018, the World Health Organization (WHO) launched the “WHO Global Network for Age-friendly Cities and Communities” initiative to promote healthy aging in cities around the world through the improvement of built and social environments [25]. Given that people are expected to live longer due to ongoing advances in medical knowledge and technology, the WHO projects that the number of people worldwide aged 60 years and older will double by 2050 [26]. As people live longer and the population of older adults increases, the demands on health care systems and services are expected to increase substantially [27]. The economic burden of chronic health conditions such as depression is projected to increase equivalently. A comprehensive review of the influence of urban and rural BE on depression in later years could improve the understanding of the implications of this relationship as the population continues to age.
Prior to our review, we conducted a search of the PubMed database. There have been relatively few reviews of BE and depression [20]. Much of the literature, in general, focused on urban BE. Given that rural areas by definition have less built infrastructure and prior studies have established a favorable association between growing BE resources and reduced mental health difficulties, it appears that the absence of BE resources may have an impact on rural inhabitants' mental health.This may be even more critical for older rural residents, who may have reduced mobility but may not have as many options for neighborhood engagement as urban residents. Thus, older rural residents may be at higher risk of depression due to lesser BE infrastructure and resources [28]. To our knowledge, however, no previous review of the literature on the influence of rural environments on depression in older adults has been undertaken [29].
The primary aim of this study is to build on previous work and conduct a comprehensive review of the scientific literature on the relationship between BE and depression among older adults. We hypothesize that older people living in built environments with greater infrastructure and resources will have reduced rates of depression and/or report fewer depressive symptoms than other older adults. The secondary aim of this study is to review the scientific literature on the relationship between BE in urban vs. rural settings and depression among older adults. We hypothesize that, given the reduced built and infrastructure resources inherent in rural settings, older rural residents will have higher rates of depression and/or report a greater number of depressive symptoms than their urban counterparts. However, there may not be an adequate number of studies to assess the influence of rural vs. urban BE on depressive symptoms.
2. METHODS
2.1. Study Design
We conducted a systematic search of electronic databases to collect data from published literature in English from January 2000 to September 2018. Following a consultation with a subject expert librarian, we developed a search strategy using the PECO framework [30]. Three databases included were PubMed, CINAHL, and PyscInfo. The medical subject headings (MeSH) terms and search strategy used a combination of the following: (‘elderly’ OR ‘aged’ OR ‘older adults’ OR ‘later life’ OR ‘seniors’) AND (‘built environment’ OR ‘neighborhood characteristics’ OR ‘land use mix’ OR ‘street connectivity’ OR ‘green spaces’ OR ‘retail availability’ OR ‘recreational facilities’ OR ‘neighborhood walkability’ OR ‘public transport’ OR ‘environment design’) AND (‘depression’ OR ‘major depression’ OR ‘clinical depression’ OR ‘depressive disorder’ OR ‘depressive mood’) (Appendix A). Boolean operators (AND, OR) were used to combine the search strings. In addition, we identified and included additional relevant studies in our review following a manual search of reference lists of selected studies.
2.2. Inclusion Criteria
For this review, we included studies with participants aged 50 or older, objectively measured at least one built environment attribute (urban or rural), and reported prevalence or incidence of any type of depression. Articles were excluded if: 1) the main exposure of interest was not built environment; 2) the study did not include people aged 50 or older or did not specify the age of sample; 3) the study did not report any type of depression as an outcome; 4) the article was not original and peer-reviewed. Co-authors (IS and SC) screened titles and abstracts of retrieved studies after duplicate removal, using a Microsoft Excel spreadsheet to track eligibility. Then, all potentially relevant articles were re-assessed in full, applying the predetermined inclusion/exclusion criteria. Disagreements were resolved by discussion among co-authors. Fig. (1). depicts the flowchart of the study selection.
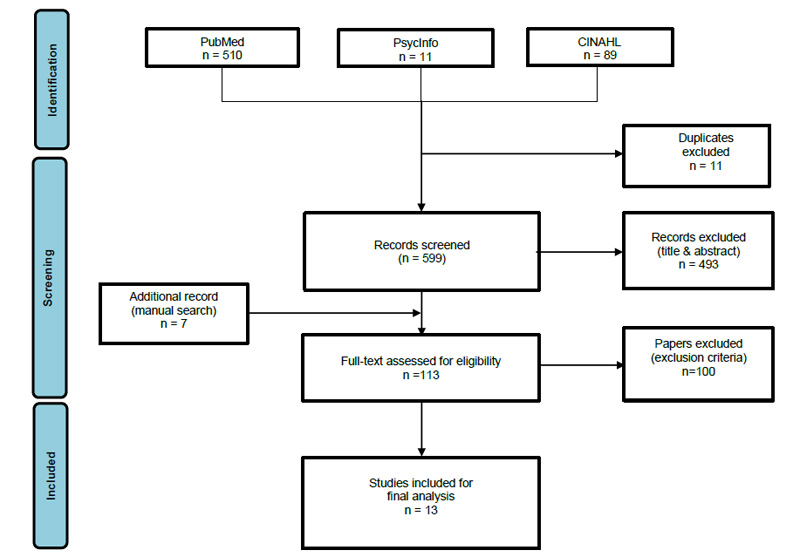
Adapted From: Moher D, Liberati A, Tetzlaff J, Altman DG, The PRISMA Group (2009). Preferred Reporting Items for Systematic Reviews and Meta-Analyses: The PRISMA Statement. PLoS Med 6(7): e1000097. doi:10.1371/journal.pmed1000097.
2.3. Data Extraction
We extracted data from eligible studies using a spreadsheet template including the following information for each selected study: Source, methods (including sample size, age, study design, location, statistical analysis), exposure (BE attribute), measurement of BE, measured outcome, covariates adjusted for, major findings, and study limitations.
3. RESULTS
3.1. Study Selection and Characteristics
Overall, 13 studies were included in the review, having fulfilled all eligibility criteria. The studies were conducted across five continents. Four studies from Europe, five from North America, two from Asia, one from Australia, and one from South America. The studies were predominantly cross-sectional, with only one being a combination of a cross-sectional and longitudinal design. Table 1 summarizes the study characteristics, including the environmental exposures, outcomes measured, and major findings.
3.2. Study population
We found a wide variation in the sample sizes and age categories of the participants. The sample size varied from 570 to 547,263 individuals. Although the age of the population varied for many of the studies, all the articles included people aged 50 and above, and six studies focused on people aged 60 and above. All the studies included both male and female subjects except one study, which focused on men only.
3.3. Measures of Depression
Majority of the papers reviewed (11/13) examined only depression as a mental health outcome, one study explored two mental health outcomes [31], and one study reviewed three outcomes [22]. Table 1 also provides a summary of the validated instruments used in measuring depression/depressive symptoms in the studies included.
3.4. Covariates
All the studies adjusted for possible confounding variables, including age, gender, educational level, employment status, marital status, household income, living arrangement, smoking status, alcohol use, body mass index, physical activity, and comorbidities. While a few articles also adjusted for perceived social support, housing type, area socioeconomic status, car ownership, family history of depression, citizenship, residential stability, and health insurance.
| Source | Methods | Exposure (BE Attribute) | Measurement of BE Attributes | Measurement of Outcome | Covariates Adjusted for | Major Findings | Limitations |
|---|---|---|---|---|---|---|---|
| Gascon et al. (2018) | Sample: 958 participants aged 45-74 (Spain; Urban) Design: Cross-sectional. Statistical analysis: Logistic regression model |
Green spaces | Surrounding greenness measured with Normalized Difference Vegetation Index (NDVI). Amount of green and access to major green and blue spaces measured with a map of land cover Catalonia | Depressive symptoms measured with self-reported doctor-diagnosed depressive disorder, history of antidepressant use recorded by trained neuropsychologist. | Gender, age, education, living alone, BMI, smoking status, sleep difficulties, and caregiver burden | Increasing surrounding greenness was associated with reduced odds of self-reported history of benzodiazepam (OR (95% CI) = 0.62 (0.43,0.89). Access to major green spaces was associated with lower self-reported depression (OR (95% CI) = 0.18, 0.06, 0.58). | Study could not analyze exposure to different types of green spaces. Use of self-reported survey. |
| Zhang et al. (2017) | Sample: 909 participants aged 65+ (Hong Kong; Urban) Design: Cross-sectional. Statistical analysis: Generalized additive mixed models (GAMMs) with binomial variance and logit link functions |
Walkability; Street connectivity; Access to destination; Availability and density of public transport | Measured with Geographic Information System (GIS) and environmental audits | Depressive symptoms – measured with Geriatric Depression Scale (GDS) | Age, sex, education, marital status, living arrangement, housing type, availability of a car in the household, and presence of chronic health problems | Higher levels of pedestrian infrastructure were associated with increased odds of depression in older adults [OR 1.025 (1.007-1.044), p 0.008]. Higher levels of street connectivity were associated with higher odds of depression [OR 1.039 (95% CI: 1.015-1.065), p = 0.002]. |
Cross-sectional design, possible selection bias due to lower response rates among neighborhoods with low walkability |
| James et al. (2017) | Sample: 73,225 participants aged 40-79 (USA; Urban) Design: Cross-sectional. Statistical analysis: Logistic regression analysis |
Walkability; Street connectivity; Access to destination | Measured with geocoded street information (ArcGIS) version 10.1 StreetMap USA Data. | Depression – measured with the Center for Epidemiologic Scale for Depression (CES-D) and Survey questions for clinically diagnosed depression and antidepressant use | Age, sex, race, household income, marital status, smoking, employment status, and deprivation index (neighborhood SES) | Highest quintile of walkability index was associated with higher odds of depressive symptoms only in the most deprived neighborhoods [OR 2.13 (95% CI: 1.13-4.01), p<0.05] compared with those with the least quintile of walkability. Greater walkability index was associated with lower odds of depressive symptoms in the least deprived neighborhoods [OR 0.77 (95% CI: 0.60-0.99), p<0.05]. No significant association was found between street connectivity and depression | Cross-sectional design, use of self-reported measures |
| Gariepy et al. (2015) | Sample: 7,114 participants aged 18-80 (Canada; N/A) Design: Cross-sectional. Statistical analysis: Latent class growth modelling using a logistic model |
Green spaces; Access to destination | Presence of parks measured with Geospatial Canadian Data. | Major depression -Measured with the Composite International Diagnostic Interview Short-Form for Major depression (CIDI-SFMD). Episodes of major depression assessed with Diagnostic and Statistical Manual of Mental Disorders (DSM-IV) | Age, sex, marital status, education, household income, family history of depression, comorbidity, and childhood life events. | Availability of local parks was linked to lower odds of low and moderate depressive episodes. Coefficients: -3.1 (-3.9,-2.2) 95% CI and -0.3(-0.6,-0.01) 95% CI, respectively. Availability of services was associated with positive mental health among participants with a low trajectory for depression but had no effect on moderate and high prevalence depression. |
Trajectory groups identified may not be fixed/permanent. |
| Melis et al. (2015) | Sample: 547,263 participants aged 20-64 (Italy; Urban) Design: Cross-sectional. Statistical analysis: Poisson multilevel regression models |
Land use mix; Green space; Access to destination; Public transport | Land use mixed was calculated using the Shannon diversity index (1948). | Depression is defined as at least a single antidepressant prescription through the National Health System (NHS) between 2004 to 2006. | Education, employment status, citizenship, residential stability | No statistically significant association was found between depression and green area or land use mix. Slight protective association between availability of public transport and mental health in men 50 years and older [IRR 0.93 (95% CI: 0.87-0.98)], while there was no statistically significant protective association in women of all age groups |
Use of only NHS prescribed antidepressants might have underestimated depression diagnosis |
| Hernandez et al. (2015) | Sample: 570 participants aged 60+ (USA; Urban) Design: Cross-sectional and longitudinal Statistical analysis: Multivariate logistic regression models. |
Walkability; Traffic safety; and Aesthetics | Measured with the shortened version of the Neighborhood Environment Walkability Scale (NEWS) | Depression - GDS | Age, sex, education, income, marital status, linguistic acculturation. | Cross-sectional Study: Greater neighborhood walkability indicated by lower perceived neighborhood crime was associated with a lower odds of elevated depressive symptoms [OR 0.90 (95% CI: 0.82-0.996) p=0.04]. Longitudinal study: No statistically association between neighborhood characteristics and depression. |
Use of self-reported surveys, small sample size (due to attrition in longitudinal study) |
| Blay et al. (2015) | Sample: 6,963 participants aged 60+ (Brazil; Rural) Design: Cross-sectional. Statistical analysis: Multivariate linear models |
Sewage, electricity; Street illumination; Garbage disposal; Shower and toilet; Tap water access; Housing; Sleeping arrangement | 8-item self-reported indicator. Presence or absence of variable scored 0 and 1, respectively | Depression - measured with the Brazilian version of the Short Psychiatric Evaluation Schedule | Sex, age, education, income, smoking, physical activity, and alcohol use. | Study found significant association between high BEI and depression [OR 1.35 (95% CI:1.08-1.69, P = 0.01] | Cross-sectional study design, sample excluded homeless people, and possible social desirability bias |
| Putrik et al. (2015) | Sample: 9,879 participants aged 18+ (Netherlands; N/A) Design: Cross-sectional. Statistical analysis: Multilevel logistic regression models |
Walkability, green spaces, access to destination, public transport, parking facilities, railway noise nuisance, littering | Physical and social environments were measured using self-rated but validated surveys. | Depression– measured with Kessler Physiological Distress Scale | Age, gender, education, and income. | No significant association was found between green space and depression among the study sample. No association was observed between pedestrian facility and depression |
Study design, use of self-reported surveys. |
| Reklaitiene et al. (2015) | Sample: 6,944 participants aged 45-72 (Lithuania; Urban) Design: Cross-sectional. Statistical analysis: Multiple logistic regression analysis |
Green space/structured city parks | Green space exposure was assessed from the spatial land covering datasets using the ArcGIS 10 software. Use of green spaces was measured with a self-reported questionnaire. | Depressive symptoms - measured with the CES-D 10 scale. | Age, education, marital status, tobacco use, alcohol use, body mass index. | Women who used green spaces ≥4h/week with a distance of >300 m away from their homes, had higher odds of depressive symptoms and poor perceived health. No association was found between men's health and green spaces. | Study design, small-scale green areas, e.g., privately owned natural green space and roadside greens, could not be assessed |
| Beyer et al. (2014) | Sample: 2,479 participants aged 21-74 (USA; Urban-Rural) Design: Cross-sectional. Statistical analysis: Multivariate linear regression models |
Green spaces | NDVI and Survey of the Health of Wisconsin (SHOW) database. Control for urbanicity was measured with Rural and Urban Community Area (RUCA) codes. Tree canopy measured using 2001. Percent Tree Canopy data from the National Land Cover Database | Depression - measured with three scales of the 42-item Depression Anxiety Stress Scales (DASS) | Individual-level factors - Age, sex, race, ethnicity, education, income, marital status, and health insurance. Neighborhood-level factors -urban rural, population density, education, instability, unemployment, poverty, housing tenure, percent African American, median household income | Neighborhood greenness had a significant protective association on depression after controlling for individual level factors. 25% more greenspace (Coefficient -1.379 (0.397) p< 0.01). Higher percentage of tree canopy was associated with positive mental health from age 55 (Coefficients -1.005 (0.29) p<0.01), | Use of self-reported survey, possible selection bias due to non-response, potential for temporal deviation from variation in measurement intervals of exposure and health outcome |
| Li et al. (2015) | Sample: 3,824 participants aged 60+ (China; Rural) Design: Cross-sectional. Statistical analysis: Multilevel logistic regression models |
Sewage and garbage disposal; Shower and toilet; Tap water; and roads (paved or unpaved); Elder activity center | Measured using infrastructure deficiencies index | Depression – measured with CES-D 10 | Age, gender, marital status, and living arrangements, education, health insurance, financial support, comorbidities. | Residence in villages with no health care facility was associated with greater odds of depression [OR 1.246 (95% CI: 0.993-1.564), p = 0.057]. Living in villages with no elder activity center had increased odds of depression though not statistically significant [OR 1.188 (95% CI: 0.911-1.549), p < 0.10]. | Cross-sectional study design, mechanisms of association between exposure and outcome were not assessed |
| Saarloos et al. (2011) | Sample: 5,218 participants aged 65-79 (Australia; Urban) Design: Cross-sectional. Statistical analysis: Multivariate logistic regression |
Land use mix; Street connectivity; and Residential density | Measured with GIS | Depression – measured with GDS | Age, education, living arrangement, housing type, family and friends (APGAR), sense of community, comorbidity, smoking | Higher odds of depression were independently associated with higher neighborhood functional (land use) mix [OR 1.37 (95% CI: 1.02 -1.84]. No significant association was found between street connectivity and depression. Availability of retail was associated with higher odds of depression among older men [OR 1.40 (95% CI: 1.04-1.90), p <0.05)]. |
Non-structured clinical assessment of depression, lack of access to specific data on exposure, the study focused only on men |
| Berke et al. (2007) | Sample: 740 participants aged 65+ (USA; N/A) Design: Cross-sectional. Statistical analysis: Multiple logistic regression |
Walkability | Neighborhood walkability scores from the Walkable and Bikeable Community project | Depression – measured with CES-D | Income, education, smoking, age, ethnicity, living alone, comorbidity, self-reported walking activity, | More walkable neighborhoods were associated with reduced odds of depression in men [OR = 0.31-0.33), p = 0.02]. No statistically significant association in women. | Observational study design, inability to determine the mechanism of association between exposure and outcome |
3.5. Built Environment Attributes
3.5.1. Green Spaces
Six articles measured the association between green spaces and depression [22, 23, 31-34]. Four of these studies showed a statistically significant protective association between green spaces and depression [22, 23, 31, 32]. Beyer et al. [22], in a cross-sectional study in the U.S. measured greenness using the normalized difference vegetation index (NDVI). The authors reported that neighborhood greenness was associated with statistically significant protection on depression [coefficient = -1.379 (0.397), p < 0.01] after adjusting for potentially confounding variables. Also, Gascon and colleagues [31], in another cross-sectional study in Barcelona, Spain, assessed the green space exposure with NDVI instrument and measured depression with self-reported clinically-diagnosed depression and antidepressant use. Greater amount of green space was associated with lower odds of self-reported depression [OR = 0.18 (95% CI: 0.06 - 0.58)] and antidepressant use [OR = 0.62 (95% CI: 0.43 - 0.89)].
Additionally, a Canadian study [23] assessed green space by the presence of parks and determined depression with the Composite International Diagnostic Interview Short-Form for Major Depression (CIDI-SFMD) and examined three trajectories of depressive symptoms – low, moderate, and high prevalence with the Diagnostic and Statistical Manual of Mental Disorders (DSM-IV). The authors reported that the availability of local parks was protective against low and moderate prevalence depression; however, no statistically significant association with high prevalence depression.
A Lithuanian study [32] examined the association between green space, depressive symptoms, and perceived general health. The availability of green space was measured with a geographic information system (GIS) and its use with the self-rated survey, while depression was assessed with the Center for Epidemiologic Studies Depression (CES-D) scale [32]. The results indicated that women who used green spaces more often but with longer travel distances reported more depressive symptoms [OR = 1.92 (95% CI: 1.11-3.3)] when compared to women who used green spaces less often with similar accessibility. However, no association was found between men’s mental health and green space [32]. On the contrary, Melis and colleagues in a Northern Italian study [33] and Putrik et al. [34] in another study located in the Netherlands found no statistically significant association between green space and mental health.
3.5.2. Neighborhood Walkability
Five studies assessed neighborhood walkability [3, 27, 34-36]. The definition of walkability varied among the studies, and this made the comparison more difficult. Berke and colleagues [3] assessed walkability scores using a walkability model which promoted walking, such as proximity to amenities, residential density, and block size. The authors reported that more walkable neighborhood was associated with reduced odds of depression only among men [OR = 0.31-0.33), p = 0.02]; however, there was no statistically significant association among women [3].
James et al. [35] in another U.S. study defined walkability index based on GIS scores of population density, intersection count, and counts of businesses in a neighborhood. Although residents of least deprived areas had a protective association between higher walkability and depression (OR 0.77 (95% CI: 0.60-0.99), p<0.05); their results suggested that greater walkability was associated with higher odds of depression in the most economically deprived areas (OR 2.13 (95% CI: 1.13-4.01), p<0.05) compared to those with lesser walkability [35]. The authors explained that this might be due to increased exposure to noise pollution and social stressors in deprived neighborhoods.
Hernandez and colleagues [36] assessed walkability with the Neighborhood Environment Walkability Scale and depression measured at baseline, 12-month, and 24-month with the Geriatric Depression Scale (GDS). The authors reported that greater neighborhood walkability perceived as higher neighborhood safety was associated with reduced odds of depressive symptoms in the cross-sectional study (OR 0.90 (95% CI: 0.82-0.996) p=0.04), while no association was found in the longitudinal study. In addition, Zhang et al. [27], in a study in Hong Kong [27], measured pedestrian infrastructure, including the quality of sidewalks, bicycle lanes, and roads. The authors observed increased odds of depression in older adults living in areas with a higher proportion of pedestrian infrastructure (OR 1.025 (1.007-1.044), p 0.008). However, a study conducted in the Netherlands did not find any association between pedestrian facility and depression [34].
3.5.3. Land use Mix
Only two studies measured the association between land-use mix and depression [6, 33]. Saarloos et al. [6], in an Australian study among men, reported that increased odds of depression were independently associated with higher neighborhood functional (land use) mix (OR 1.37 (95% CI: 1.02 -1.84), and recommended careful planning of retail facilities in residential neighborhoods, especially near communities for older people. On the contrary, Melis and colleagues [33] did not observe any association between depressive symptoms and land use mix.
3.5.4. Street Connectivity
Three studies measured street connectivity [6, 27, 35]. One study [27] reported that higher levels of street connectivity were linked to higher odds of depression (OR 1.039 (95% CI: 1.015-1.065), p = 0.002) [27], while the other studies did not find any statistically significant association between street connectivity and depression [6, 35].
3.5.5. Access to Destination/Services
Six studies examined the association between mental health and access to destination or presence of public amenities/services such as retail stores, cultural services, libraries, cinema [6, 23, 27, 33-35]. Among all the studies, only one reported a link between the availability of services (e.g., health centers, healthy food stores) and positive mental health among participants with a low trajectory for depression; however, there was no effect on moderate and high prevalence depression [23]. Whereas, Saarloos et al. [6] observed a negative association between the availability of retail and odds of depression among older men [OR 1.40 (95% CI: 1.04-1.90), p <0.05)]. The remaining studies did not find any associations [27, 33-35].
3.5.6. Public Transport
Three studies evaluated the association between public transport and mental health [27, 33, 34]. The findings of the study conducted by Melis et al. [33] found a slight protective association between availability of public transport and mental health in men 50 years and older [IRR 0.93 (95% CI: 0.87-0.98)], while there was no statistically significant protective association in women of all age groups [33]. While the other two studies [27, 34] found no significant association between density of public transport or availability of public transport and odds of depressive symptoms [27, 34].
3.5.7. Measurement of Rural Built Environment
Blay and colleagues [37] analyzed the association between BE and health outcomes in the Rio Grande do Sul, Brazil. After adjusting for confounding variables, the authors reported that deficient infrastructure was associated with higher odds of self-reported depression [OR 1.35 (95% CI: 1.08-1.69), p = 0.01]. In addition, a study in rural China examined the association between late-life depression and the availability of community services and infrastructure. Being resident in villages with no healthcare facility was also associated with greater odds of depression (OR = 1.246 95% CI = .993, 1.564, p = 0.057). Similarly, infrastructure deficiency was associated with higher odds of depression [OR 1.040 (95% CI: 1.018-1.063), p <0.001].
4. DISCUSSION
To our knowledge, this is the first comprehensive review to examine whether person-centered and objectively measured community physical infrastructure are associated with depression among older adults. All the studies included in this review reported an association between depression and at least one BE characteristic. We found disparities in the urban and rural BE exposures but similar effects of the adverse built environment on depressive symptoms in older adults, for instance, lack of green spaces [22, 23, 31], higher density of public transport [34], and deficient rural built infrastructure [28, 37], were all linked to poor mental health. Our review adds to the literature that an adverse physical environment may impact mental health negatively, especially among older adults.
Comparing our review to other studies, we observed that nearly half of the studies in this review reported that the prevalence of depression was higher among women than the men [3, 23, 27, 28, 31-33]. This finding lends support to previous studies, which suggested that women are more likely to report depressive symptoms than men [38, 39]. In addition, we also found that objectively measured (using NDVI and GIS instruments) availability and amount of green spaces within accessible distance to the users was consistently associated with positive mental health [22, 23, 31, 32]. Again, this concurs with previous studies, demonstrating the benefits of greenness on depression [40-43]. Studies have suggested that parks and greenery may reduce the risk for depression by improving mood, mitigating stress [44, 45], promoting social interaction [46, 47], and physical activity [48-50].
Apart from the green spaces, all the other BE attributes, including land use mix, walkability, public transport, and access to services/destinations, had inconsistent effects on depression among older adults. For example, previous studies have examined the association between neighborhood walkability and physical activity, and the results have suggested that more walkable neighborhoods promote active living and general health [3, 19]. However, the findings of this review indicate that neighborhood walkability and access to services or destination could impact the mental health of older adults positively or negatively. The evidence from this review suggests that the influence of the physical environment on mental health is far more complex and may be subject to multiple mechanisms of effect.
Prior studies suggested a dose-related response to neighborhood environment [33, 51]. Older adults may be more sensitive and reactive to the quality of their community offerings due to their increased reliance on their immediate environment because of reduced physical functions, mobility, and relative adaptive responses. They tend to spend longer time, compared to young adults, within their communities. In addition, previous studies have suggested that walkable neighborhoods promote walking and physical activity and general health [3, 19]. Nonetheless, we found an inconsistent association between walkable neighborhoods and depression among older adults. Despite living in a walkable neighborhood, high traffic density, crime, litter, poor quality pedestrian infrastructure may serve as psychological stressors and produce detrimental mental health effects [35]. Likewise, accessibility/availability of stores and public transport may not produce the desired positive health outcome if they are too many and concentrated in a location for similar reasons mentioned above. Despite cultural differences and the heterogeneity of the locations of the studies, we observed that all the studies showed an association between built infrastructure and depression after controlling for individual confounding factors.
We acknowledge that our review has strengths and limitations. We focused on geographically diverse studies investigating the associations between built environment attributes and depression. The majority of the studies had large sample sizes with sufficient statistical power to examine associations and used comparable and objective instruments in evaluating exposures and outcomes variables. However, the prevalent studies were cross-sectional, and we could not ascertain causality or temporality. As a result, the associations reported may be prone to reverse causation [22]. Additionally, scanty studies focused on rural BE, making it challenging to examine rural-urban differences. Finally, although all the studies selected for this review included people aged 50 or older and controlled for individual variables including age, only 8/13 studies focused entirely on older adults. Future research focusing on older adults and investigating longitudinal interactions between BE and depression in urban and rural communities are needed.
CONCLUSION
In conclusion, this review shows an association between built environment and depression among older adults, and our findings shed more light on the complexity of this relationship. We recognize the challenges of creating an entirely healthy environment. However, we recommend that health policymakers develop interventions to promote healthy aging by strategically developing carefully-planned neighborhoods and modifying existing communities. Neighborhood designs should offer quality and accessible infrastructures, including green spaces, pedestrian infrastructure, community services, and improved community safety.
LIST OF ABBREVIATIONS
| BE | = Built Environment |
| WHO | = World Health Organization |
| NDVI | = Normalized Difference Vegetation Index |
| OR | = Odds Ratio |
| CIDI-SFMD | = Composite International Diagnostic Interview Short-Form for Major Depression |
| DSM-IV | = Diagnostic and Statistical Manual of Mental Disorders |
| GIS | = Geographic Information System |
| CES-D | = Center for Epidemiologic Studies Depression |
| GDS | = Geriatric Depression Scale |
CONSENT FOR PUBLICATION
Not applicable.
FUNDING
None.
CONFLICT OF INTEREST
The authors declare no conflicts of interest, financial or otherwise.
ACKNOWLEDGEMENTS
Declared none.
SUPPLEMENTARY MATERIAL
PRISMA checklist is available as supplementary material on the publisher’s website along with the published article.
| Peco Elements | Keywords | Search Terms | Search Strategies |
|---|---|---|---|
| P (Population) | People aged 50 or older | Older adults | Elderly OR Aged OR Older adults OR Later life OR Seniors |
| E (EXPOSURE) | Built environment attributes | Built environment | Built environment OR Neighborhood characteristics OR Land use mix OR Street connectivity OR Green spaces OR Retail availability OR Recreational facilities OR Neighborhood walkability OR Public Transport OR Environmental design |
| C (Comparator) | People younger than 50 years | ||
| O (Outcome) | Any type of depressive illness | Depression | Depression OR Major depression OR Clinical depression OR Depressive disorder OR Depressive mood |

