All published articles of this journal are available on ScienceDirect.

Assessing the Role of Socioeconomic Factors and Place of Residence on the Burden of Stillbirth in India: A Comprehensive Review
Abstract
Background:
Due to India's highest contribution to the global burden of stillbirth, identifying and preventing modifiable risk factors of stillbirth is crucial. There is a serious need to assess the overall impact of socioeconomic inequalities on the stillbirth rate in different Indian settings.
Objectives:
The present study aims to assess the impact of different socioeconomic factors and the place of residence on the risk of stillbirth across different regions in India.
Methods:
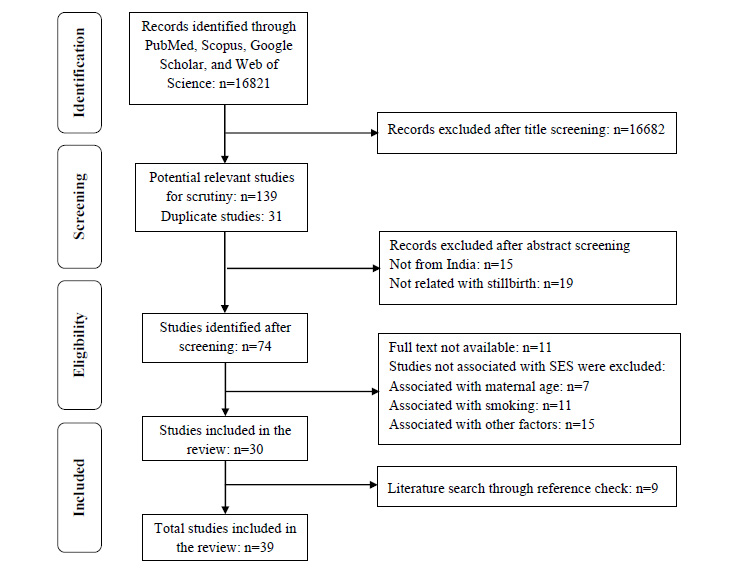
For the literature search, PubMed, Web of Science, Scopus, and Google Scholar databases were used, which yielded 16821 research articles initially. According to the inclusion/exclusion criteria, a total of twenty potential studies were considered in the analysis.
Results:
Enlisted studies represented an association of education (n=16/20), income (n=4/20), occupation (n=8/20), the standard of living index/SES score (n=7/20), and place of residence (n=8/20) with the risk of stillbirth. The increase in wealth and educational status of women leads to a gradual decrease in the stillbirth rate. Stillbirth was more common in working women and in women whose spouse was a laborer or peasant. Rural residence and low socioeconomic score were identified as the strongest predictors of the risk of stillbirth.
Conclusion:
By evaluating the impact of socioeconomic factors, specific modifiable risk factors can be ascertained during the first trimester of pregnancy and the prevalence of stillbirth can be reduced. This evaluation may be used to identify the primary risk factors for stillbirth and to create policies to accomplish the objectives of the Indian Newborn Action Plan.
1. INTRODUCTION
The identification and prevention of risk factors of stillbirth is a major public health concern that has emerged as a global challenge [1]. Several medical and non-medical risk factors of stillbirth have been examined and documented by previous research [2]. The sociodemographic factors were identified as one of the important modifiable non-medical risk factors of stillbirth in high-income countries; furthermore, the risk of stillbirth was elevated among the socioeconomically deprived population [3, 4]. According to a systematic review, the stillbirth rate was 5 per 1000 births in high-income countries [5] and 32 per 1000 births in low- and middle-income countries of South Asia and Sub-Saharan Africa [6]. In low- and middle-income countries, the prevalence of stillbirth is substantially higher; in addition, the strength of association of stillbirth risk with socioeconomic status (SES) is significantly high [7-12].
The rate of reduction of stillbirth has remained slow globally in recent times [1, 5], and the reduction rate noticeably varies from country to country [13]. According to UNICEF, India's stillbirth rate has been steadily declining from 2005-06 (29.64 per 1000 live births) to 2019-20 (13.93 per 1000 live births), despite India's continued contribution to the global burden of stillbirths [14]. The rate of stillbirth in many Indian states such as Uttar Pradesh (1.48%), Assam (1.28%), Bihar (1.13%), Odisha (1.09%), Jharkhand (1.06%) [15], Chandigarh (1.4%), Lakshadweep (1.4%), Jharkhand (1%), and Chhattisgarh (1%) was equal or more than 10 per 1000 births [16]. As a result, the Indian Newborn Action Plan (2014) aims to reduce newborn mortality and prevent stillbirths in India to a single digit (>10 per 1000 live births) by 2030 [17].
The gap in understanding the definition of stillbirth also remains a barrier to the accurate assessment of stillbirth risk factors; consequently, identifying some of the essential socioeconomic determinants of stillbirth can also be omitted. World Health Organization (WHO) defines stillbirth as a baby born with no signs of life at 28 weeks of gestation or more, with a birth weight of ≥1000g or a body length of ≥35cm [18, 19]. Based on the timing of stillbirth, it can be classified as 'intrapartum stillbirth' (after the onset of labor but before birth) and 'antepartum stillbirth' (occurring before the start of labor) [8]. As per the current reporting process of the Indian health system, it is challenging to distinguish antepartum stillbirth from intrapartum stillbirth [20]. The absence of quality data and under-reporting of stillbirth is the main impediment to minimizing the burden of stillbirth [6, 21-24]. The National Family Health Survey-4 (NFHS-4) does not distinguish stillbirth from neonatal death and lacks data for assessing modifiable non-medical risk factors of stillbirth [25, 26]. Even NFHS-5 has not given any input on this aspect [27]. Therefore, this review attempts to assemble all the socioeconomic parameters on a single platform that increases the burden of stillbirth in India. The present study helps to measure the impact of specific socioeconomic parameters on the risk of stillbirth in different regions of India. Accordingly, a region-specific tailored public health intervention can be designed to mitigate the risk of stillbirth. The review also aims to assess the risk of stillbirth in rural and urban settings of India.
2. METHODS
2.1. Literature Search Strategy and Citeria for Study Selection
A systematic literature search was done using PubMed, Scopus, Web of Science, and Google Scholar electronic databases. An advance search was performed on PubMed by combining the potential keywords and placing the query as- “(((((((socioeconomic status) OR (socioeconomic factor)) OR (socioeconomic disparities)) OR (socioeconomic position)) OR (socioeconomic determinants)) OR (socioeconomic inequalities)) AND (stillbirth)) AND (India)”. The PubMed search string is mentioned in Supplementary file 1. The literature search was carried out on 5th November 2021, yielding 16821 research articles. All duplicate articles were removed by manual screening. The flow diagram in Fig. (1) reflects the search strategy adopted in this review.
2.2. Inclusion and Exclusion Criteria
The literature search was confined to the research papers published in the English Language. No restrictions were applied to the period for the data search; however, the articles published from 1991 onwards only were included for the analysis. The studies conducted on females in the age group of 19-49 years were included. Further screening of all the potential studies was done by reading their titles and abstracts. Thereafter, full-text articles were searched manually in all available digital resources.
The current study consists of only those studies that showed an association of the risk of stillbirth with socioeconomic factors. After the final screening, a total of thirty-nine (n=39) studies were considered for this review, which fulfilled the research objectives of the present study.
2.3. Quality Assessment
The GRADE system was used to assess the quality of the studies. Key factors for the quality assessment were the study design, data sources, statistical analysis, and content clarity of the listed studies [28].The moderate and high-quality studies were included (Supplementary file 2).
2.4. Data Analysis and Presentation
2.4.1. Types of study design
A total of twenty studies (n=20) were considered for investigating the association of SES with the risk of stillbirth. Among the total listed studies, there were five case-control studies (n=5/20), three cross-sectional studies (n=3/20), two observational studies (n=2/20), one cohort study (n=1/20), one clustered randomized control trial (n=1/20), and two studies based on verbal autopsy (n=2/20). Six enlisted studies (n=6/20) were based on analysis of secondary data from the NFHS, District Level Household Survey (DLHS), and Annual Health Survey (AHS).
2.4.2. Types of Assessment
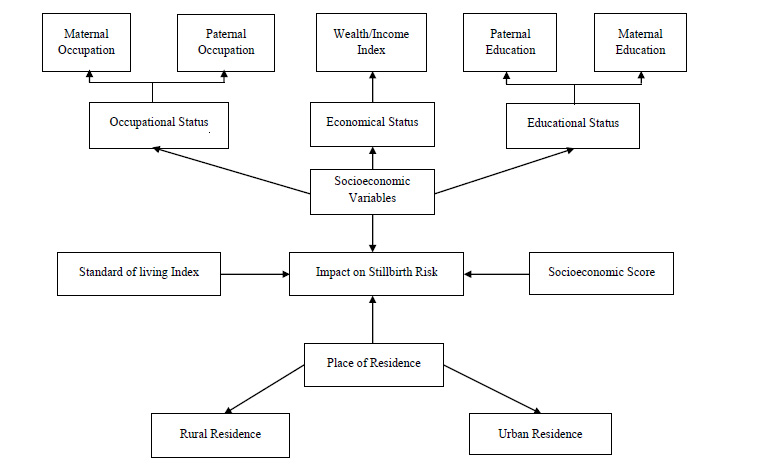
A narrative synthesis was performed by classifying the outcomes into four categories according to the relationship of stillbirth risk with the specific determinants of SES (viz. education, occupation, and income) and place of residence. Education includes formal education as well as health care education and training. Two of these parameters, i.e., education and occupation, were further classified into maternal and paternal characteristics to develop an in-depth understanding of the causes of stillbirth (Fig. 2). A separate table was created to illustrate the relation of stillbirth with the standard of living index and composite SES score.
A total of sixteen listed studies (n=16/20) illustrated the association of education with the risk of stillbirth. Only four studies (n=4/20) expressed the association of wealth status with the burden of stillbirth. Eight studies (n=8/20) showed the relation of stillbirth with the occupation of mother, father, and parents. Seven studies (n=7/20) revealed the association of the standard of living index and SES scores with the risk of stillbirth. Eight studies (n=8/20) showed the association of stillbirth with the place of residence.
2.4.3. Discrepancies in Outcomes
Three studies (n=3) assessed the impact of SES on perinatal mortality, including both spontaneous abortion and stillbirth. In three studies (n=3), the data collected from multiple countries, including India, was assessed; however, the outcomes of these studies were not country-specific.
3. RESULTS
3.1. Variation of Terminology
The variation in the definitions of stillbirth in all the enlisted studies was assessed in Table 1. In more than half of the listed studies, stillbirth was defined on the basis of gestational age at the time of birth (n=16). Few of the studies (n=2) took into account the birth weight of the baby (>1000g) to define stillbirth, whereas some studies (n=5) did not include any definition.
After assessing the quality of the potential studies, two studies were excluded. The results of most of the listed studies advocated some extent of association of women's SES with stillbirth (Tables 2-6), except for a few of the studies that did not represent a significant association of SES with the risk of stillbirth [37, 41, 43, 44]. The inconsistency in the association of different socioeconomic factors with the risk of stillbirth was observed in the listed studies. A wide variation was observed in the parameters considered for assessing SES and its effect on stillbirth in different Indian settings.
3.2. Impact of Education on Stillbirth in India
3.2.1. Association of Maternal Education with the Risk of Stillbirth
Most of the studies (n=16/20) advocated that the education level of mothers reasonably affects the stillbirth rate (Table 2). Eleven studies (n=11/16) elucidated the direct association of maternal education with the risk of stillbirth. A clear picture of the direct impact of maternal education on the stillbirth rate can be observed in five studies in which the stillbirth rate was declining steadily with an increase in the level of education [6, 15, 31, 45, 46]. Majority of case-control studies (n=3/4) proved that the risk of stillbirth was significantly higher among illiterate mothers [21, 33, 43]. Out of which, two case-control studies were conducted in Haryana, where the risk of stillbirth was relatively high (aOR=2.81, CI 95%: 1.12-10.59) among illiterate mothers [33, 43]. Similar outcomes were reported by a cohort study conducted in Maharashtra (HR=1.03, CI 95%: 0.5-2.2) [30]. As per a randomized control trial conducted in the slum areas of Mumbai, the health care training programmes were recognized to be crucial in reducing the burden of stillbirth [47]. The risk of stillbirth reduced when essential newborn care training was provided to mothers [35], particularly to those with low education [42].
3.2.2. Association of Paternal Education with the Risk of Stillbirth
The risk of stillbirth with the father’s education was assessed by five enlisted studies (n=5/16), out of which, three studies (n=3/5) expressed the direct association of father’s illiteracy with stillbirth rate [20, 33, 40]. The impact of paternal illiteracy on the stillbirth rate with OR=2.7 [33] and OR=1.6 [43] was evident in the case-control studies conducted in Haryana. A visible difference in the stillbirth rate can be observed between illiterate and highly educated fathers [39].
| Weeks of gestation | No. of Studies | References |
|---|---|---|
| ≥ 16 weeks* | 1 study | Hirst et al. 2016 [29] |
| ≥ 20 weeks | 2 studies | Gupta & Subramoney 2006 [30], McClure et al. 2015 [31] |
| ≥ 22 weeks | 1 study | More et al. 2009 [32] |
| ≥ 24 weeks | 2 studies | Neogi et al. 2015 [23], Neogi et al. 2018 [20] |
| ≥ 28 weeks | 10 studies | Kumar & Singhi 1992 [33], Mishra et al. 2005 [34], Kulkarni et al. 2007 [1], Srivastava et al. 2008 [46], Carlo et al. 2010 [35], McClure et al. 2011 [7], Bhattacharyya & Pal, 2012 [36], Viswanath et al. 2015 [37], Dandona et al. 2017 [38], Altijani et al. 2018 [15] |
| Do not include definition | 5 studies | Mavalankar et al. 1991 [21], Rajaram et al. 2008 [39], Lakshmi et al. 2013 [40], Patra 2016 [41], Chomba et al. 2017 [42] |
| Other definitions | 3 studies | Kapoor et al. 1994 [43], Williams et al. 2008 [45], More et al. 2012 [46] |
| Author(s) | Method | Population & Sample sizes | Education |
|---|---|---|---|
| Neogi et al. 2018 [20] | Case-control study (Population based) |
Bihar Cases: n=400 stillbirths & Controls: n=800 livebirths |
Father’s education Illiterate: Case:38% & Control:38.8%; P=0.8 |
| Altijani et al. 2018 [15] | Analysis of data of AHS (2010-13) |
Madhya Pradesh, Chhattisgarh, Bihar, Rajasthan, Odisha, Assam, Uttarakhand, Jharkhand & Uttar Pradesh n=886505 women aged 15-49 years |
Mother’s education level Illiterate: aOR=1.43(1.17-1.74) ≥ Primary: aOR=1.34(1.10-1.62) Secondary: aOR=1.10(0.90-1.34) ≥ Tertiary: aOR=1.00 (Ref) |
| Patra, 2016* [41] | Analysis of data of DLHS-1 (1998-99), DLHS-2 (2002-04), DLHS-3 (2007-08) | n=18709 pregnancies that occurred into currently married adolescent women (15-19 years) |
Mother’s education level Uneducated or <5: 2.2% (Ref) 5-9 std: 1.9% OR=0.893 (0.788-1.012); P<0.01 ≥ 10 std:1.4% OR=1.257(1.011-1.562); P<0.05 |
|
Father’s education level Uneducated or <5: 2.0% (Ref) 5-9 std: 2.4% OR=0.879 (0.732-1.055) ≥ 10 std: 1.7% OR=1.050 (0.913-1.206) |
|||
| Viswanath et al. 2015*** [37] | Case-control study (Community based) |
Tamilnadu Cases: n=40 perinatal deaths Control: n=110 livebirths |
Mother’s education level No education: aOR=0.91 (0.17-2.93) |
| McClure et al. 2015** [31] | Observational study (Population-based) |
6 countries including India (Maharashtra & Belgaum) n=272089 births including 7865 stillbirths |
Mother’s education level No education: RR=1.9(1.7-2.2) Primary: RR=1.3(1.2-1.5) Secondary: RR=1.2(1.1-1.3) University +: (Ref) |
| Lakshmi et al. 2013 [40] | Analysis of data of DLHS-2 (2002-04) | n=188917 mothers who had stillbirth/livebirth in last 3 years |
Maternal literacy Illiterate mother: aOR=1.13(1.04-1.23); P=0.005 |
|
Paternal literacy Illiterate father: aOR=1.14 (1.06-1.23); P=0.001 |
|||
| More et al. 2012 [47] | Cluster Randomized control trial |
Mumbai 24 interventions cluster & 24 Control cluster n= 18197 Births |
Maternal literacy Intervention: 7.97 Stillbirth/1000 Control: 9.4 Stillbirth/1000 Health care learning: aOR=0.66(0.46-0.93) |
| McClure et al. 2011** [7] | Observational study (Population-based) |
6 countries including India (Maharashtra, Orissa & Belgaum) n=198436 PW of 24 weeks |
Mother’s education level No formal schooling: 1.8% OR=1.4 (1.2-1.5); P<0.001 ≥1 year formal schooling: 2.9% OR= 1 (Ref) |
| Williams et al. 2008 [45] | Cross-sectional study (Community based) |
Uttar Pradesh n=33111 WRA ever-married n=80164 Births |
Mother’s education level Illiterate: aOR=1.21(0.77-1.89) Primary education aOR=1.14(0.72-1.80) >Primary education: (Ref) |
| Rajaram et al. 2008 [39] | Analysis of data of NFHS-2 (1998-99) | n=90000 ever-married women aged 15-49 years |
Mother’s education level Illiterate: 2.3% (Ref) <Middle:1.94%; OR=0.9983 Significance value=0.9510 Middle: 1.70%; OR=1.0108 Significance value=0.7780 ≥High school: 1.46% OR=1.0234 Significance value:0.5330 |
| Srivastava et al. 2008 [46] | Analysis of data of DLHS-3 (2007-08) | n= 228, 146 single deliveries |
Maternal literacy None: Ref 1-5 years: 1.04 (0.89-1.23) 6-9 years: 0.86 (0.74-1); P<0.05 ≥10 years: 0.73(0.57-0.93); P<0.05 |
| Gupta & Subramoney 2006 [30] | Cohort study (Population based) |
Maharashtra n=1217 PW |
Maternal literacy Education <10th grade: aHR=0.6 (0.3-1.4) |
| Mishra et al. 2005 [34] | Analysis of data of NFHS-2 (1998-99) | n= 19189 ever-married women aged 40-49 years | Illiterate: (Ref) <Middle: aOR=0.82; P<0.05 ≥Middle: aOR=0.70; P<0.01 |
| Kapoor et al. 1994 [43] | Case-control study (Hospital based) |
Haryana Cases: n=72 stillbirths & Controls: n=144 livebirths |
Maternal literacy: Nil: aOR=2.81 (1.12-10.59) Literate: Ref. |
|
Father’s education level Nil: OR=2.70 (0.89-8.42) <8th class: OR= 2.88 (1.00-8.43) 9-12 class: OR=1.27 (0.47-3.52) >12th class: Ref. |
|||
| Kumar & Singhi 1992 [33] | Case-control study (Community based) |
Haryana Cases: n=68 stillbirths & Controls: n=2593 livebirths |
Maternal literacy Illiterate mother: OR=1.3 (0.3-6.3) |
|
Paternal literacy Illiterate Father: OR=1.6 (0.6-4.1) |
|||
| Mavalankar et al. 1991 [21] | Case-control study (Population based Survey) |
Ahmedabad Cases: n=517 neonatal deaths & 739 stillbirths Controls: n=1465 livebirths |
Maternal literacy No education: OR=1.7 (49.2%) |
***Association was calculated for perinatal death, which includes stillbirth.
** OR is calculated for the entire population; exclusive data for India is not mentioned.
*OR is calculated for pregnancy loss, including stillbirth and abortions (both spontaneous and induced)
# Significant p-value >0.05
3.3. Impact of Occupation on Stillbirth in India
3.3.1. Association of Maternal Occupation with the Risk of Stillbirth
A total of six studies (n=6/8) assessed the association of maternal occupation with stillbirth (Table 3). In four enlisted studies (n=4/8), maternal occupation was classified as working and non-working women (housewives), and the prevalence of stillbirth was higher among working women [30, 39, 41, 43]. In some studies, the maternal occupation was also classified as paid/unpaid employment [15] and household/outside work [20]. The risk of stillbirth was comparatively lower among housewives [20, 43] and women in paid employment [15].
3.3.2. Association of Paternal Occupation with the Risk of Stillbirth
The impact of paternal occupation on stillbirth was assessed in four studies (n=4/8).The risk of stillbirth was estimated on the basis of the type of paternal occupation in all four studies [33, 47]. The risk of stillbirth was higher in women whose spouse was working as a laborer [20, 33, 43] or peasant [21, 43].
| Author(s) | Methods | Population & Sample sizes | Occupations |
|---|---|---|---|
| Neogi et al. 2018 [20] | Case-control study (Population based) |
Bihar Cases: n=400 stillbirths & Controls: n=800 livebirths |
Father’s occupation (non-manual laborer): Case: 40.8% & Control: 45.6% P=0.11 |
|
Mother’s occupation (working outside home): Case: 29.3% & Control: 35.4% P=0.03* (significant value: P <0.05) |
|||
| Altijani et al. 2018 [15] | Analysis of data of AHS (2010-13) |
Madhya Pradesh, Jharkhand, Bihar, Rajasthan, Uttar Pradesh, Odisha, Assam, Uttarakhand & Chhattisgarh n=886505 women aged 15-49 years |
Mother’s occupation Paid employment: Ref Unpaid employment: aOR=1.15(1.07-1.24) |
| Patra, 2016 [41] | Analysis of data of DLHS-1 (1998-99), DLHS-2 (2002-04), DLHS-3 (2007-08) | n=18709 pregnancies that occurred to currently married adolescent women (15-19 years) |
Mother’s occupation** Non-working: Ref Working: OR: 1.037 (0.882-1.218), P<0.001 |
| Rajaram et al. 2008 [39] | Analysis of data of NFHS-2 (1998-99) | n=90000 ever-married women aged 15-49 years |
Mother’s occupation *** Working: Ref Non-working: OR=0.9841, |
| Gupta & Subramoney 2006 [30] | Cohort study (Population based) |
Maharashtra n=1217 PW |
Mother’s occupation Working Mother: aHR=1.1 (0.5-2.8) |
| Kapoor et al. 1994 [43] | Case-control study (Hospital based) |
Haryana Cases: n=72 stillbirths & Controls: n=144 livebirths |
Mother’s occupation Housewife: Ref Working: OR=7.71 (22.0-29.37) |
|
Parental occupation Employed: OR=4.17(1.20-14.66) Casual laborer: OR=9.04(3.54-23.6) Farmer: OR=3.52(1.04-11.99) Shopkeeper: OR=2.26(0.87-5.94) Service: Ref |
|||
| Kumar & Singhi 1992 [33] | Case-control study (Community based) |
Haryana Cases: n=68 stillbirths & Controls: n=2593 livebirths |
Parental occupation (Laborer): OR=1.6 (0.5-6.2) |
| Mavalankar et al. 1991 [21] | Case-control study (Population based Survey) |
Ahmedabad Cases: n=517 neonatal deaths & 739 stillbirths Controls: n=1465 livebirths |
Parental occupation Husband works in farming: OR= 2.6 (5.5%) |
*Values of p<0.05 considered as a significant association (Chi-square estimates for proportion)
**OR is calculated for pregnancy loss, including stillbirth and abortions (both spontaneous and induced)
***OR is calculated for pregnancy loss, including stillbirth and spontaneous abortions
3.3.3. Impact of Income on Stillbirth in India
In total, only four studies (n=4/20) showed the association of wealth index with the risk of stillbirth (Table 4). Out of which, three studies were based on the data of AHS [15] and DLHS [41, 46], which showed a decrease in the incidence of stillbirth with the progressive increase in wealth index. However, the impact of the wealth index on the risk of stillbirth was not clearly evident in a cross-sectional study conducted in Uttar Pradesh [45].
3.3.4. Association of Composite SES Score and Standard of Living Index with the Risk of Stillbirth
A total of seven studies (n=7) reported the impact of the SES score and the standard of living index on the risk of stillbirth (Table 5). Total three enlisted studies (n=3/7) illustrated the association of the standard of living index with the risk of stillbirth [34, 39, 40]. Out of which, two studies (n=2/3) revealed a decrease in the risk of stillbirth with improved standard of living of mothers [39, 40].
The relation of risk of stillbirth with SES score was evaluated in four studies (n=4/7), and all four studies showed that the prevalence of stillbirth was highest among the population standing with the lowest SES [29, 30, 32, 36].
3.3.5. Impact of the Place of Residence on Stillbirth in India
The mother's residence (rural/urban) considerably affects the risk of stillbirth and neonatal death [15, 36, 38, 40]. All enlisted studies indicate that the incidence of stillbirth was higher among women living in rural settings than urban. The percentage of stillbirth rate in rural areas was approximately twice to thrice of urban areas [2, 36]. As per the verbal autopsy conducted in Bihar and Maharashtra, the prevalence of stillbirth was significantly lower in urban areas [2, 38].
Table 4.
| Author(s) | Methods | Population & Sample sizes | Wealth Indexes |
|---|---|---|---|
| Altijani et al. 2018 [15] | Analysis of data of AHS (2010-13) |
Madhya Pradesh, Rajasthan, Odisha, Bihar, Assam, Uttarakhand, Uttar Pradesh, Jharkhand & Chhattisgarh n=886505 women aged 15-49 years |
Asset index (aOR): Q1: 2.42 (1.82-3.21) Q2: 2.45 (1.85-3.24) Q3: 1.91 (1.45-2.52) Q4: 1.34 (1.01-1.79) Q5 (Highest): (Ref) |
| Patra, 2016 [41] | Analysis of data of DLHS-1 (1998-99), DLHS-2 (2002-04), DLHS-3 (2007-08) | n=18709 Pregnancies that occurred to currently married adolescent women (15-19 years) |
Wealth quintile (OR)*: Q1: 2.1% (poorest) Ref Q2: 2.3%; 0.726 (0.607-0.868) Q3: 2.2%; 0.613 (0.511-0.736) Q4: 1.5%; 0.531 (0.436-0.647) Q5: 1.6%; 0.414 (0.323-0.531) P<0.001 |
| Williams et al. 2008 [45] | Cross-sectional survey (Community based) |
Uttar Pradesh n=33111 Ever-married WRA n=80164 Births |
Wealth index (aOR): Lowest: aOR=1.04 (0.88-1.23) Middle: aOR=1.05 (0.89-1.24) Upper: (Ref) |
| Srivastava et al. 2008 [46] | Analysis of data of DLHS-3 (2007-08) | n= 228,146 single deliveries |
Wealth quintile (aOR): Poorest: Ref Poorer: 1.08 (0.91, 1.29) Middle: 0.93 (0.77, 1.12) Richer: 0.89 (0.73, 1.09) Richest: 0.64 (0.5, 0.81); P< 0.05 |
*OR is calculated for pregnancy loss, including stillbirth and abortions (both spontaneous and induced)
| Author(s) | Methods | Population & Sample sizes | Standard of Living/SES scores |
|---|---|---|---|
| Hirst et al. 2018** [29] | Cross-sectional study (Hospital-based) |
8 countries including India (Maharashtra) n=3364 Births (newborn) |
Low socioeconomic standing: aHR=1.6 (1.2-2.1) for stillbirth |
| Antepartum stillbirth: 34.6% Positive LR: 1.5 (1.3-1.7) Negative LR: 0.9 (0.8-0.9) |
|||
| Lakshmi et al. 2013 [40] | Analysis of data of DLHS-2 (2002-04) | n=188917 mothers who had stillbirth or live birth in last 3 years |
Standard of living: High: (Ref) Medium: aOR=1.06 (0.94-1.21); P=0.337 Low: aOR=1.09 (0.94-1.27); P=0.262 |
| Bhattacharyya & Pal 2012 [36] | Cross-sectional study (Hospital based) |
West Bengal n=156101 Deliveries |
Socioeconomic status: High: OR= 0.44 (0.41-0.47) Middle: OR=0.78(0.74-0.82) Low: OR=1.83(1.76-1.90) P<0.001 |
| More et al. 2009 [32] | Cross-sectional study (Community based) |
Mumbai (Slum) n=5687 Births |
Socioeconomic quartiles*: (Stillbirth rate/100 births) Q1: 18.3 Q2: 10.1 Q3: 22.4 Q4: 15.2 aRR=1.02 (0.74-1.40) Least poor: poorest aRR=0.83 (0.28-2.44) |
| Rajaram et al. 2008 [39] | Analysis of data of NFHS-2 (1998-99) | n=90000 ever-married women aged 15-49 years |
Standard of living: Low: 2.42%; Ref. Medium: 2.13%; OR=0.9906 P=0.7090 High: 1.53%; OR=0.9816 P=0.6060 |
| Gupta & Subramoney 2006 [30] | Cohort study (Population based) |
Maharashtra n=1217 PW |
Low socioeconomic status: aHR=1.2 (0.6-2.5) |
| Mishra et al. 2005 [34] | Analysis of data of NFHS-2 (1998-99) | n=19189 ever-married women aged 40-49 years |
Standard of living: Low: Ref Medium: aOR=0.94 High: aOR=1.03 |
* Calculated by using standardized asset score.
** HR is calculated for the entire population, limited data presented for India.
| Author(s) | Methods | Population & Sample sizes | Places of residence |
|---|---|---|---|
| Altijani et al. 2018 [15] | Analysis of data of AHS (2010-13) |
Madhya Pradesh, Chhattisgarh, Bihar Rajasthan, Odisha, Uttarakhand, Assam, Jharkhand & Uttar Pradesh n=886505 women aged 15-49 years |
Rural aOR=1.27(1.16-1.39) Urban: (Ref) |
| Dandona et al. 2017 [38] | Verbal autopsy (Population based) |
Bihar n=1132 stillbirths |
Rural: OR=22.6(20.9-24.2) Urban: OR=15.4(12.6-18.2) |
| Patra, 2016* [41] | Analysis of data of DLHS-1 (1998-99), DLHS-2 (2002-04), DLHS-3 (2007-08) | n=18709 pregnancies that occurred to currently married adolescent women (15-19 years) | Rural: 2.1%, (Ref) Urban: 1.8% OR=0.93(0.79-1.09) |
| Lakshmi et al. 2013 [40] | Analysis of data of DLHS-2 (2002-04) | n=188917 mothers who had stillbirth or live birth in last 3 years | Rural: aOR=1.04(0.95-1.13) Urban: (Ref); P=0.417 |
| Bhattacharyya and Pal 2012 [36] | Cross-sectional study (Hospital based) |
West Bengal n=156101 Deliveries |
Rural: 4.23% OR=2.05(1.93-2.18) Urban: 2.12% OR=0.49 (0.46-0.52) P<0.0001 |
| Rajaram et al. 2008 [39] | Analysis of data of NFHS-2 (1998-99) | n=90000 ever-married women aged 15-49 years | Rural: Ref. Urban: OR=0.9804 Significance level=0.4530 Coefficient: -0.0198 |
| Kulkarni et al. 2007 [2] | Verbal autopsy (Population based) |
Maharashtra n=81 perinatal deaths including 31 stillbirths and 52 neonatal deaths |
Rural: 74.2% Urban: 25.8% χ2=3.85, P=0.05, df=1 |
| Mishra et al. 2005 [34] | Analysis of data of NFHS-2 (1998-99) | n=19189 ever-married women aged 40-49 years | Rural: Ref. Urban: aOR=0.99 |
*OR is calculated for pregnancy loss, including stillbirth and abortions (both spontaneous and induced)
| Risk factors/Countries | Nepal | Pakistan | Bangladesh |
|---|---|---|---|
| References | Bhusal et al. 2019 [66] | Afshan et al. 2019* [11] | Hossain et al. 2019 [67] |
|
Education level No education Primary education ≥Secondary education |
aOR (95%CI) 1.00 (Ref) 1.02 (0.79-1.33), P<0.001 0.53 (0.81-1.38), P<0.001 |
aOR (95%CI) 2.48 (1.67-3.68), P=0.000 1.96 (1.30-2.94), P=0.001 1.00 (Ref)# |
aOR (95%CI) 1.00 (Ref) 1.09 (0.88-1.13), P=0.438 0.81 (0.61-1.08), P=0.154 |
|
Wealth Index Poorest Middle Richest |
aOR (95%CI) 1.00 (Ref) 0.94 (0.72-1.22), P<0.001 0.75 (0.54-1.03), P<0.001 |
aOR (95%CI) 2.33 (1.62-3.34), P=0.000 1.53 (1.04-2.25), P=0.02 1.00 (Ref) |
aOR (95%CI) 1.07 (0.81-1.40), P=0.639 1.19 (0.92-1.49), P=0.201 1.00 (Ref) |
|
Residence Rural Urban |
aOR (95%CI) 1.31 (1.00-1.72), P<0.001 1.00 (Ref) |
aOR (95%CI) 1.73 (1.21-2.49), P=0.028 1.00 (Ref) |
aOR (95%CI) 0.97 (0.83-1.13), P=0.683 1.00 (Ref) |
*Association was calculated for perinatal death, which includes stillbirth
#Above secondary was taken as reference.
3.3.6. Other Contributory Factors for the Risk of Stillbirth
Stillbirth and neonatal death were notably affected by other socioeconomic factors like size and density of family [33, 34, 48], type of family (nuclear/joint) [33], and type of house (pucca/semi-pucca/kaccha) [33, 34, 37, 40]. The household environmental conditions, such as unavailability of the toilet (OR=1.5) and shortage of drinking water (OR=1.4), were also found associated with the risk of stillbirth [21]. Kumar & Singhi (1992) analyzed the association of the stillbirth rate with the different physical assets possessed by the household [33].
Some of the studies have linked the risk of stillbirth with the usage of biomass fuel for cooking during pregnancy. These studies revealed that women using biomass fuel were almost twice vulnerable than women using cleaner fuel [21, 34]. As per the analysis of DLHS-2 data, the usage of wood for cooking (APR=1.24, 95% CI: 1.08-1.41) and kerosene for lighting (APR=1.15, 95%CI: 1.06-1.25) and cooking (APR=1.36, 95%CI: 1.10-1.67) were the significant determinants of the risk of stillbirth [40]. Inlined with the previous findings, a cohort study conducted in Tamilnadu also revealed the association of stillbirth with exposure to biomass fuel [49].
3.3.7. Social Impact of Stillbirth in India
Though the incidence of stillbirth was comparatively higher in low- and middle-income countries, the research on the impact of stillbirth and bereavement care has widely been conducted in high-income countries [50]. Pregnancy loss is a massive loss in terms of mothers' physical and mental health; in addition, it also causes immense social distress due to the loss of life, especially in the stigmatized socio-cultural dimension of India [22, 51]. The double burden of loss of life can easily be identified in rural areas where maternal mortality followed by stillbirth was comparatively higher [52]. The mothers of the stillborn suffer anxiety and depression [53-55]. Bereavement was found to be strongly associated with the SES of mothers [56-58]. The degree of depression of mothers decreased and gradually settled down with time. At the same time, the recovery time was also dependent on the social dimensions of the mothers [53]. Social provision of support was a strong predictor of the diminution of perinatal grief in women [54]. The involvement of health care workers can help them step out of anxiety and understand the role of postpartum investigations and verbal autopsies [58]. The incidence of stillbirth also affects the SES of mothers adversely. Therefore, appropriate bereavement care is necessary for minimizing the adverse impact of SES on stillbirth [50].
4. DISCUSSION
For the past two decades, the pace of reducing the stillbirth rate in our country has been slow. It is not sufficient to achieve the goals of the Indian Newborn Action Plan (2014) [17]. In the absence of quality and comparability standards to report stillbirths, it has not been identified and recorded accurately at the local level in India. The difference in stillbirth definitions causes difficulty in the precise assessment of stillbirth risk factors. Consequently, we may omit identifying some of the significant determinants of stillbirth (Table 1). In the present literature review, it was observed that despite several efforts to improve pregnancy care in India, socioeconomic disparities carry on as major preventable risk factors of stillbirth.
The access to free of cost availability to antenatal care services among women with poor economic conditions is an ongoing exercise, which is also a prerequisite to alleviate the risk of stillbirth [33, 59, 60]. According to the findings of the listed studies, disparities in the risk of stillbirth depend upon the inequalities in women's socioeconomic standing. Mothers belonging to low SES strata are more vulnerable due to the pronounced risk of stillbirth [29, 36]. Identification of economic indicators of stillbirth is always a challenge in rural settings; studies in India have observed that the nature of rural residence or households could be considered as one of the strongest predictors of stillbirth (Table 6). The mortality rate of mothers followed by stillbirth was also higher in rural areas (14.5%) compared to urban (9.1%) [51]. Other reasons for the higher risk of stillbirth in rural areas are comparatively low availability, affordability, and accessibility to women's health care centers, along with the low level of health-related knowledge/awareness among WRA in rural areas [41].
Many women from the lower socioeconomic classes have been reported to be more prone to stillbirth if their husband is a laborer or peasant [21, 33]. If we look at the maternal occupational status, the risk of stillbirth was higher in working women than in non-working women or housewives [30, 39, 41, 43]. The stillbirth rate was higher in women with unpaid employment than paid women [15]. Paid employment certainly strengthens the economic condition of the mother, which results in a decrease in the risk of stillbirth. With the increase in income status of women, the risk of stillbirth decreased gradually [15, 41]. The same pattern was witnessed in maternal education, i.e., with an increase in the level of education of mothers, the rate of stillbirth declined steadily [15, 31, 45]. Health care education and training rendered to pregnant women enhanced the compliance of antenatal care services among mothers, thereby reducing the rate of stillbirth [46]. Mothers' higher educational and economic status can help them access and better utilize health care services by boosting their self-esteem and making them socially empowered [61]. Mothers of high-income status can also afford a private hospital where the reported stillbirth rate was significantly lower than general hospitals [47]. The low SES is also a cause of the poor nutritional status of mothers [62], and the poor nutritional status of mothers is one of the proven risk factors for increasing the burden of stillbirth [41, 63].
Many studies have been conducted to determine the socioeconomic risk factors of stillbirth in India (Tables 2-6). Some of the listed studies in this review were based on the AHS (2010-13), DLHS-1, DLHS-2, DLHS-3, and NFHS-2 conducted in India. The NFHS-2 (1998-99) was conducted in all 26 states of that time (excluding union territories) [64]. Similarly, the DLHS-3 has been conducted in all 34 states and union territories of India (excluding Nagaland) [65]. AHS (2010-13) has been encompassing nine states of India [15]. Apart from this, different kinds of studies (cross-sectional, case-control, cohort studies) have been conducted in Haryana, Tamil Nadu, Ahmedabad, Maharashtra, West Bengal, Bihar, Uttar Pradesh, and Orissa. By looking at all listed studies, it would not be wrong to say that stillbirth is prevalent in almost every part of the country; additionally, it is higher among the socio-economically disadvantaged population. The studies of the last two decades are evidence of high rates of stillbirth in the rural areas of our country.
Several studies have revealed that SES has a significant association with the risk of stillbirth in low and middle-income countries of the Indian subcontinent, such as Nepal [8, 66], Pakistan [11], Bangladesh [67], etc. Table 7 represents the studies conducted in Nepal, Pakistan, and Bangladesh based on the demographic survey of the respective countries, clearly showing the effect of SES on the risk of stillbirth.
The present study aims to collect all the previously conducted studies, evaluating the role of SES and place of residence in determining the risk of stillbirth. However, there was enormous heterogeneity between the statistical analysis methods of the listed studies. In some studies, only a crude odds ratio was calculated for computing the association of SES and place of residence with the risk of stillbirth. In addition, the value was adjusted for various other listed confounding factors in some studies, for instance, sociodemographic factors, utilization of health care services, obstetric history, etc. In some studies, the adjusted odds ratio was calculated for other potential confounders, although not mentioned in their research papers. In some studies, the P-value was not revealed. Despite all these dissimilarities in statistical analysis in previous studies, the role of low SES and rural residence can be clearly identified to increase the burden of stillbirth.
More attention and efforts are needed to reduce the burden of stillbirth in the underprivileged population. Specific maternal health interventions for identifying, addressing, and enhancing the socioeconomic position of households should be the primary step toward reducing the preventable risk of stillbirth. Front-line health workers can be sensitized to act just-in-time on the obstacles mothers face in both phases, i.e., before and after the incidence of stillbirth. Accredited Social Health Activists can assist women throughout their pregnancy by providing them newborn care training and counseling, conditional cash transfer, transportation facilities for institutional deliveries, etc. They can also assess the possible reasons for stillbirth immediately after delivery. For ensuring the implementation of such intervention, a large number of the ground-level workforce would be required [68], especially in rural areas. In order to eradicate the inequalities in access to health care services to the poorest and most vulnerable, private health sectors must be integrated with the public health sector. Health facilities should be equally accessible to people from all socioeconomic strata. These approaches would be a sustainable and effective way to reduce the burden of stillbirth prominently in low-and middle-income countries, and it would pave more effective ways for attaining the Sustainable Development Goals.
CONCLUSION
Discerning and enumerating the modifiable socioeconomic factors is necessary for reducing stillbirth rate. It is the foremost step for essential planning before designing and executing stillbirth reduction programmes and policies. A substantially effective health system is necessary to address these modifiable risk factors of pregnancy loss during the entire gestational period and to improvise antenatal and obstetric care services (especially in low resource settings). It will be a sustainable step toward reducing the stillbirth rate, potentially as per the ‘Indian Newborn Action Plan’ goals and meeting our accountability to the Sustainable Development Goals.
LIST OF ABBREVIATIONS
| SES | = Socioeconomic Status |
| WHO | = World Health Organization |
| NFHS | = National Family Health Survey |
| DLHS | = District Level Household Survey |
| AHS | = Annual Health Survey |
| WRA | = Women of Reproductive Age |
CONSENT FOR PUBLICATION
Not applicable.
STANDARDS OF REPORTING
PRISMA guidelines and methodologies were followed in this study.
FUNDING
This work was financially supported by Wellcome Trust-DBt Alliance, India (IA/CPHI/16/1/502623).
AVAILABILITY OF DATA AND MATERIALS
The sharing of original data and material is not applicable as no datasets were generated for conducting the present study, while the relevant data availed from the included studies in the current review is mentioned in the tables.
CONFLICT OF INTEREST
The authors declare no conflict of interest.
ACKNOWLEDGEMENTS
We acknowledge Wellcome Trust-DBT Alliance, India, for funding.
SUPPLEMENTARY MATERIAL
PRISMA checklist is available as supplementary material on the publisher’s website along with the published article.

