All published articles of this journal are available on ScienceDirect.

Clean Water, Housing Condition, and Diarrhea among Children under Five Years Old in Indonesia: Partial Least Square-Structural Equation Modeling (PLS-SEM)
Abstract
Introduction:
Diarrhea is still a challenging health problem for children under five years of age in Indonesia. This study aimed to analyze the effect, either direct or indirect, of child characteristics, family characteristics, drinking water sources and housing conditions on diarrhea in Indonesia.
Methods:
Children under five years old were selected from the total samples used in the Indonesia Demography and Health Survey (IDHS)in 2017. The research samples accounted for 17,263 children chosen for further investigation. Multiple regression logistics and PLS-SEM tests were employed to analyze the relationship between the independent and dependent variables.
Results:
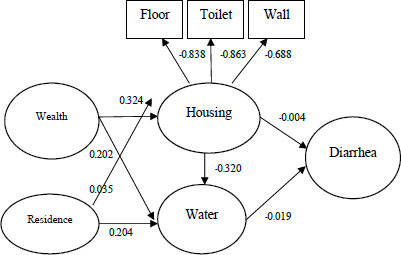
The logistic analysis yielded results that family wealth, toilet, walls, floor of the house, and location of the houses significantly influenced the access to clean water sources. Moreover, child’s gender, age, family wealth, floor of the house, and location were significantly associated with the prevalence of diarrhea. Obtained from Partial Least Square-Structural Equation Modeling (PLS-SEM) analysis, results found that wealth had the highest path coefficient of 0.324, indicating a high effect on diarrhea rates. The contribution of the residence to housing (β = 0.035) and water (β = 0.204) to diarrhea incidence was of positive significance, while water and diarrhea were statistically negative in contributing to diarrhea incidence (β =-0.019). In addition, residence and wealth on water and diarrhea had a partial mediator effect (β = -0.004 and -0.004, respectively).
Conclusion:
Our findings suggest that the accessibility to clean water source was an intervening variable that plays an important role in diarrhea cases in Indonesia. Besides, wealth and residence influenced the prevalence of diarrhea.
1. INTRODUCTION
It is estimated that the annual death rates caused by diarrhea are 1.8 million in developing countries. Over 80% of the deaths occur in children under five years of age, mainly because of insufficient drinking water resources, poor sanitation, and personal hygiene [1, 2]. Additionally, diarrhea results in approximately 72.8 million disability-adjusted life years (DALYs). It also negatively impacts children's physical and cognitive activities, economic family status, and health care [3-5]. In alleviating morbidity and mortality rates due to diarrhea, improving access to safe drinking water sources and developing good sanitation and hygiene programs, particularly for vulnerable population are required [5-8].
Access to safe and good sanitation facilities is only accessed by not more than 2.5 billion people worldwide, and this situation annually leads to 200 million tons of unmanaged human excretion [6-8]. It was reported that about 2.6 billion population in the world do not have access to appropriate toilets and latrines [9, 10].Consequently, many children under five years old are at a high risk of experiencing diarrhea, worsening the burden of disease on the population [11-13]. More than 18% of people in Indonesia depend on surface water sources as drinking water, for example, ponds, rivers, and lakes, which are contaminated with dirt [14], and only 11% of households in Indonesia have access to a water supply system [14]. This condition is exacerbated by the fluctuating amount of water debit [15, 16]. Not surprisingly, diarrhea remains a major child health problem in Indonesia, accounting for 31% of all postpartum deaths and 25% of child deaths [16].
Previous research has not addressed the direct effects and interactions of major risk factors on diarrhea rates in Indonesia. This study aimed to fill the gap in knowledge about the consequences of water quality and housing conditions, which commonly lead to diarrhea issues in children of Indonesian households. We applied the multivariate logistic regression and partial least squares structural modeling (PLS-SEM) to answer two research questions: (1) Do family wealth and residence influence drinking water sources at the household level? and (2) Do drinking water sources and housing condition influence diarrhea rates among children under 5 years old?
2. MATERIALS AND METHODS
2.1. Data
Data in this study were drawn from the 2017 IDHS accessed through the DHS Program-ICF International. The IDHS is an important series of surveys that provides important information about health conditions, nutrition, and demographic indicators in a particular country based on national representative samples. The 2017 IDHS successfully interviewed 49,250 eligible women aged 15-49 years. Multi-stage random sampling was used to obtain representative samples across all provinces of Indonesia. In the 2010 Population Census of Indonesia, 1,970 census blocks (CB) were used to determine the first sampling stage. Then, 34 CBs were taken from each province. At the second stage, eight families were randomly selected for each selected CB. For this study, we selected data about children under 5 years old living with their mothers. Accordingly, the samples numbered 17,263 children. The data were generated from the raw data provided by The Demographic and Health Survey Program (DHS Program).
2.2. Study Variables
The main dependent variable was diarrhea. Questions related to diarrhea were given to mothers who lived at the same house as their children. The questions indicated whether a child experienced diarrhea within the past two weeks before the survey. Answers to the questions were grouped into Yes (coded as 1) and No (coded as 0). While answers to questions related to drinking-water source were coded as 1 if indicating piped water or dug well water or as 2 if referring to spring or rainwater.
The main independent variables comprised child’s gender, child’s age, family characteristics, housing characteristics, and residential area (location). Child's gender was grouped into male coded as 1 and female coded as 2. Child’s age was counted in years. Parents’ educational attainment was categorized as “no education” (coded as 0), “primary level” (coded as 1), “secondary level” (coded as 2), or “higher level” (coded as 3). Family wealth status was measured from the five quintile groups of household wealth. The household wealth index was developed by calculating all household properties and facilities such as radio, television, refrigerator, bicycle, motorcycle, or car, as well as house conditions such as electric, flooring, wall/roofing, water source, latrine ownership, and bedroom. Family wealth was based on quintiles from the lowest to highest. Furthermore, housing conditions were characterized by the condition of toilets and building materials for walls and floors. Wall materials were classified as permanent (cement, brick, stone with lime, ceramic tiles) (coded as 1) or not permanent (bamboo, cardboard, wood plank, bamboo) (coded as 0). The flooring criteria comprised ground-sand (coded as 0), semi-permanent (coded as 1), and permanent/concrete materials (coded as 2). In addition, the residential area was grouped into urban (coded as 1) and rural areas (coded as 0). We studied seven Indonesian provinces: Java and Bali, Kalimantan, Sumatra, Maluku, Sulawesi, Papua, and Nusa Tenggara, coded 1 to 7, respectively.
Furthermore, some independent variables were grouped into several latent variables in the PLS-SEM analysis. Child variable consists of gender and age; socio-economic variable consists of father’s education, mother’s education, and family wealth; housing location consists of region and residential area; housing characteristics variable comprises of flooring, wall, and toilet; water source variable involves the water source indicator. Last but not least, diarrhea refers to a diarrheic condition.
2.3. Statistical Analysis
A logistic regression test was performed to analyze the OR = of independent variables toward drinking-water sources and diarrhea status. The hypothesis testing was rejected if the p-value was less than a significant level of 0.05. While PLS-SEM was used to test a correlation between latent variables and to confirm an indirect association between housing characteristics and drinking water sources toward diarrhea incidence in children under five years old. The use of PLS-SEM lies on some advances of this test. First, the test can predict models between latent variables. Second, it is useful for testing relatively complex models to identify relationships between independent, moderating and dependent variables. Third, PLS-SEM does not require a large sample size but data with a normal distribution [17].
3. RESULTS
3.1. Demographic Characteristics
Tables 1 and 2 present the general characteristics of 17,263 households included in this study. The majority (51.4%) of children were male and one year old. A little more than half of the mothers (55.8%) and fathers (55.1%) had a secondary level of education. About a quarter (27.5%) of households had the poorest wealth status. This study found that about 17.2% of the households had toilets below the standard, and about 10.1% had non-permanent walls for their houses. The majority of the households (21.4%) lived in houses with non-permanent floors. Half of their houses were located in rural residence (50.8%). Almost two-thirds of the households resided in Java Bali (30.3%) and Sumatra (26.6%). In addition, 26.0% of the households used unsafe drinking water (Table 2), while 14.1% of the households had children with diarrhea (Table 2).
Table 1 presents that 49.9% of mothers and 48.8% of fathers with secondary education used unsafe drinking water. Additionally, 59.2% of the households in the poorest socio-economic groups consumed unsafe drinking water, which was used only by 3.9% of the richest households. This study found that 40.1% of the households with inappropriate toilets consumed unsafe drinking water, higher than 22.4% of the households whose houses had non-permanent walls. Besides, 43.5% of the households whose houses had non-permanent floors utilized unsafe drinking water, and so did the majority of households residing in rural residences (81.3%). One-fourth (24.5%) of households who lived in Sumatra also used unsafe drinking water.
Table 2 shows that male children had more diarrhea than girls (54.4% vs 45.6%), and a year-old child or less had more diarrhea than other age groups. More than half of mothers (56.8%) and fathers (55.1%) who attained secondary school level had children with diarrhea. Most households (31.4%) in the poorest socioeconomic groups had children with diarrhea. However, this study found even family who had below-standard toilets still had children with diarrhea. Contributing to the total diarrheic children, 10.5% of the households whose houses used non-permanent walls had children with diarrhea. A similar case was found in households with permanent-flooring houses. Some households (28.3%) who consumed unsafe drinking water source had children with diarrhea. Regarding the region, 55.1% of the households in Sumatra had children with diarrhea, providing the highest rate among other regions.
3.2. Logistic Regression Analysis
3.2.1. Determinants of Improved and Unimproved Drinking Water
Table 1 shows the logistic analysis of family wealth, toilet, walls and floors of the houses, area and location. All of these variables significantly influenced the access to clean drinking water sources at significant levels of 0.01. Regarding family wealth, the richest households were 6.493 times more likely to have clean drinking water compared to the poorest households (OR = 6.493, 95% CI = 11.60 - 19.60). Additionally, respondents who had standard toilets were 2.074 times more likely to have access to clean drinking water compared to those with non-standard toilets (OR = 2.074, 95% CI = 1.862 - 2.309). Those who lived in houses with permanent walls were 1.972 times more likely to have access to clean drinking water source compared to those in houses without permanent walls (OR = 1.972, 95% CI = 1.724 - 2.256). Those who had houses with semi-permanent and permanent floors were 3.264 times (OR = 3.264, 95% CI = 2.703 - 3.941) and 4.274 times (OR = 4.274, 95% CI = 3.626 - 5.038) more likely to have access to clean drinking water source compared to those whose houses had ground-sand floors. Furthermore, those who lived in rural areas were 3.496 times less likely to have clean drinking water than those who lived in urban areas (OR = 0.286, 95% CI = 0.259 - 0.316), while households in Papua region was 1.552 times less likely to have hygiene drinking water than those in other provinces (OR = 0.644, 95% CI = 0.516 - 0.803).
3.2.2. Determinants of the Prevalence of Diarrhea
Based on Table 2, child’s gender and age, family wealth, floor of the houses, and region are associated with the prevalence of diarrhea. A female child was 1.157 times less likely to develop diarrhea than a male child (OR = 0.864, 95% CI = 0.792 - 0.942). Four-year-old children were 1.555 times less likely to have diarrhea (OR = 0.643, 95% CI = 0.522 - 0.750) than those one-year-old children or less. Concerning family wealth, the richest family was 1.499 times less likely to experience diarrhea compared to the poorest family (OR = 0.667, 95% CI = 0.546 - 0.813). Furthermore, those who had houses with semi-permanent and permanent floor houses were 1.457 times (OR = 1.405, 95% CI 1.100 - 1.793) and 1.405 times (OR = 1.457, 95% CI = 1.119 - 1.897) more likely to have diarrhea compared to those with houses using ground-sand floors. Based on regions, households residing in Java-Bali, Nusa Tenggara, Maluku, and Papua regions had various chances from 1.168 to 1.680 times to suffer from diarrhea than those in Sumatra Region Tables 1 and 2.
3.3. Assessment of the Structural Model
Table 3 and Fig. (1) show that the five factors: wealth, residence, housing, water, and diarrhea together explained 0.117% of the variance in the housing of diarrhea (R2 = 0.117) and 29.3% of the variance of water in diarrhea (R2 = 0.293). Most pathways were significant at p < 0.05 levels. Wealth had the highest path coefficient of 0.324 and p<0.01, indicating a high variance and high effect in terms of achieving diarrhea prevalence. The contribution of the residence to housing (β = 0.035, p < 0.01) and water (β = 0.204, p < 0.01) were of positive significance. The path coefficient between water and diarrhea is negative and statistically significant at p < 0.05 (β =-0.019, p < 0.01).In addition, the influence of residence and wealth on water and diarrhea has a partial mediator effect. The indirect effect values were -0.004 and -0.004, and the t values were 2.137 and 2.594, reaching significant levels Table 3 and Fig. (1).
Table 1.
| - | Access to Drinking Water Sources | OR = 95% CI | |||||
|---|---|---|---|---|---|---|---|
| Unsafe | Safe | Total | |||||
| n | % | n | % | n | % | ||
| Child’s Gender | |||||||
| Male | 2,320 | 51.6 | 6,548 | 51.3 | 8,868 | 51.4 | Ref. |
| Female | 2,172 | 48.4 | 6,223 | 48.7 | 8,395 | 48.6 | 1.007 0.926,1.096 |
| Child’s age | - | - | - | - | - | - | - |
| 0 year | 917 | 20.4 | 2,468 | 19.3 | 3,385 | 19.6 | Ref. |
| 1 year | 899 | 20 | 2,634 | 20.6 | 3,533 | 20.5 | 1.053 0.921,1.204 |
| 2 years | 907 | 20.2 | 2,496 | 19.5 | 3,403 | 19.7 | 0.979 0.856,1.119 |
| 3 years | 879 | 19.6 | 2,570 | 20.1 | 3,449 | 20 | 1.046 0.914,1.198 |
| 4 years | 890 | 19.8 | 2,603 | 20.5 | 3,493 | 20.2 | 0.983 0.860,1.123 |
| Mother’s Education | - | - | - | - | - | - | - |
| No education | 148 | 3.2 | 97 | 0.8 | 245 | 1.4 | Ref. |
| Primary | 1,620 | 36.1 | 2,661 | 20.8 | 4,281 | 24.8 | 1.287 0.946,1.749 |
| Secondary | 2,240 | 49.9 | 7,391 | 57.9 | 9,631 | 55.8 | 1.355 0.993,1.848 |
| Higher | 484 | 10.8 | 2,622 | 20.5 | 3,106 | 18 | 1.418* 1.006,1.998 |
| Father’s Education | - | - | - | - | - | - | - |
| No education | 132 | 2.9 | 97 | 0.8 | 229 | 1.3 | Ref. |
| Primary | 1,776 | 39.5 | 3,178 | 24.9 | 4,954 | 28.7 | 1.294 0.938,1.784 |
| Secondary | 2,187 | 48.8 | 7,326 | 57.3 | 9,513 | 55.1 | 1.231 0.888,1.705 |
| Higher | 397 | 8.8 | 2,170 | 17.0 | 2,567 | 14.9 | 1.130 0.786,1.626 |
| Family Wealth | - | - | - | - | - | - | - |
| Poorest | 2,659 | 59.2 | 2,083 | 16.3 | 4,742 | 27.5 | Ref. |
| Poorer | 847 | 18.9 | 2,530 | 19.8 | 3,377 | 19.6 | 2.865** 2.549,3.219 |
| Middle | 508 | 11.3 | 2,670 | 20.9 | 3,178 | 18.4 | 4.293** 3.722,4.951 |
| Richer | 303 | 6.7 | 2,734 | 21.4 | 3,037 | 17.5 | 7.386** 6.156,8.863 |
| Richest | 175 | 3.9 | 2,754 | 21.6 | 2,929 | 17.0 | 15.070** 11.60,19.56 |
| Toilet Condition | - | - | - | - | - | - | - |
| Not standard | 605 | 13.5 | 6 | 0.1 | 611 | 3.5 | Ref. |
| Under standard | 1,197 | 26.6 | 1,164 | 9.1 | 2,361 | 13.7 | 1036.7** 440.0,2442.8 |
| Standard | 2,690 | 59.9 | 11,600 | 90.8 | 14,290 | 82.8 | 1310.7** 559.5,3070.7 |
| Wall of the Houses | - | - | - | - | - | - | - |
| Not permanent | 1,005 | 22.4 | 737 | 5.8 | 1,742 | 10.1 | Ref. |
| Permanent | 3,487 | 77.6 | 12,031 | 94.2 | 15,517 | 89.9 | 0.892 0.769,1.035 |
| Floor of the Houses | - | - | - | - | - | - | - |
| Ground-sand | 949 | 21.1 | 342 | 2.7 | 1,291 | 7.5 | Ref. |
| Semi-permanent | 1,006 | 22.4 | 1,396 | 10.9 | 2,402 | 13.9 | 0.907 0.744,1.106 |
| Permanent | 2,537 | 56.5 | 11,033 | 86.4 | 13,570 | 78.6 | 1.165 0.976,1.390 |
| Residential Areas | - | - | - | - | - | - | - |
| Urban | 841 | 18.7 | 7,652 | 59.9 | 8,493 | 49.2 | Ref. |
| Rural | 3,651 | 81.3 | 5,119 | 40.1 | 8,770 | 50.8 | 0.241** 0.217,0.268 |
| Regions | - | - | - | - | - | - | - |
| Sumatra | 1,101 | 24.5 | 3,489 | 27.3 | 4,590 | 26.6 | Ref. |
| Java Bali | 749 | 16.7 | 4,487 | 35.1 | 5,236 | 30.3 | 0.980 0.862,1.114 |
| Nusa Tenggara | 666 | 14.8 | 825 | 6.5 | 1,491 | 8.6 | 0.796** 0.683,0.928 |
| Kalimantan | 464 | 10.3 | 1,117 | 8.7 | 1,581 | 9.2 | 0.695** 0.585,0.825 |
| Sulawesi | 775 | 17.3 | 1,848 | 14.5 | 2,623 | 15.2 | 1.293** 1.129,1.481 |
| Maluku | 489 | 10.9 | 720 | 5.6 | 1,209 | 7.0 | 0.849** 0.720,1.001 |
| Papua | 248 | 5.5 | 285 | 2.3 | 533 | 3.1 | 0.678** 0.542,0.847 |
| Total | 4,492 | 100.0 | 12,771 | 100.0 | 17,263 | 100.0 | - |
| - | Diarrhea | Not Diarrhea | Total | OR = 95% CI | |||
|---|---|---|---|---|---|---|---|
| n | % | n | % | n | % | - | |
| Child’s Gender | - | - | - | - | - | - | Ref. |
| Male | 1,328 | 54.4 | 7,540 | 50.9 | 8,868 | 51.4 | 0.864** 0.792,0.942 |
| Female | 1,112 | 45.6 | 7,283 | 49.1 | 8,395 | 48.6 | - |
| Child’s Age | - | - | - | - | - | - | - |
| 0 years | 443 | 18.1 | 2,942 | 19.8 | 3,385 | 19.6 | Ref. |
| 1 year | 714 | 29.3 | 2,819 | 19.1 | 3,533 | 20.5 | 1.689** 1.483,1.923 |
| 2 years | 556 | 22.8 | 2,847 | 19.2 | 3,403 | 19.7 | 1.281** 1.119,1.468 |
| 3 years | 412 | 16.9 | 3,037 | 20.5 | 3,449 | 20.0 | 0.892 0.773,1.031 |
| 4 years | 315 | 12.9 | 3,178 | 21.4 | 3,493 | 20.2 | 0.643** 0.552,0.750 |
| Mother’s Education | - | - | - | - | - | - | - |
| No education | 39 | 1.5 | 206 | 1.4 | 245 | 1.4 | Ref. |
| Primary | 675 | 27.7 | 3,606 | 24.3 | 4,281 | 24.8 | 0.929 0.643,1.344 |
| Secondary | 1,385 | 56.8 | 8,246 | 55.6 | 9,631 | 55.8 | 0.911 0.628,1.320 |
| Higher | 341 | 14 | 2,765 | 18.7 | 3,106 | 18.0 | 0.781 0.526,1.160 |
| Father’s Education | - | - | - | - | - | - | - |
| No education | 28 | 1.2 | 201 | 1.4 | 229 | 1.3 | Ref. |
| Primary | 796 | 32.6 | 4,158 | 28.0 | 4,954 | 28.7 | 1.39 0.915,2.112 |
| Secondary | 1,345 | 55.1 | 8,168 | 55.1 | 9,513 | 55.1 | 1.306 0.856,1.992 |
| Higher | 271 | 11.1 | 2,296 | 15.5 | 2,567 | 14.9 | 1.151 0.736,1.802 |
| Family Wealth | - | - | - | - | - | - | - |
| Poorest | 766 | 31.4 | 3,976 | 26.8 | 4,742 | 27.5 | Ref. |
| Poorer | 523 | 21.4 | 2,854 | 19.3 | 3,377 | 19.6 | 0.941 0.818,1.082 |
| Middle | 452 | 18.5 | 2,726 | 18.4 | 3,178 | 18.4 | 0.881 0.753,1.032 |
| Richer | 412 | 16.9 | 2,625 | 17.7 | 3,037 | 17.5 | 0.878 0.738,1.044 |
| Richest | 287 | 11.8 | 2,642 | 17.8 | 2,929 | 17.0 | 0.665** 0.544,0.814 |
| Toilet | - | - | - | - | - | - | - |
| Not standard | 77 | 3.2 | 535 | 3.6 | 612 | 3.5 | Ref. |
| Under standard | 398 | 16.3 | 1,963 | 13.2 | 2,361 | 13.7 | 0.973 0.664,1.426 |
| Standard | 1,965 | 80.5 | 12,325 | 83.2 | 14,290 | 82.8 | 0.917 0.633,1.329 |
| Wall of the Houses | - | - | - | - | - | - | - |
| Not permanent | 258 | 10.5 | 1,488 | 10.0 | 1,746 | 10.1 | Ref. |
| Permanent | 2,182 | 89.5 | 13,335 | 90.0 | 15,517 | 89.9 | 0.985 0.877,1.106 |
| Floor of the Houses | - | - | - | - | - | - | - |
| Ground-sand | 160 | 6.6 | 1,131 | 7.7 | 1,291 | 7.5 | Ref. |
| Semi-permanent | 409 | 16.8 | 1,993 | 13.4 | 2,402 | 13.9 | 1.457** 1.119,1.897 |
| Permanent | 1,871 | 76.6 | 11,699 | 78.9 | 13,570 | 78.6 | 1.405** 1.100,1.793 |
| Drinking Water Sources | - | - | - | - | - | - | - |
| Unsafe | 690 | 28.3 | 3,802 | 25.6 | 4,492 | 26.0 | Ref. |
| Safe | 1,750 | 71.7 | 11,021 | 74.4 | 12,771 | 74.0 | 0.985 0.877,1.106 |
| Residential Areas | - | - | - | - | - | - | - |
| Urban | 1,096 | 44.9 | 7,397 | 49.9 | 8,493 | 49.2 | Ref. |
| Rural | 1,344 | 55.1 | 7,426 | 50.1 | 8,770 | 50.8 | 1.056 0.953,1.170 |
| Regions | - | - | - | - | - | - | - |
| Sumatra | 692 | 28.4 | 3,898 | 26.3 | 4,590 | 26.6 | Ref. |
| Java Bali | 659 | 27 | 4,577 | 30.9 | 5,236 | 30.3 | 0.856* 0.759,0.966 |
| Nusa Tenggara | 206 | 8.4 | 1,285 | 8.7 | 1,491 | 8.6 | 0.828* 0.693,0.990 |
| Kalimantan | 258 | 10.6 | 1,323 | 8.9 | 1,581 | 9.2 | 1.076 0.907,1.276 |
| Sulawesi | 407 | 16.7 | 2,216 | 14.9 | 2,623 | 15.2 | 0.992 0.865,1.139 |
| Maluku | 162 | 6.6 | 1,047 | 7.1 | 1,209 | 7.0 | 0.802* 0.662,0.973 |
| Papua | 56 | 2.3 | 477 | 3.2 | 533 | 3.1 | 0.595** 0.443,0.799 |
| Total | 2,440 | 100.0 | 14,823 | 100.0 | 17,263 | 100.0 | - |
| Relationship | Direct Effects | Indirect Effects | Total Effects | t-values | |
|---|---|---|---|---|---|
| From | To | ||||
| Housing | Diarrhea | -0.004 | - | - | 0.534 |
| Housing | Water & Diarrhea | - | -0.006 | -0.010 | 1.375 |
| Housing | Water | 0.320 | - | - | 40.272** |
| Residence | Healthy_Housing | 0.035 | - | - | 4.534** |
| Residence | Housing & Diarrhea | - | -0.000 | -0.004 | 2.383* |
| Residence | Water | 0.204 | - | - | 26.885** |
| Residence | Water & Diarrhea | - | -0.004 | -0.004 | 2.137* |
| Wealth | Healthy_Housing | 0.324 | - | - | 37.832** |
| Wealth | Housing & Diarrhea | - | -0.001 | -0.007 | 2.594** |
| Wealth | Water | 0.202 | - | - | 29.216** |
| Wealth | Water & Diarrhea | - | -0.004 | -0.007 | 2.594** |
| Water | Diarrhea | -0.019 | - | - | 2.321* |
4. DISCUSSION
The PLS analysis found that wealth and the residential area had a significant effect on access to clean water at the household level. Urban areas and high wealth status provide less chances for children to develop diarrhea. The results of PLS show no significant influence of wealth and residential areas through housing variables on diarrhea incidence. Instead, housing influenced water that consequently contributed to diarrhea incidence. In other words, improved bathrooms, walls, floors, and water sources are indistinguishable factors. The findings are consistent with several previous studies [6, 7, 13, 15]. Elimination of faeces safely and properly is extremely important to control the spread of diarrhea; otherwise, direct contact with human excretion causes diarrhea and other infectious diseases. Therefore, health policies on water and sanitation programs, such as cleaning child feces and unhygienic places, can be the preventive measures against the spread of diarrhea [16]. In addition, risk factors of diarrhea, specifically related to water and sanitation programs in children under five years old include water management, lack of drinking habits, inappropriate handwashing after defecation and before preparing food [15], drainage clogs around houses, breeding grounds for flies and other insects close to houses and other hygiene practices. Access to sanitation facilities is essential to create a safe and healthy environment [16]. Therefore, improving basic sanitation is a way to reduce the burden of diarrhea and diarrhea-related deaths in children under five years in Indonesia. For this reason, the government and non-governmental organizations should work together to develop a comprehensive strategy for hygiene practices in family and improve infrastructure, for example, water supplies and toilets for households. Additionally, education is important to encourage families to make positive environmental changes in their houses [18].
Research conducted in Nigeria proves that poor water management and water storage are related risk factors for diarrheal disease [19, 20]. Other researchers have also proven that the provision of water and sanitation, including the provision of clean water and poor drinking water, stagnant household sewage, places where flies live around housing, and not washing hands with soap, are factors significant predisposition to the incidence of diarrhea in children under 5 years of age [21-23]. In addition, access to clean water and the provision of sanitation facilities are also important in relation to the incidence of diarrhea in children. So that the role of society and government becomes very important in overcoming these risk factors in order to reduce the incidence of diarrhea [24].
CONCLUSION
This study found that people should care about personal health and environmental conditions. Government policies should pay more attention to the less fortunate and those living in rural areas. In addition, it is necessary to develop community empowerment efforts to care for diseases that often attack children, such as diarrhea. This community-based empowerment is expected to help synergize with programs from the government and non-governmental organizations. Thus the community will be able to be independent in their concern for the health of their homes and the surrounding environment. In the long term, it is hoped that this community empowerment effort can reduce the morbidity and mortality of infectious diseases, especially those related to diarrhea.
LIST OF ABBREVIATIONS
| IDHS | = Indonesia Demography and Health Survey |
| PLS-SEM | = Partial Least Square-Structural Equation Modeling |
AUTHORS' CONTRIBUTIONS
Conceptualization, visualization, writing–original draft, writing–review & editing: IS
Formal analysis, funding acquisition, methodology, project administration: FA.
ETHICS APPROVAL AND CONSENT TO PARTICIPATE
This study was approved for ethical clearance by the Institutional Review Board of the Faculty of Public Health, Diponegoro University (Decision No. 82/EA/KEPK-FKM/20212, dated on 22/03/2021).
HUMAN AND ANIMAL RIGHTS
No animals were used in this research. All procedures performed in studies involving human participants were in accordance with the ethical standards of institutional and/or research committee and with the 1975 Declaration of Helsinki, as revised in 2013.
CONSENT FOR PUBLICATION
Informed consent was obtained from all the participants and guardians.
AVAILABILITY OF DATA AND MATERIAL
The data supporting the findings of the article is available in the The data of Indonesia - National Demographic and Health Data at https://data.humdata.org/dataset/dhs -data-for-indonesia.
STANDARDS OF REPORTING
STROBE guidelines were followed in this study.
FUNDING
This study was funded by th Faculty of Public Health, Diponegoro University, Indonesia (Grant # 053/UN75.92/KS/2021).
CONFLICT OF INTEREST
The authors have no conflicts of interest to declare for this study.
ACKNOWLEDGEMENTS
The authors would like to thank Indonesia's Demographic and Health Survey for granting permission to use data.

