All published articles of this journal are available on ScienceDirect.

Sex-disaggregated Analysis of Risk Factors of COVID-19 Mortality Rates in India
Abstract
Background:
COVID-19 mortality rates vary widely across regions and sex/gender. Understanding the reasons behind such variation could help in developing suitable management strategies.
Methods:
This paper presents a comprehensive analysis of incidence and mortality rates on 2,331,363 cases and 46,239 deaths over a cumulative period of approximately 6.5 months from February to August 2020 across 411 districts of India in the age group 15-49. Together with health data from government surveys, we identify risk and protective factors across regions, socio-economic status, literacy, and sex. To obtain common indicators, we apply both machine learning techniques and statistical tests on different health factors. We also identify positive and negative correlates at multiple population scales by dividing the cohort into sub-cohorts formed from two Indian states that were further segregated by sex.
Results:
We show that males and females differ in their risk factors for mortality. While obesity (lasso regression coefficient: KA=0.5083, TN=0.318) is the highest risk factor for males, anemia (KA=0.3048, TN=0.046) is the highest risk factor for females. Further, anemia (KA=-0.0958, TN=-0.2104) is a protective factor for males, while obesity (KA=-0.0223, TN=-0.3081) is a protective factor for females.
Conclusion:
Districts with a high prevalence of obesity pose a significantly greater risk of severe COVID-19 outcomes in males. On the other hand, in females, the prevalence of anemia in districts is notably associated with a higher risk of severe COVID-19 outcomes. It is important to consider sex-wise heterogeneity in health factors for better management of health resources.
1. INTRODUCTION
The coronavirus disease (COVID-19) has been the subject of intense study since its outbreak in December 2019. Incidence and mortality rates of the disease have varied widely, both across regions and periods. Understanding the underlying risks, especially of mortality due to the disease could help in developing better management strategies at the population and individual levels. The rapid spread of the disease and the increased stress on the healthcare system, hospitals, and health workers have precluded the gathering of detailed statistics of affected individuals. Hence, there is a need to study the risk factors of COVID-19-related mortality from aggregated data at population levels.
Population risk factors for COVID-19 have so far been studied from small cohorts or case studies under hospitalization conditions or isolation centers where parameters can be collected and monitored in a controlled environment [1-4]. Prior studies on risk factors associated with COVID-19 have considered the impact on mortality rates of a single risk factor such as obesity [5-8] or nutrition [9, 10]. COVID-19 mortality rates show heterogeneity among racial groups [11], age [12], sex [13], and socio-economic status [14]. However, some of these studies conducted at the country level [15] conflict with conclusions arrived at from a single state [11] within the same population. Hence, it is important to ensure that conclusions about risk factors hold across multiple scales of the population, such as sub-cohorts.
Due to India’s large and diverse population, it has been the center for several prediction and containment strategies related to COVID-19. According to data from the Indian Ministry of Health and Family Welfare, as of March 2023, the number of confirmed COVID-19 cases in India has reached 44,694,349, with a reported death toll of 5,30,799. India has been one of the few countries which had enforced early lockdowns and large-scale restrictions. Given the geographic spread and the number of affected individuals, this is one of the largest exercises in the world, impacting the most number of people. Hence, it is important to understand the risk factors underlying mortality from COVID-19, especially in vulnerable populations, which can help plan the effective distribution of healthcare resources.
The influence of sex as a risk factor has been an active field in the study of COVID-19 mortality rates. Studies [16, 17] show that sex-related differences in COVID-19 mortality differ by age. Further, the global trend of higher male mortality does not hold in some countries like India, Nepal, Vietnam, and Slovenia. Differences in severity but not in mortality have been reported in one study [18]. Possible biological underpinnings of the higher risk of mortality in males in the form of ACE2 receptor has been studied [19]. However, this does not explain the reason why female mortality rates are higher in some regions. Hence, there is a need to consider several variables simultaneously and their effects on mortality rates. In a first sex-disaggregated study of risk factors, Nakeshbandi et al. [20] showed with data collected from hospitalized patients over a month that obesity is associated with higher mortality in males but not in females. This points to possibly different risk factors for males and females, as also reported in studies of other diseases such as Coronary Artery Disease and Influenza [21, 22]. Along with risk factors, it is also necessary to study the protective factors which could influence outcomes for COVID-19 patients. In India, maternal and child health is an area of concern. The government has focused efforts on monitoring and providing interventions for children and women in the age group of 15-49. Thus, the risk and protective factors of COVID-19-related mortality rates of males and females in this age group are of special interest.
In this study, we analyze the mortality rates of males and females in the reproductive age group of 15-49 on a total data of 2,350,000 individuals spanning 411 districts across 23 states and 3 union territories, at multiple levels of population aggregation. We show that differences in mortality in various subregions of India persist despite adjusting for socio-economic factors and literacy. We derive sex-disaggregated positive and negative correlates (corresponding to the risk and protective factors) and show that these factors are robust across multiple levels of the population. Our results show that while obesity is a risk factor for males, it is a protective factor for females in the pre-menopausal age. Further, anemia is a risk factor for females, while being a protective factor for males in the same age bracket of 15-49. We also present possible causes for such a sex/gender difference from literature.
2. MATERIALS AND METHODS
The data processing pipeline for this study consists of the collection, cleaning, and analysis. Data extraction from multiple sources constituted a significant portion of the effort. The scikit-learn [23] and SciPy [24] libraries in Python were used for the analysis.
2.1. Data Sources
Data related to the incidence and mortality of COVID-19 was collected from multiple sources since no single published source of such data is available. The data collected from the period of January 30, 2020, to August 18, 2020, include those put out by government agencies, crowd-sourced data, and daily media bulletins. Sex-disaggregated data related to COVID-19 incidence and mortality is not published by the Ministry of Health and Family Welfare, Government of India. However, some state governments issue official daily bulletins through formal releases to the media. Data from these media bulletins were extracted for the period April 15 to August 18, 2020, for the state of Karnataka and for the period May 1 to August 18, 2020, for the state of Tamil Nadu. A sample data of such a bulletin can be found in [25, 26]. The sources from which data for this study was sourced include:
- The Open Government Data Platform India website [27] with nation-wide data of 16,981 cases and 683 deaths and serial follow-up of people who tested positive for a few selected cities [28-33].
- COVID-19-India [34], a crowd-sourced initiative, containing data from 800 districts regarding confirmed, active, recovered, and deceased cases, along with the details of tests for 22 states.
- Media bulletins issued by the states of Karnataka and Tamil Nadu: For Karnataka, 71,068(44,836 Male, 26,223 Female) cases curated by Siva Athreya et al. [35], and district-wise numbers for 3763(2518 Male, 1176 Female) deaths collected by manually going through the official media bulletins. For Tamil Nadu, 20,731(12,961 Male, 7762 Female) positive cases and 5161(3713 Male, 1448 Female) deaths were extracted. From these, data related to the age group 15-49 were extracted, resulting in 47,217(30,016 Male, 17,196 Female) cases, 756(511 Male, 245 Female) deaths from Karnataka, and 14,174(9,026 Male, 5,142 Female) cases, 765(521 Male, 244 Female) deaths from Tamil Nadu. Sex information for positive cases available until the 31st of May, 2020 for Tamil Nadu and the 20th of July, 2020 for Karnataka media bulletins were considered. Thereafter, only total infected cases related to COVID-19 cases were published, and sex-disaggregated data was not available.
- National Family Health Survey (NFHS) Data: The NFHS is a large-scale, multi-round survey conducted in a representative sample of households throughout India. Sex/gender-disaggregated data of both men and women in the age group 15-49 has been collected periodically by NFHS [36] on several health parameters. Last conducted in 2014-2015, the survey involved a sample size of approximately 568,200 households and a total sample of 625,014 women and 93,065 men eligible for the interview. The data [37] spans across 29 states and 6 union territories, a total of 640 districts across India. For each of these districts, 93 key indicators are recorded ranging from various issues during pregnancy, nutrition, population, literacy, and more.
2.2. Data Curation
Details of total confirmed cases (which included the number of active, recovered, and deceased cases) and the number of deaths were available for 800 districts. Of these, 535 districts overlapped with the 640 districts for which NFHS data was available. We considered the subset of these districts that had at least 5 deaths, resulting in a total of 411 districts, spanning 23 states and 3 union territories of India on which the final analysis was done. This encompasses roughly 72% of India’s 28 states and 8 union territories’ total geographical area. These 411 districts represent a geographical extent of more than 3 million square kilometers and a cumulative total of 2,331,363 cases and 46,239 deaths.
In the sub-cohort of the states of Karnataka and Tamil Nadu, sex-disaggregated numbers of COVID-19-positive cases were available only until the 20th of July and 31st of May, 2020 respectively. Thereafter, only total positive cases related to COVID-19 were published. However, sex-disaggregated data on mortality was available. The sex distribution of positive cases in the age group of 15-49 was estimated by extrapolating linearly from the initial data.
Among the 93 key indicators included in the NFHS data, we selected the ones corresponding to adult health indicators and further limited them to factors discussed in case reports and medical opinions in literature. We also took into account chronic conditions that are unlikely to have changed in the period between the collection of the health data and the COVID-19 pandemic. The broad categories of factors considered were those related to low BMI (Body mass index), obesity, anemia, blood pressure, and diabetes. The set of health factors chosen for analysis are
- Men whose Body Mass Index (BMI) is below normal (%) (BMI < 18.5 kg/m 2 )
- Women whose Body Mass Index (BMI) is below normal (%) (BMI < 18.5 kg/m 2 )
- Men who are overweight or obese (%) (BMI ≥ 25.0 kg/m2)
- Women who are overweight or obese (%) (BMI ≥ 25.0 kg/m2)
- Men who are anemic (%) (<13.0 g/dl)
- Women who are anemic (%) (<12.0 g/dl(Nonpregnant) and <11.0 g/dl(Pregnant))
- Men who have a high blood sugar level (%) (>140 mg/dl)
- Women who have a high blood sugar level (%) (>140 mg/dl)
- Men who have very high blood pressure (%) (Systolic ≥180 mm of Hg and/or Diastolic ≥110 mm of Hg)
- Women who have very high blood pressure (%) (Systolic ≥ 180 mm of Hg and/or Diastolic ≥ 110 mm of Hg).
On the all-India cohort, health indices for the sex-aggregated data were computed by weighting the sex-disaggregated health indices by the population sex ratio.
2.3. Analysis
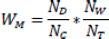
Lasso regression [38] is a linear regression method that employs regularization to improve model prediction accuracy and avoid overfitting. The method involves adding a penalty term to the loss function that encourages the model to have fewer non-zero coefficients, thus providing a feature selection mechanism. A crucial aspect of lasso regression is the hyperparameter lambda (λ), which controls the strength of regularization. Higher values of lambda result in stronger regularization, smaller coefficients, and better generalization performance on new data. A lasso regression of the health factors on mortality rates calculated from the COVID19-India data was conducted on districts that reported at least 5 deaths. The health data was standardized before the regression. For each lasso test, the λ (regularization parameter) with the best R2 value was selected through a search of the results from the lasso_path function in the scikit-learn library. Residual plots corresponding to this value of λ were inspected visually to ensure there was no bias. The effect of differing testing rates across various states was accounted for by using weighted mortality defined as follows:
 |
(1) |
where W M = Weighted Mortality
N D = Number of Deaths
N C = Number of Cases
N W = Population
N T = Number of Tests conducted
This is derived from the observations [39, 40] that the mortality rate is inversely proportional to the testing rates. Testing rates are usually indicative of government focus on tracking, tracing, and treating COVID-19 patients, and a higher testing rate results in lower mortality. Hence, in states with a lower testing rate, a number of COVID-related deaths would potentially have gone unnoticed. The number of tests conducted is available at the aggregated state level, and not for districts. District-wise population counts from census data [41] were used to compute the state-wise weighted mortality. A separate analysis of the data from 22 states was conducted, and the impact of including testing rates on the mortality rates was studied.
A sex-disaggregated analysis was carried out on the curated data at the sub-cohort level of 2 states and 6 cities. In order to rule out the possibility of other factors such as literacy and socio-economic status influencing the results, an intersectional analysis was performed. The following features were taken into consideration to arrive at a socio-economic index:
- Households with electricity (%)
- Households with an improved drinking-water source (%)
- Households using improved sanitation facility (%)
- Households using clean fuel for cooking (%)
- Households using iodized salt (%)
- Households with any usual member covered by a health scheme or health insurance (%)
These factors were chosen by inspection and subsequently analyzed using a Random Forest feature selector [42], ordered by the Gini index. All factors are found to have comparable importance, and hence, were retained for the computation of the socio-economic index. A weighted average of the selected features was used as an indicator of socio-economic status, where the weights were obtained from impurity-based feature importance scores from the Random Forest classifier. The median values of the socio-economic index, literacy, and overall mortality rates were used to divide the districts into the categories of high/low indices. The districts were also divided into two categories based on whether the male mortality rate was higher than the female mortality rate, or vice-versa (Fig. 1). The intersectional analysis was carried out on the sub-cohort of data for which sex attributes were recorded. The influencing factors obtained, with and without the intersection were compared to check the effect of attributes other than sex.
Independently, factors that differed significantly between the districts with high mortality rates and those with low mortality rates were identified via the Mann-Whitney U test with a significance level of 0.05 corrected by the Bonferroni criterion for each health factor. The effect size was also calculated for all the factors between the two sub-groups using Cohen’s d effect size and interpreted according to the thresholds defined in [43] i.e., |d|≤0.2 is a ‘negligible’ effect size, 0.2<|d|≤0.5 is ‘small’, 0.5<|d|≤0.8 is ‘medium’ and otherwise ‘large’. The factors obtained from the Mann-Whitney U test and the lasso test at the country level were compared and common factors were identified as the risk and protective factors of the population. Two sub-cohorts of Karnataka and Tamil Nadu were analyzed independently and positive and negative correlates were identified for the aggregate population as well as for each sex. The corresponding sex-disaggregated factors from the Mann-Whitney U test were obtained by combining the data across the two states to ensure significant numbers.
3. RESULTS
A preliminary two-tailed test performed on the Open Government Data, results of which are presented in Table 1, shows that there is a significant difference between male and female mortality rates in some regions while other regions do not show a significant difference. Further, although the female mortality rate is higher than the male mortality rate in many regions, it is not possible to infer that this is uniformly true for all regions.
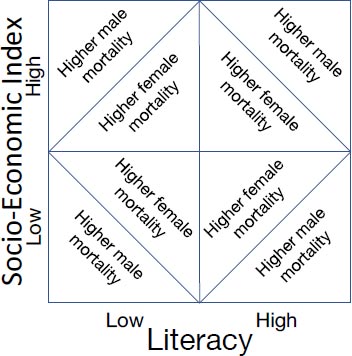
Table 1.
| Region | Difference in Mortality Rates (%) | 95% CI | P Value |
|---|---|---|---|
| Surat | 0.8613 | (-0.0837,1.8063) | 0.362 |
| Thane | -0.8337 | (-1.2795, -0.3880) | 0.0614 |
| Jabalpur | 3.6054 | (1.5874,5.6234) | 0.074 |
| Rajkot | 2.5332 | (0.6437,4.4227) | 0.18 |
| Indore | -1.6341 | (-2.1142,-1.1540) | < 0.001 |
| Varanasi | 1.0449 | (-0.2144,2.3041) | 0.4067 |
| Karnataka | -0.3217 | (-0.3737,-0.2698) | < 0.001 |
| Tamil Nadu | -0.5387 | (-0.5849,-0.4924) | < 0.001 |
| Quadrant | Female Mortality Higher | Male Mortality Higher |
|---|---|---|
| Low Social Index, Low Literacy Rate | Gulbarga (0.43%-0.46%) | Bellary (0.33%-0.25%) |
| Raichur (0.37%-0.43%) | Davanagere (0.72%-0.43%) | |
| Koppal (0.44%-0.68%) | Virudhunagar (0.27%-0.25%) | |
| Tumkur (0.54%-0.87%) | Belgaum (0.71%-0.26%) | |
| Chikkaballapura (0.41%-0.77%) | Haveri (0.75%-0.74%) | |
| Jabalpur (2.4%-6%) | Tiruvannamalai (0.49%-0.26%) | |
| Varanasi (2.7%-3.8%) | - | |
| Low Social Index, High Literacy Rate | Shimoga (0.38%-0.45%) | Tirunelveli (0.32%-0.22%) |
| Thoothukkudi (0.16%-0.18%) | Thane (3.7%-2.9%) | |
| - | Bidar (0.74%-0.6%) | |
| High Social Index, Low Literacy Rate | Salem (0.19%-0.58%) | Mysore (0.75%-0.67%) |
| - | Dharwad (0.64%-0.61%) | |
| - | Hassan (0.93%-0.76%) | |
| - | Theni (0.23%-0.2%) | |
| High Social Index, High Literacy Rate | Kancheepuram (0.29%-0.34%) | Bangalore (0.5%-0.44%) |
| Thiruvallur (0.37%-0.44%) | Dakshina Kannada (0.79%-0.51%) | |
| Vellore (0.22%-0.35%) | Chennai (0.36%-0.25%) | |
| Rajkot (2.7%-5.2%) | Coimbatore (0.66%-0.13%) | |
| Surat (7.1%-8%) | Kanniyakumari (0.36%-0.23%) | |
| - | Madurai (0.52%-0.5%) | |
| - | Indore (3.2%-1.6%) |
To verify the role of sex/gender in this disparity, an intersectional analysis was conducted using additional factors of literacy and socio-economic index (Table 2). Sex-disaggregated mortality rates of 35 districts with at least 5 male deaths and 5 female deaths were considered. Districts with a higher socio-economic index had a higher proportion (65%) of regions of male mortality. However, the difference is statistically significant only in 3 districts. Among districts with a low socio-economic index, the regions with higher male mortality and those with higher female mortality are comparable, with only one district showing a significant difference. The difference in mortality rates of men/males and women/females is not so marked amongst regions of high/low literacy, with 59% of districts with high literacy having higher male mortality and 56% of districts with low literacy having higher male mortality. The districts which show significant differences are also very few (4/35 and 1/35). Hence, there are a large number of regions where the difference in mortality rates cannot be explained by socio-economic factors or literacy. Moreover, the differing rates of mortality between men/males and women/females even in the same category of high socio-economic index indicate that the risk factors for males and females are different. The following sections analyze the effect of various other parameters on mortality rates in males and females.
3.1. Aggregated Population Across the Country
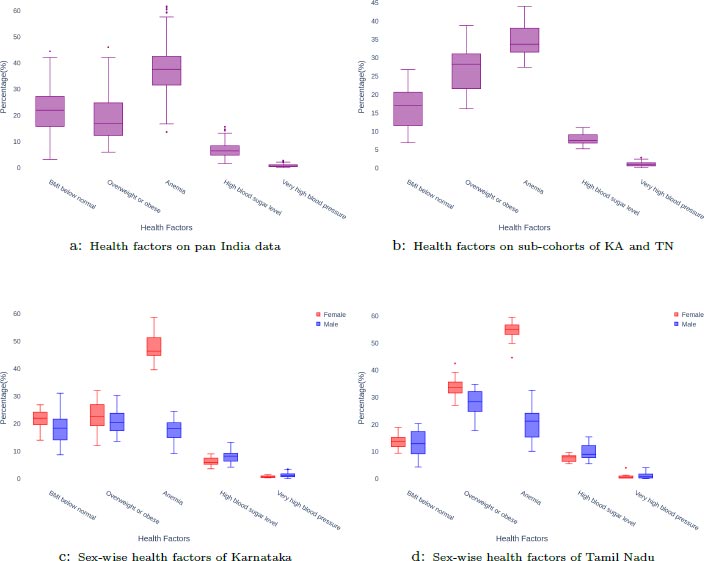
The distribution of the aggregated health factors in the 411 districts is presented in Fig. (2). District-wise counts of 2,331,363 COVID-19 cases and 46,239 deaths are used to draw correlations between the health factors and mortality from these districts.
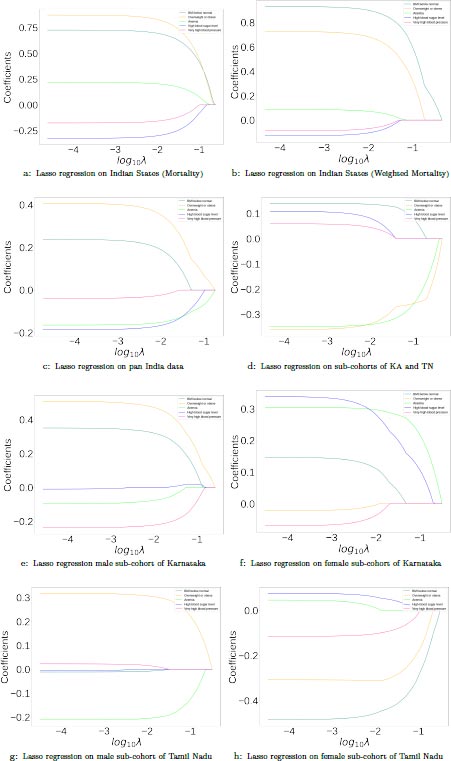
The lasso plot on this data (Fig. 3) indicates that the most positive correlates are obesity and BMI below normal. Anemia, high blood sugar level, and very high blood pressure show a negative correlation with mortality, with anemia having the highest negative correlation at higher values of λ.
In order to check for the possible confounding effect of varying testing rates, an analysis was carried out at the state level. Data comprising 1741242 COVID-19 cases, 16758697 tests, and 40420 deaths from 22 states are used to draw correlations between health factors and mortality rates, and the results are compared with the ones obtained without adjusting for testing rates. Testing rates were accounted for by weighting mortality rates according to the formula in (1). The results of the lasso regression with adjustment and without adjustment for testing rates in Fig. (3) shows that there are no changes in factors of positive and negative correlations, with the only difference being in the relative weights of the factors. It is seen that in both cases, obesity and BMI below normal were highly positively correlated with mortality rates. Anemia was moderately positively correlated with mortality rates in both cases. Similarly, very high blood pressure and high blood sugar were negatively correlated with mortality rates. This indicates that the testing rate is fairly uniform across the states of India and that confounding effects due to varying testing rates are negligible.
The results of the Mann-Whitney U test on the same data between the two categories of districts with high/low mortality rates are shown in Table 3. Anemia and obesity emerged as statistically significant with small effect sizes.
| Mann-Whitney U Test on Aggregated Health Parameters across India. | - | |||
|---|---|---|---|---|
| Aggregated Factor (%) | Difference in Median | 95% CI | P Value | Effect Size |
| Body Mass Index (BMI) below normal | 1.9 | (0.4, 3.4) | 0.0675 | 0.1221 |
| Overweight or obese | -3.2 | (-4.8, -1.7) | <0.0001 | 0.2026 |
| Anemia | 4.0 | (2.3, 5.6) | <0.0001 | 0.2306 |
| High blood sugar level | 0.2 | (-0.2, 0.7) | 1.0 | 0.0472 |
| Very high blood pressure | -0.03 | (-0.1, 0.05) | 1.0 | 0.0299 |
| Mann-Whitney U test on aggregated health parameters across Karnataka and Tamil Nadu. | - | |||
| Aggregated Factor (%) | Difference in Median | 95% CI | P Value | Effect size |
| Body Mass Index (BMI) below normal | -6.4 | (-9.9, -2.4) | 0.013 | 0.5836 |
| Overweight or obese | 7.4 | (2.7, 11.6) | 0.013 | 0.5836 |
| Anemia | 5.4 | (1.8, 8.8) | 0.02 | 0.5570 |
| High blood sugar level | 0.6 | (-0.6, 1.8) | 1.0 | 0.1415 |
| Very high blood pressure | 0.08 | (-0.4, 0.5) | 1.0 | 0.0530 |
| Mann-Whitney U test on female health parameters across Karnataka and Tamil Nadu. | - | |||
| Aggregated Factor (%) | Difference in Median | 95% CI | P Value | Effect size |
| Body Mass Index (BMI) below normal | -4.1 | (-8.1, 0.2) | 0.2975 | 0.3670 |
| Overweight or obese | 6.05 | (0.2, 11.5) | 0.163 | 0.4156 |
| Anemia | 4.3 | (0.3, 8.5) | 0.2275 | 0.3891 |
| High blood sugar level | 0.45 | (-0.8, 2.0) | 1.0 | 0.1503 |
| Very high blood pressure | 0.0 | (-0.4, 0.3) | 1.0 | 0.0354 |
| Mann-Whitney U test on male health parameters across Karnataka and Tamil Nadu. | - | |||
| Body Mass Index (BMI) below normal | -1.45 | (-5.5, 2.7) | 1.0 | 0.1271 |
| Overweight or obese | 1.0 | (-3.4, 4.3) | 1.0 | 0.0913 |
| Anemia | 2.4 | (-1.0, 5.6) | 0.6495 | 0.2327 |
| High blood sugar level | -0.35 | (-1.9, 1.4) | 1.0 | 0.0501 |
| Very high blood pressure | 0.2 | (-0.4, 0.8) | 1.0 | 0.1020 |
By taking into account the factors identified by both the tests, it is seen that obesity (DM=-3.2, 95%CI (-4.8,-1.7), P<0.0001, ES=0.2026) is positively correlated and anemia (DM=4.00, 95%CI (2.3,5.6), P<0.0001, ES=0.2306) is negatively correlated with a high mortality on the cohort of the nation-wide population.
3.2. Sub-cohort of Two Indian States
A sub-cohort of 29 districts, consisting of 16 districts from the state of Karnataka and 13 districts from the state of Tamil Nadu was analyzed. Only those districts that had reported at least 5 deaths for each sex in the age group 15-49 were considered for this analysis. This resulted in a total of 667 deaths in Karnataka and 556 deaths in Tamil Nadu. The distribution of the aggregated health factors in these districts can be seen in Fig. (2). From the lasso test in Fig. (3), BMI below normal, high blood sugar level, and very high blood pressure are the positive correlates while obesity and anemia are the negative correlates. The results of the Mann-Whitney U test on the same data between the two categories of districts with high and low values of mortality rates are shown in Table 3. Obesity, BMI below normal, and anemia were found to be statistically significant with medium effect sizes. By considering the factors that were identified by both the tests, it is seen that BMI below normal (DM=-6.4, 95%CI (9.9,-2.4), P=0.013, ES=0.5836) is positively correlated while Obesity (DM=7.4, 95%CI (2.7,11.6), P=0.013, ES=0.5836) and Anemia (DM=5.4, 95%CI (1.8,8.8), P=0.02, ES=0.5570) are negatively correlated with high mortality in the sub-cohort.
3.3. Sex-disaggregated Analysis of the Sub-cohort
A sex-disaggregated analysis was performed on the districts of Karnataka and Tamil Nadu to determine the association between sex-disaggregated mortality and health factors from these two states. The sex-disaggregated data were estimated for 240,912 cases from Karnataka and 298,046 cases from Tamil Nadu using the initial case data. From the data on deaths in Karnataka and Tamil Nadu, we considered only districts with at least 5 deaths separately for each sex. Karnataka had 224 female deaths across 16 districts and 496 male deaths across 23 districts. Tamil Nadu had 186 female deaths across 13 districts and 434 male deaths across 21 districts.
The distribution of the health factors between men/males and women/females across districts of Karnataka and Tamil Nadu is presented in Fig. (2). The results of the sex-disaggregated lasso tests on Karnataka and Tamil Nadu can be seen in Fig. (3). In the case of men/males, overweight or obesity is positively correlated and anemia is negatively correlated with a high mortality rate in both the states. In the case of women/females, anemia and high blood sugar level show a positive correlation while obesity shows a strong negative correlation, and very high blood pressure shows a weak negative correlation. The slope from the linear fit of scatter plots was examined for each factor separately in order to ascertain that the correlations were not due to multi-collinearity effects.
The Mann-Whitney U test was performed by combining the data of both states to improve the sample size. 44 districts for males and 29 districts for females were considered for analysis based on the condition that the number of deaths for the sex under consideration was at least 5. From the results presented in Table 3, none of the factors showed statistical significance. However, the factors of BMI below normal, obesity and anemia for females and anemia for males had non-negligible effect sizes.
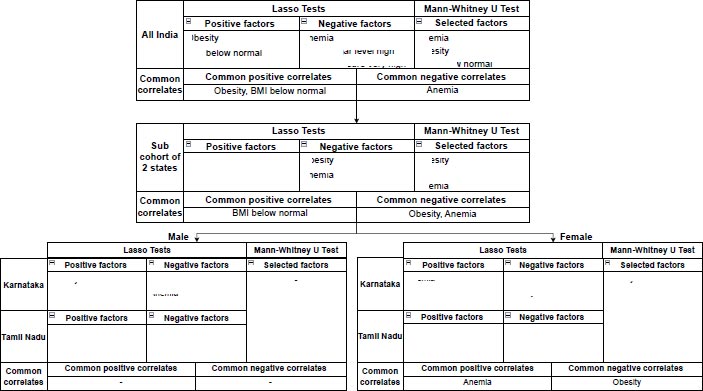
The factors identified by each test and the common factors at each level of population aggregation are shown in Fig. (4). By considering the factors that were identified by both the tests, it is seen that Anemia (DM=4.3, 95%CI (0.3,8.5), P=0.2275, ES=0.3891) is positively correlated and Obesity (DM=6.05, 95%CI (0.2,11.5), P=0.163, ES=0.4156) is negatively correlated with high mortality in females. Conversely, Anemia (DM=2.4, 95%CI (-1.0,5.6), P=0.6495, ES=0.2327) is negatively correlated with high mortality in males.
4. DISCUSSION
In this paper, we have reported a large-scale study of risk and protective factors for COVID-19 mortality rates in India in the reproductive age group of 15-49. The factors affecting mortality rates show a distinct difference among men/males and women/females. Among men/males, obesity has been shown to be a risk factor, whereas it is seen to be a protective factor for premenopausal women. Other studies investigating obesity have also concluded that there is a difference in the impact of obesity on COVID-19 mortality in men/males and women/females [20]. Further, obesity in the premenopausal stage has been shown to be a protective factor in other conditions such as breast cancer as well [44, 45]. Wang et al. [46] have shown that significant sex/gender differences are not seen in COVID-19-related mortality for postmenopausal women. The differences in the effect of obesity in pre and postmenopausal women could arise out of differences in fat distribution [47-49] in the two conditions.
The effect of decreased ACE2 expression in postmenopausal women due to a decrease in estrogen does not seem to play a significant role in mortality, in line with the observation [50] that menopausal status in itself is not a risk factor for COVID-19 mortality. Hence, the differences in the effect of obesity on mortality rates between males and females in the premenopausal age group could arise from differences in patterns of obesity.
This study also shows that anemia is positively correlated with COVID-19-related mortality in females, but negatively correlated with mortality in males. The reasons for this could be due to differences in both prevalences as well as the severity of anemia among men and women. It is evident from the sex-wise distribution in Fig. (2) that anemia is twice as prevalent in women than in men. Other studies of iron-deficiency anemia (IDA) in the Indian population [51] also confirm this, showing that 52% of women aged 15-49 are anemic.
The NFHS data used in this study does not distinguish between mild, moderate, and severe anemia. However, other studies on the prevalence and severity of anemia in the Indian population [52] show that gender-related differences were seen post-menarche, and could possibly be caused by iron deficiency. Didzun et al. [53] showed that 21∙7% (20∙9–22∙5) of men with any degree of anemia had moderate or severe anemia compared with 53∙2% (52∙9–53∙5) of women with any anemia.
Severe anemia has been associated with higher maternal mortality [54], and also with higher rates of ICU admission in COVID-19 [55-57]. This study of the effect of anemia on COVID-19 suggests that hemodilution could play a role in COVID-19 mortality.
CONCLUSION
The findings indicate that risk factors for COVID-19 mortality are by themselves heterogeneous, and their effects need to be investigated in conjunction with sex, menopausal status, and severity of underlying conditions, to understand them better. Our findings suggest that obesity has a protective effect on pre-menopausal women, but further research is needed to explore the differences between pre-menopausal and post-menopausal women, as well as the impact on varying degrees of obesity. It would be interesting to see if there are differences in risk factors between pre-menopausal and post-menopausal women since post-menopausal fat distribution is more similar to male fat distribution [58, 59] and could thus mimic male mortality in the post-menopausal regime. During the early stages of the COVID-19 pandemic, there was a substantial amount of detailed information released to the public, but this flow of information gradually decreased over time. Therefore, it is important to note that this study only relates to the first wave of COVID-19 in India, and further data is needed to fully comprehend the pandemic's impact. In addition, since this is a population-based study, individual risk prediction has not been explored. Further research is needed to better understand the risk factors for COVID-19 mortality in the Indian population and to develop strategies to mitigate these risks.
AUTHOR'S CONTRIBUTIONS
Anush V Kini, Harish P B: Extracting data from media reports, cleaning data and correlating with National Family Health Survey data, data cleaning, filtering, implementation of machine learning and statistical tests, correlation studies, and tabulation of results for the state of Karnataka and Tamil Nadu.
Monica Anand: Statistical test selection and validity checking.
Uma Ranjan: Formulation of the research problem, validation of results against clinical intuition, and manuscript preparation.
LIST OF ABBREVIATIONS
| NFHS | = National Family Health Survey |
| IDA | = Iron-deficiency Anemia |
| BMI | = Body Mass Index |
ETHICS APPROVAL AND CONSENT TO PARTICIPATE
Not applicable.
HUMAN AND ANIMAL RIGHTS
No humans or animals were used for the studies that are the basis of this research.
STANDARDS OF REPORTING
STROBE guidelines were followed.
CONSENT FOR PUBLICATION
Not applicable.
AVAILABILITY OF DATA AND MATERIALS
The data supporting the findings of the article is available in Zenodo at https://doi.org/10.5281/zenodo.7934409 reference number 10.5281/zenodo.7934410.
FUNDING
None.
CONFLICT OF INTEREST
The authors declare no conflict of interest, financial or otherwise.
ACKNOWLEDGEMENTS
Declared none.

