All published articles of this journal are available on ScienceDirect.

Investigating the Share of Covid-19 Patients from Treatment Direct Costs
Authors Info & Affiliations
Abstract
Background:
A part of the household income in all countries is allocated to health-related expenses.
Objective:
This study was conducted to estimate out-of-pocket payments for hospitalized patients with COVID-19 in southern Iran.
Methods:
The present descriptive-analytical study was conducted cross-sectionally in 2022. To this end, the financial records of 450 patients with COVID-19 hospitalized in hospitals affiliated with Jiroft University of Medical Sciences were collected. The study settings included six hospitals selected and analyzed using stratified random sampling. The data were collected through a researcher-made checklist and analyzed using t-test, ANOVA, and Pearson's correlation coefficient using SPSS23 software at the significance level of 0.05.
Results:
The total direct costs were estimated at 25,208,899,708 Rials Iran (600,211.89 $US), of which 9.37% was the patient's share (2,361,227,375 Rials Iran; 56,219.70 $US). Among the types of services, pharmaceutical services with 50.23% of the patients' share (1,186,031,713 Rials Iran; 28,238.85 $US) accounted for the highest cost of out-of-pocket payments. The length of stay and the type of insurance coverage had a statistically significant relationship with direct payment from patients' pockets (P < 0.05).
Conclusion:
Based on the findings, 9.37% of the total direct costs of hospitalized patients with COVID-19 were out-of-pocket. The results of this study confirm the necessity of making decisions about and taking effective measures to reduce the financial pressure of the disease on the patients and their families.
1. INTRODUCTION
The Corona Virus Disease (COVID-19), an acute respiratory infection, had broken out in China at the end of 2019 and made health systems face many challenges [1]. The economic challenge, as one of the main problems caused by the disease prevalence, imposed a huge financial burden on the health systems of different countries [2]. In this regard, a study in China reported that the total health and social costs of COVID-19 were reported as 0.62 and 383.02 billion US dollars, respectively [3]. Another study in the United States estimated that the average hospital cost of 173,942 patients with COVID-19 was 12,046 US dollars [4].
In addition, COVID-19 affected households socio-economically [5] by creating important concerns regarding the epidemy’s impact on the households' economies. As a result, the process of providing health services to patients was disrupted [6]. Moreover, lack of economic access to the needed services during the COVID-19 pandemic may have irreparable consequences [4]. One of the issues that may affect the economic access of households to the necessary health services during this pandemic is attributed to the ways of providing financial resources for these services [7].
One of the methods of financing the health sector is direct out-of-pocket payments (OOP) [8], which refers to the medical OOP by the household at the place of service [9]. This payment is an inefficient way of financing health care, which can have negative impacts on service equality and lead vulnerable groups to poverty [10]. The provision of financial resources based on OOP is often a downward trend in paying for health services causing many people to experience back-breaking costs [11]. According to the report of the World Health Organization, approximately 150 million people around the world suffer from high expenses due to OOP, and about 100 million are pushed below the poverty line consequently [12]. Some studies represented that these high costs had occurred mainly in households using inpatient services, especially in hospitals [13, 14].
In developing countries with high OOP rates, a lack of appropriate risk pooling mechanisms in health financing systems and high levels of poverty can impose high costs on health and affect household living standards [15]. In addition, lack of or poor insurance coverage and insufficient social support have led households to pay directly OOP in such countries [16]. Several studies have confirmed the negative consequences of a high share of OOP in overall health financing in developing countries [17, 18]. Therefore, spending a large part of household resources to receive health services can threaten living standards in the short and long terms. In the short term, households may be forced to forego the current consumption of other goods and services while in the long term, they may be obliged to sell and auction their assets, consume up their savings, or accumulate debt [19].
In addition to the above-mentioned problems, OOP occurs in health sectors inhibiting the poor’s access to services, increasing inequality in service use, and incrementing people's reluctance or delay in taking advantage of health services. This phenomenon highlights the need for more attention from decision-making organizations [20-22]. On the other hand, measuring and monitoring health system costs will help policymakers to choose appropriate policies to support patients [23]. The amount of households’ OOP and the subsequent incidence of back-breaking costs of health services are two critical factors that should always be taken into account in the calculations related to the planning and policy-making of health services [24]. Considering the importance of OOP rates as one of the most important key topics in health policies and their continuous evaluation to monitor justice in financing the health system, the present study aimed to estimate the amount of direct OOP caused by COVID-19 pandemic in hospitals of south Kerman province in Iran. As a consequence of considering these findings, making future decisions can be facilitated in various financial and operational fields for policymakers and health system implementers.
2. MATERIALS AND METHODS
2.1. Design and Setting
The present descriptive-analytical study was conducted cross-sectionally in 2022. To this end, the financial records of patients with COVID-19 hospitalized in hospitals affiliated with Jiroft University of Medical Sciences in the south of Kerman province were examined. During the data collection period, i.e., from the beginning of April 2020 to the end of March 2021, statistical data were collected from Imam Hussein, Imam Khomeini, Ayatollah Kashani, 12 Farvardin, Seyed Al-Shohada, and Shohada hospitals.
2.2. Study Population
Based on the following formula, the sample size was estimated as 384 people but 450 people were recruited to increase the validity of the results. The simple stratified random sampling method was administered to select the participants based on the ratio of hospitalization in the studied hospitals and the ratio of hospitalizations per month.

Where, p=q= 0.5, Z= 1.96, d= 0.05
2.3. Data Collection
The data collection tool was a three-part researcher-made checklist containing the patients’ demographic information (age, gender, duration of hospitalization, method of discharge, and type of insurance plan), frequency of rendered services (the number of visits, consultation, nursing services, pharmaceutical services, CT scans, radiography, laboratory, dialysis, radiology, ultrasound, MRI, and ward/ bed equipment), and cost information (total direct cost, patient share (OOP), share of basic insurance, government subsidy share, supplementary insurance share, and non-obligation government subsidy share of the total direct cost by service type).
2.4. Procedure and Statistical Analysis
To collect relevant data, the researchers made the necessary coordination with Jiroft University of Medical Sciences, referred to the hospital's Health Information System (HIS), and received the patients’ bills. To comply with the ethical considerations, all data collection forms were completed anonymously without referring to the patients’ names or information. The collected data were analyzed using descriptive and inferential (T-test, ANOVA, Pearson's correlation coefficient) statistical methods by running SPSS23. The significance level was set at 5%. Thus, in order to check the correlation between OOP and variables of age and length of hospitalization, Pearson's correlation coefficient was administered. T-test was used to check the difference in OOP mean scores based on the patients’ gender. Finally, ANOVA was run to investigate the significance of the difference in the OOP mean scores based on the variables of insurance type and discharge method.
3. RESULTS
3.1. Demographic Characteristics of the Studied Patients
The participants’ mean age was 55.88 ± 19.11 years and the majority of them (18.89%) were male (51.3%) in the age group of 61-70 years and covered by health insurance (69.8%). The average length of hospitalization was 5.56 ± 4.14 days but most patients (49.55%) were hospitalized for less than five days. Furthermore, 87.34% of the patients were discharged from the hospital after the status of “recovery” was observed. Table 1 shows the frequency distribution of the studied patients.
3.2. The Studied Patients' Share of the Total Direct Cost
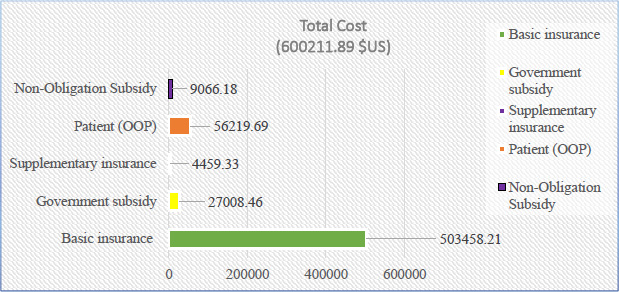
Based on the results, the total direct costs were estimated at 25,208,899,708 Rials (600,211.89 $US), of which 9.37% was the patient's share (2,361,227,375 Rials equivalent to 56,219.70 $US) (Table 2, Fig. 1).
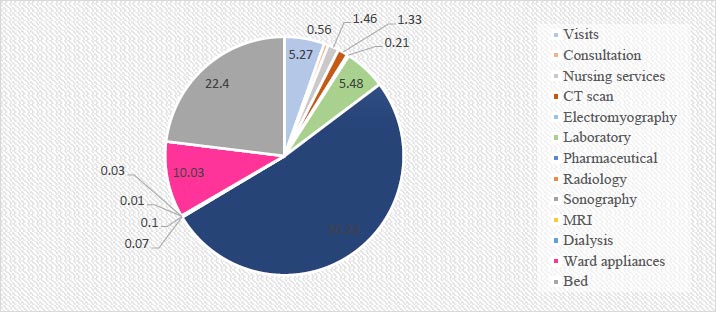
The results showed that among the types of services, pharmaceutical services accounted for 40.74% of the total cost (i.e., 10,272,282,858 Rials equivalent to $244,578.16) and 50.23% of the patients' contribution (i.e., 11,860,31713 Rials equivalent to $28,238.85). These two costs accounted for the highest values of total costs and OOP (Tables 3 and 4, Fig. 2).
| Variable Characteristics | N | % | |
| Gender | Female | 219 | 48.7 |
| Male | 231 | 51.3 | |
| Age (Years) | Lower than 20 | 3 | 0.67 |
| 20-30 | 35 | 7.78 | |
| 31-40 | 79 | 17.56 | |
| 41-50 | 72 | 16 | |
| 51-60 | 68 | 15.11 | |
| 61-70 | 85 | 18.89 | |
| 71-80 | 52 | 11.55 | |
| 81-90 | 40 | 8.89 | |
| Higher than 90 | 16 | 3.55 | |
|
Duration of hospitalization (days) |
Less than 5 | 223 | 49.55 |
| 5-10 | 189 | 42 | |
| 11-15 | 25 | 5.56 | |
| 16-20 | 6 | 1.34 | |
| More than 20 | 7 | 1.55 | |
|
Type of Insurance |
Health services | 314 | 69.8 |
| Social security | 106 | 23.6 | |
| Armed forces | 14 | 3.1 | |
| Others | 8 | 1.8 | |
| Without insurance | 8 | 1.8 | |
| Discharge status | Improvement | 393 | 87.34 |
| Death | 36 | 8 | |
| transfer | 7 | 1.56 | |
| Discharge by personal choice |
14 | 3.1 | |
| Contribution Categories | Cost* | Mean | Std. Deviation | Percentage of Total Cost** |
| Basic insurance | 503458.21 | 1118.79 | 1425.02 | 83.88 |
| Government subsidy | 27008.46 | 60.01 | 109.21 | 4.50 |
| Supplementary insurance | 4459.33 | 9.90 | 81.67 | 0.74 |
| Patient (OOP) | 56219.69 | 124.93 | 235.85 | 9.37 |
| Non-Obligation Subsidy | 9066.18 | 20.14 | 169.20 | 1.51 |
| Total | 600211.89 | 1333.80 | 1315.02 | 100 |
** It shows the percentage of each part of the total costs; For example, the share of basic insurance (503458.21 $) of the total costs (600211.89 $) is equal to 83.88 % (503458.21/600211.89 *100).
|
Type of Service |
Total Cost* | Basic Insurance Total Contribution | Government Subsidy Total Contribution | Supplementary Insurance Total Contribution | Patients’ Contribution** | Total Non-obligation Subsidy | % of the Total Cost*** |
| Visits | 82105.05 | 77269.20 | 1218.39 | 159.97 | 2967.17 | 503.18 | 13.67 |
| Consultation | 9081.04 | 9527.99 | 161.99 | 16.04 | 313.85 | 67.97 | 1.51 |
| Nursing services | 9018.74 | 8467.36 | 231.85 | 30.32 | 821.47 | 146.72 | 1.50 |
| CT scan | 11672.33 | 10462.81 | 244.23 | 37.50 | 748.82 | 162.33 | 1.94 |
| Electromyography | 2158.84 | 1996.31 | 44.59 | 3.93 | 117.72 | 20.67 | 0.36 |
| Laboratory | 39550.31 | 35428.60 | 1027.23 | 149.72 | 3081.43 | 573.20 | 6.59 |
| Pharmaceutical | 244578.16 | 192173.09 | 12861.20 | 2668.44 | 28238.85 | 0 | 40.74 |
| Radiology | 648.51 | 593.45 | 15.85 | 0.59 | 43.53 | 4.24 | 0.10 |
| Sonography | 1330.21 | 1224.95 | 32.47 | 12.86 | 59.91 | 8.10 | 0.22 |
| MRI | 111.11 | 101.18 | 1.24 | 2.48 | 6.20 | 0 | 0.01 |
| Dialysis | 1192.23 | 1158.41 | 12.45 | 0 | 21.36 | 0 | 0.19 |
| Ward appliances | 17587.30 | 5151.94 | 6171.03 | 675.69 | 5643.03 | 11.82 | 2.93 |
| Bed | 153990.51 | 136444.32 | 3938.98 | 585.73 | 12597.39 | 2445.45 | 25.65 |
** The total patient's share is 56219.69 $US
*** The total cost is 600211.89 $US
| Type of Service | Mean (Standard Deviation) | |||||
| Total Cost | Patient Basic Contribution | Government Subsidy | Supplementary Insurance Contribution | Patient Contribution | Non-obligation Subsidy | |
| Visit | 182.45 (196.36) |
171.70 (188.29) |
2.70 (5.69) |
0.35 (2.54) |
6.60 (13.03) |
1.11 (9.62) |
| Consultation | 20.18 (44.40) |
21.17 (55.52) |
0.35 (1.46) |
0.03 (0.46) |
0.69 (2.91) |
0.15 (2.60) |
| Nursing services | 20.04 (26.78) |
18.81 (33.41) |
0.51 (1.16) |
0.06 (0.54) |
1.82 (5.65) |
0.32 (4.02) |
| CT scan | 25.93 (24.40) |
23.25 (20.37) |
0.54 (0.88) |
0.08 (0.66) |
1.66 (3.49) |
0.36 (3.32) |
| Electromyography | 4.79 (6.25) |
4.43 (5.85) |
0.09 (0.20) |
0.008 (0.07)) |
0.26 (0.49) |
0.04 (0.41) |
| Laboratory | 87.88 (64.69) |
78.73 (59.30) |
2.28 (3.92) |
0.33 (2.24) |
6.84 (13.94) |
1.27 (11.98) |
| Pharmaceutical | 5.50 (729.17) |
427.05 (525.75) |
28.58 (68.23) |
5.94 (68.00) |
62.75 (147.07) |
0 (0) |
| Radiology | 1.44 (4.23) |
1.31 (3.89) |
0.03 (0.12) |
0.001 (0.02) |
0.09 (0.42) |
0.009 (0.20) |
| Sonography | 2.95 (11.86) |
2.72 (11.01) |
0.07 (0.34) |
0.02 (0.36) |
0.13 (0.66) |
0.01 (0.38) |
| MRI | 0.2 (2.61) |
0.22 (2.37) |
0.002 (0.05) |
0.005 (0.11) |
0.01 (0.17) |
0 (0) |
| Dialysis | 2.64 (34.08) |
2.57 (33.72) |
0.02 (0.48) |
0 (0) |
0.04 (0.63) |
0 (0) |
| Ward appliances | 39.08 (92.70) |
11.44 (41.06) |
13.71 (36.10) |
1.50 (20.68) |
12.54 (26.76) |
0.02 (0.55) |
| Bed | 342.20 (476.33) |
303.20 (428.15) |
8.75 (20.34) |
1.30 (11.03) |
27.99 (77.09) |
5.43 (67.11) |
3.3. The Relationship between Demographic Variables and OOP
Based on the findings, a significant relationship was observed between the patients’ OOP and their age (r=0.397, p=0.04), length of hospitalization (r=0.444, p<0.001), and type of insurance program (F=7.564, p<0.001). In other terms, the OOP of patients increased as a result of aging and lengthening of hospitalization. A significant difference was also observed in the patients’ OOP based on their type of insurance, which was related to the group “without insurance”; the average OOP of this group was higher than other groups with insurance coverage (Table 5).
Table 5.
| Variable | Category | Direct OOP Payment | |
| Mean ± Std. Deviation | P-Value | ||
| Age (years) | Lower than 20 | 504.58 ± 835.63 | 0.04 |
| 20-30 | 86.35 ± 127.23 | ||
| 31-40 | 9.59 ± 102.25 | ||
| 41-50 | 100.48 ± 109.09 | ||
| 51-60 | 118.12 ± 194.73 | ||
| 61-70 | 129.40 ± 241.03 | ||
| 71-80 | 130.21 ± 159.05 | ||
| 81-90 | 136.44 ± 275.15 | ||
| Higher than 90 | 229.61 ± 683.51 | ||
| Duration of hospitalization days | Less than 5 | 56.04 ± 72.85 | <0.001 |
| 5-10 | 157.15 ± 285.38 | ||
| 11-15 | 238.43 ± 188.27 | ||
| 16-20 | 367.11 ± 140.71 | ||
| More than 20 days | 836.69 ± 586.27 | ||
| Gender | Male | 127.27 ± 192.62 | 0.82 |
| Female | 122.46 ± 274.61 | ||
| Type of Insurance | Health services | 96.42 ± 107.41 | <0.001 |
| Social security | 123.34 ± 215.23 | ||
| Armed forces | 10.37 ± 9.39 | ||
| Others | 428.48 ± 497.31 | ||
| Without insurance | 1161.81 ± 844.42 | ||
| Discharge status | Improvement | 125.35 ± 246.13 | 0.69 |
| Death | 157.19 ± 179.61 | ||
| Transfer | 84.76 ± 48.28 | ||
| Discharge by personal choice | 53.11 ± 41.59 | ||
4. DISCUSSION
The present study was conducted with the aim of estimating the direct OOP of patients with COVID-19 hospitalized in hospitals affiliated with Jiroft University of Medical Sciences in the south of Kerman province. Based on the findings, the average total direct cost was equal to 56,019,777.13 Rials (1333.80) and the amount of OOP was 9.37% of the total direct costs, which accounted for an average of 5,247,171.94 Rials ($124.93) per patient. Yusefi et al. (2022) reported that the OOP of 550 hospitalized patients with COVID-19 was 8.89% of the total direct costs with an average of $167.69 per patient in Iran [25]. A part of the results of the study by Sadeghifar et al. (2021) showed that the patients’ OOP contribution was 10% of the total direct costs [26]. Kabir et al. (2021) also maintained that the average direct cost of 158 patients with COVID-19 was 214,926,500 Rials ($5117.29) [27]. Darab et al. (2021) reported that the average direct treatment costs of 477 patients with COVID-19 were equal to 59,203,409 Rials ($3755) [28]. In another study in China, the cost of each hospitalized case of COVID-19 patients with acute conditions in the intensive care unit was estimated at about $ 9,000 [29]. In the same vein, Cleary et al. (2021) declared that the cost of hospitalization for COVID-19 was $7,600 per patient in South Africa [30]. In an examination of the economic burden of COVID-19 in the American health system (2021), the direct cost of treating patients with symptoms requiring hospitalization was estimated at $18,579. However, if patients had mild symptoms and needed hospitalization, the costs would decrease to $ 3994 [31]. In the United States, the average direct treatment cost was $3,045 per COVID-19 patient [32]. Another study among a large sample of patients (n=4075) in the United States of America indicated that the average OOP was about $2688 [33]. In India (2022), the average OOP of 155 patients with COVID-19 was $93.57 per person for hospitalization services [34]. One of the reasons for the difference in the costs reported in the present study and similar studies can be related to the perspectives of economic evaluation. Also, various costs in different countries, types of insurance, and different facilities and infrastructures are other reasons for cost differences.
Consequently, the COVID-19 pandemic has caused confirmed financial pressures on patients due to hospitalization and treatment costs in the form of OOP. The disease has also imposed financial pressure on patients by depriving them of some sources of income, which has been exacerbated by the weakness of insurance coverage and the inefficiency of social support in developing countries, such as Iran.
According to the findings, 50.23% of hospitalized patients’ OOP was related to pharmaceutical services, which accounted for the largest part of OOP. According to the results of a similar study in Iran, the highest rate of OOP (57.12%) was attributed to pharmaceutical services in hospitalized patients with COVID-19 [25]. Of the direct medical expenses of COVID-19, the medicinal services accounted for the highest expenses with 30% of the total expenses [26]. According to Kabir et al. (2021), drug costs with 32% of the total hospital costs were among the cost items that accounted for the largest percentage of costs for COVID-19 patients [27]. Jin et al. (2020) in China found that medications had the largest share of the total cost of COVID-19 patients [29]. In the same vein, Darab et al. (2021) noted that 28% of the total direct treatment costs of COVID-19 patients consisted of medications and medical consumables with a total amount of 8,044,070,257 Rials ($510,209) and an average of 16,863,879 Rials ($1070) per patient [28]. Given that medicines are an essential part of health care expenses, they account for a huge share of household expenses, which has been corroborated by the literature. The novelty of COVID-19 and its newly discovered specific medicines can justify the high cost of medicines.
Similar to different studies in Burkina Faso, India, Georgia, China, America, and Turkey [35-41], a statistically significant correlation was observed between the value of OOP and the participants’ age. In other terms, the amount of OOP increases with an increase in age and the presence of seniors in families imposes great costs on the households. Mahumud et al. (2017) also investigated 12,400 patients receiving various health services in Bangladesh and concluded that age affected the OOP of patients significantly [42]. Contrary to this finding, some scholars observed no statistically significant correlation between the amount of OOP and the age of patients [25, 36].
According to epidemiological pieces of evidence, age is one of the determining factors in the distribution and occurrence of diseases because the prevalence of chronic diseases increases with age. Due to the elderly’s need for more care, this population spends a higher portion of the family's income on health expenses, which increases the possibility of creating back-breaking health expenses for households with elderly people.
The significant association between the amount of patients’ OOP and their length of hospitalization showed that OOP increased with longer periods of hospitalization, which is confirmed by several studies [25, 43, 44]. Similarly, Hajizadeh and Nghiem (2011) noted that the patients’ length of hospitalization was significantly related to the amount of OOP and increased the probability of back-breaking health costs [45]. In their study in Colombia, Riascos, and Serna (2017) stated that the length of a patient's hospitalization period was costly for providers, insurers, and patients due to the increased use of health services and the possibility of serious risks during the stay [46, 47]. Furthermore, physicians administer a variety of available resources, including diagnostic tests, treatment procedures, and different types of treatment methods leading to the patients’ usually long stay in the hospital, which in turn increases their total costs and OOP.
Finally, we found that the average OOP of patients varied based on their types of insurance plans indicating that patients without insurance coverage had the highest amount of OOP. In line with this study, Yusefi et al. (2022) represented that the amount of OOP of COVID-19 patients depended on their type of insurance plan. Moreover, they observed a significant difference in the average OOP between the COVID-19 patients covered by the armed forces’ insurance and those covered by the medical service insurance or social security insurance [25]. Along the same line, Shahraki and Ghaderi (2019) investigated the effect of different types of medical insurance on the amount of OOP and notified that households with medical services insurance, social security insurance, as well as insurance affiliated with special organizations had the highest rates of OOP compared to households with other medical insurances, respectively [48]. In a study in China, You and Kobayashi (2011) concluded that some types of insurance programs were associated with increased OOP rates [49]. A 40% decrease in the patients’ OOP was also reflected after the introduction of Medicare insurance in the United States in 1965 [50]. Ghiasi al. (2016) pointed to the significant role of supplementary insurance and its relationship with reduced costs of medical services [51]. Mohammadi and Zareie (2017) also confirmed the high contribution of health insurance organizations in reducing OOP [52] justifying the role of insurance as an intermediary organization in transferring capital from the consumer of health services to its provider. So, they are one of the most important and main pillars of financial provision in the health system in order to make OOP fair. On the other hand, medical insurances with an independent nature provide the necessary financial resources through the public participation of healthy people and provide the needs of patients during their illness. Therefore, the difference in OOP among different types of medical insurance seems to be caused by the variety in the provided service quality levels, insurance coverage of health services, and household access to health and medical centers. As a result, to create a unified insurance system for all people, all members of society should be provided with the same level of coverage for health goods and services.
As the most important limitation of the present study, the amount of OOP was estimated based on the documents and financial records of patients registered in the Hospital Information System. However, some patients could have had direct payments from other pockets, such as informal payments and payments for medications not available in the hospital, whose reflection in official statistics is doubtful.
CONCLUSION
According to the findings, 9.37% of the total direct costs of patients hospitalized due to COVID-19 were paid directly to OOP. Consequently, making appropriate decisions and implementing effective interventions are necessary to reduce the financial pressure of the disease on patients and their families.
AUTHORS’ CONTRIBUTIONS
ARY designed the study and prepared the initial draft. EM, EB, and JB contributed to data collection and data analysis. ARY and RF have supervised the whole study and finalized the article. All authors have read and approved the manuscript.
ETHICS APPROVAL AND CONSENT TO PARTICIPATE
This study is approved by the ethical committee of Jiroft University of Medical Sciences with the number of IR.JMU.REC.1400.046. Informed consent was obtained from all participants. All the methods were performed following the relevant guidelines and regulations.
HUMAN AND ANIMAL RIGHTS
No animals were used in this research. All procedures performed in studies involving human participants were in accordance with the ethical standards of institutional and/or research committees and with the 1975 Declaration of Helsinki, as revised in 2013.
CONSENT FOR PUBLICATION
Informed consent was obtained from all participants.
STANDARDS OF REPORTING
STROBE guidelines were followed.
AVAILABILITY OF DATA AND MATERIALS
The datasets used and/or analyzed during the current study are available from the corresponding author [R.F] upon reasonable request.
FUNDING
None Declared.
CONFLICT OF INTEREST
The authors declare that they have no competing interests.
ACKNOWLEDGEMENTS
This study is approved by Jiroft University of Medical Sciences with the ID of 622. The researchers express their gratitude to the respected Vice President of Research and Technology of Jiroft University of Medical Sciences and the honoured managers of the studied hospitals who cooperated with the research team.

