All published articles of this journal are available on ScienceDirect.

Linear and Nonlinear Associations between Meteorological Variables and the Incidence of Malaria in Zahedan District Southwest of Iran 2000-2019
Abstract
Introduction:
Iran is one of the malaria-prone countries. Malaria transmission is likely to be affected by many factors, including meteorological variables. This study aimed to evaluate the effect of climate variables on malaria incidence.
Methods:
A secondary analysis was conducted to examine the relation between malaria and meteorological variables in Zahedan district from 2000 to 2019. We built univariate and multivariate Seasonal Autoregressive Integrated Moving Average (SARIMA) models and Generalized Additive Models (GAM)/ Generalized Additive Mixed Models (GAMM) using R software. AIC, BIC and residual tests were used to test the goodness of fit of SARIMA models, and R2 was used to select the best model in GAM/GAMM.
Results:
The SARIMA multivariate (1,0,1) (0,1,1)12 model, including the mean temperature and minimum humidity variables without lag, was the best fit. In nonlinear analysis, the number of malaria cases positively correlated with the month from January and peaked in May (edf=6.29). There was a generally negative correlation between malaria and time in years (edf=8.41). The mean temperature, between 20 to 30°C had the highest and slightly positive relation with the incidence of malaria (edf=7.55). Rainfall showed a negative association with small fluctuations between 20 and 45 mm and a positive association over 50 mm (edf=7.52). Mean relative humidity from above 50% had a negative relation with the number of cases (edf=6.93). The hours of sunshine in a month, until 235 hours, had a negative correlation and above 340 hours had a positive correlation with the incidence of malaria (edf=7.4).
Conclusion:
Meteorological variables can affect malaria occurrence.
1. INTRODUCTION
Malaria is a vector-born tropical disease transmitted by the bite of the female Anopheles mosquito. More than 40 species of Anopheles mosquitos are malaria vectors; 120 species of Plasmodium are known to be contagious to mammals, birds, and reptiles; but only six infect humans [1]. The predominant Plasmodium in Iran is Plasmodium vivax [2].
Nearly half of the world's population was at risk for malaria in 2018, and 228 million cases occurred in 2018. Significant numbers of deaths from malaria were reported in Southeast Asia, the Eastern Mediterranean, the Western Pacific and the Americas [3]. Iran is one of the malaria-prone countries. Malaria incidence was 1/100,000 in 2017 in Iran [2]. 82.2% of the cases are concentrated in the three southern and southeastern provinces of Sistan and Baluchistan, Kerman and Hormozgan, considered as Iran's malaria endemic zones [2].
Malaria transmission is likely to be affected by many factors [4, 5], including meteorological variables [6-10]. Researchers think variables such as temperature, precipitation, and humidity, which affect the population dynamics of malaria vectors are effective in the spread of malaria [11, 12]. Meanwhile, the suitability of the environment for the vector is important in disease transmission and depends on factors such as altitude, vegetation, and climate [1].
Malaria transmission in endemic areas of Iran is seasonal and unstable [13]. Zahedan city, the capital of Sistan and Baluchistan province, is one of the areas with a high incidence of malaria in Iran. Environmental, socio-economic and climatic factors and proximity to Afghanistan and Pakistan (which have a high incidence of malaria) are among the factors affecting the high incidence of malaria in this area [14, 15]. The current study seeks to identify meteorological factors associated with the incidence of malaria in this area of Iran.
2. METHODOLOGY
2.1. Research Design
A secondary analysis was conducted to examine the relation between malaria and meteorological variables in Zahedan district from 2000 to 2019. The proposal for this study was reviewed at the Kerman University of Medical Science and ethical approval was granted (Ethic Code: IR.KMU.REC.1399.545).
2.2. Study Population and Area
Zahedan district is located in the southwest of Iran and the north of Sistan and Baluchistan province has a population of about 587,730 people according to the 2016 national census; its inhabitants are largely from the Baloch ethnic group. It is geographically located at 60º 52´ 00˝ E and 29º 29´ 45˝ N [16]. This district extends over an area of 36,581 square kilometers and has an arid climate based on the De Martonne classification. The average total monthly rainfall over the 20 years evaluated in this current study was 4.8 mm and the average temperature during this period was 18.8°C. This region has a wide difference between night and day temperature and different seasons. The minimum temperature recorded during these years was -3.9°C and the maximum was 39.2°C.
2.3. Outcome Data
In the malaria surveillance system of Iran, reporting cases of malaria diagnosed in all private and public medical centers is mandatory, and all centers are responsible for reporting probable and confirmed cases of malaria immediately in less than 24 hours. The golden method for diagnosing malaria is a peripheral blood slide test [17]. After confirmation, all cases are registered in the infectious diseases registration portal of the Iranian Ministry of Health and Medical Education's Communicable Disease Control Center [18]. Cases included in this study were confirmed cases of malaria, diagnosed based on blood slide tests, regardless of whether or not they had the clinical signs of malaria. Cases registered during 2000-2019 were inquired from the Deputy of Health at Sistan–Baluchistan University of Medical Sciences and were included in this study. The time of onset of symptoms was used in this study, not the time of diagnosis or treatment of the disease.
2.4. Meteorological Data
Meteorological variables from 2000 until 2019 were obtained from the Zahedan City Synoptic Meteorological Station. These variables included mean, maximum and minimum monthly air temperature (°C), relative humidity (%), cumulative monthly rainfall (in millimeters) and monthly sunshine (sum of hours per month). In case data were not available for some days, the monthly average was calculated based on data from the available days.
2.5. Statistical Analysis
Descriptive analysis was performed on 20-year data. The difference in the incidence of malaria in different months was examined using the Kruskal-Wallis test.
The Box Jenkins method was used in SARIMA models for parameter estimation. In univariate Seasonal Autoregressive Integrated Moving Average (SARIMA), the model was evaluated for stationary, visually. The Dicky-Fuller test was used to determine the stationary or non-stationary of the mean. The autocorrelation function (ACF) and partial autocorrelation function (PACF) were computed and examined to determine auto-regressive (AR) (q, Q) and moving average (MA) (p, P) parameters, respectively. The variance was stabilized with Box-Cox transformation until the histogram of residuals and the normal probability plot or Q-Q plot showed a normal distribution with independent residuals. Finally, the best model was selected according to the Akaike Information Criterion (AIC) and Bayesian Information Criterion (BIC).
We used multivariate SARIMA to investigate the effect of climate variables on the incidence of malaria. A common pre-whitening approach was used to select the most appropriate lags of the variables, entered as covariates in the models. The Cross Correlation Function (CCF) between the residuals of the case series and each predictor climate variable was calculated and the variable was selected if the value of the CCF between the series was significant at the 95% CI. Then, the SARIMA model was run for each of the climate variables and different lag(s). The best model was selected according to the smallest AIC and BIC [19]. We used the “tseries” package version 0.10-47 designed by Trapletti et al. [20] in R software (R version 3.5.3) to do the statistical analysis.
Because of the nonlinear association between climate variables and malaria incidence, quassi Poisson generalized additive models (GAM) was used. As there was collinearity between climate variables, we calculated the Variance Inflation Factor (VIF) and the variables with VIF≥10 were not added to the model simultaneously. The Cross Correlation Function (CCF) was used to select the best predictors and strongest lags. Finally, the best model was selected according to the R-square. The “mgcv” package version 1.8-7, designed by Wood [21] and available in R statistical software (version 3.5.3) was used for analysis.
| Variables | Frequency | Percentage (%) | |
|---|---|---|---|
| Age group | 0-4 yrs. | 238 | 5.8 |
| 5-15 yrs. | 660 | 16.2 | |
| ≥ 15 yrs. | 3176 | 78 | |
| Sex | Male | 3076 | 75.5 |
| Female | 998 | 24.5 | |
| Residence | Urban | 3056 | 75 |
| Rural | 1018 | 25 | |
| Species of Plasmodium | Vivax | 3545 | 87 |
| Falciparum | 379 | 9.3 | |
| Mix of both | 150 | 3.7 | |
| - | Mean (SD) | Min | P(1st) | P(25th) | Median | P(75th) | P(99th) | Max |
|---|---|---|---|---|---|---|---|---|
| Mean temperature | 18.8 (8.2) | 2 | 5 | 11.05 | 19 | 27.2 | 31.5 | 32.2 |
| Minimum temperature | 11.1 (7.2) | -3.8 | -3.1 | 4.9 | 12.4 | 17.9 | 22 | 22.3 |
| Maximum temperature | 27.5 (7.9) | 7.6 | 13.5 | 20.2 | 29 | 35.2 | 38.6 | 39.2 |
| Mean humidity | 27.1 (13) | 9.5 | 10.2 | 16.2 | 23.3 | 36 | 64.6 | 68.8 |
| Minimum humidity | 5.5 (3.2) | 0 | 0 | 3 | 5 | 7 | 18 | 23 |
| Maximum humidity | 67 (25) | 23 | 26 | 41 | 70.5 | 92 | 100 | 100 |
| Rainfall | 4.7 (9.7) | 0 | 0 | 0 | .03 | 4.5 | 47.2 | 57.48 |
| Sunshine | 282.6 (47.7) | 153 | 158 | 245.5 | 283 | 319.5 | 371 | 380 |
3. RESULTS
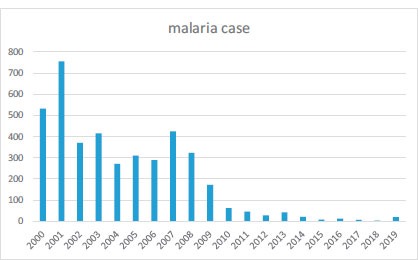
Overall, 4,074 cases of malaria were registered for the time of 2000-2019 in Zahedan district. The descriptive characteristics of malaria cases are demonstrated in Table 1. Fig. (1) shows the count of cases over the years. Table 2 shows the descriptive statistics of meteorological variables in the Zahedan district from 2000 through 2019.
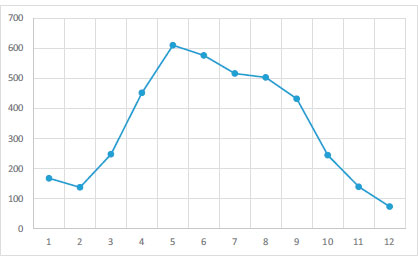
The plots in Fig. (2) show that the number of recorded caseswas significantly different in different months. From February, the number of cases increased (Kruskal-Wallis= 29.52, df=11, p<0.001).
Different SARIMA models were run and the AIC, and BIC were compared. SARIMA (1,0,1) (0,1,1)12 in univariate analysis had the lowest AIC, and BIC (AIC: 7.26, BIC: 7.33, log likelihood = -862.91) (Table 3).
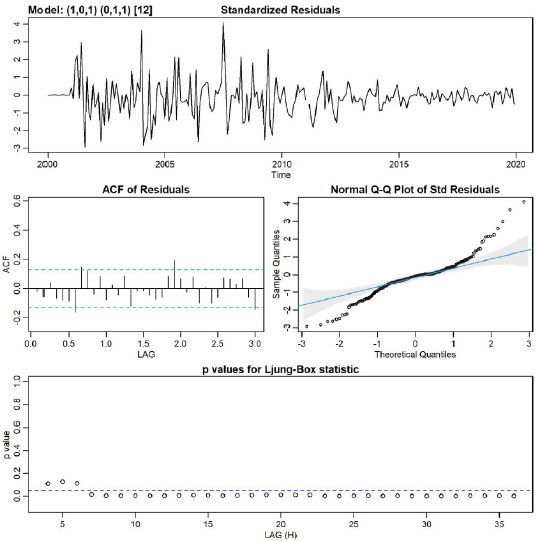
Based on CCF and VIF, in multivariate SARIMA, different models with several variables and lags were tested, and the (1,0,1) (0,1,1)12 model, including mean temperature and minimum humidity with zero lag were the best fit for the data (AIC: 7.26, BIC: 7.43, log-likelihood = -856.4). Fig. (3) showed no obvious pattern in the standardized residuals.
In GAM analysis, several models were examined, and the best model was selected according to the R2. The results showed that the incidence of malaria had the highest correlation with the monthly average of relative humidity, monthly sunshine hours, monthly cumulative rainfall and the monthly average of temperature of the same month (Table 4).
| Model | Variables | - | Lag | Estimate | SE | T | Sig. |
|---|---|---|---|---|---|---|---|
| [A] | Monthly patients | Constant | - | -0.21 | 0.05 | -3.99 | <0.0001 |
| - | - | AR | Lag 1 | 0.69 | 0.07 | 9.98 | <0.0001 |
| - | - | MA | Lag 1 | -0.02 | 0.10 | -0.22 | 0.82 |
| - | - | Seasonal difference | - | 1 | - | - | - |
| - | - | MA, seasonal | Lag 1 | -0.76 | 0.05 | -16.13 | <0.0001 |
| [B] | Monthly patients | AR | Lag 1 | 0.80 | 0.05 | 14.86 | <0.0001 |
| - | - | MA | Lag 1 | -0.09 | 0.09 | -1.02 | 0.30 |
| - | - | Seasonal difference | - | 1 | - | - | - |
| - | - | MA, seasonal | Lag 1 | -0.70 | 0.05 | -14.02 | <0.0001 |
| - | Maximum temperature | - | - | -0.32 | 0.55 | -0.58 | 0.56 |
| - | Minimum temperature | - | - | 0.40 | 0.51 | 0.79 | 0.42 |
| - | Mean temperature | - | - | 0.46 | 0.22 | 2.03 | 0.04 |
| - | Rain rate | - | - | 0.02 | 0.07 | 0.24 | 0.80 |
| - | Maximum Humidity | - | - | -0.04 | 0.06 | -0.66 | 0.51 |
| - | Minimum Humidity | - | - | 0.74 | 0.27 | 2.6 | 0.008 |
| - | Mean Humidity | - | - | -0.14 | 0.16 | -0.86 | 0.38 |
| - | Sunshine | - | - | -0.0007 | 0.03 | -0.02 | 0.98 |
| Smooth Terms | Edf | F | P-value | |
|---|---|---|---|---|
| S(month) | 6.29 | 5 | <1.6e-9 | |
| S(time) | 8.41 | 207 | <2e-16 | |
| s (relative humidity) | 6.93 | 4 | <0.0001 | |
| s (sunshine hour) | 7.4 | 5.17 | <0.0001 | |
| s (rainfall) | 7.52 | 4.59 | <3.4e-5 | |
| s (mean of temperature) | 7.55 | 3.47 | <0.001 | |
| - | Estimate | Std. Error | ||
| Intercept | 1.7 | 0.04 | <2e-16 | |
| R-sq. (adj) | 0.85 | |||
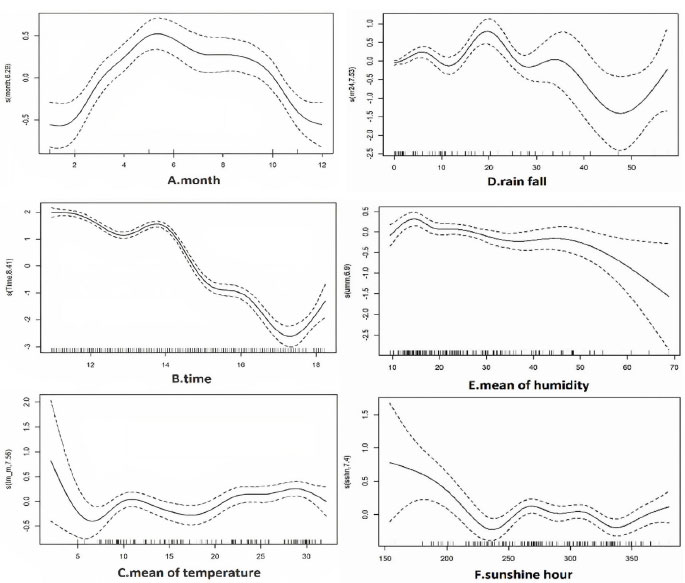
In nonlinear analysis, the number of malaria cases was positively correlated with the month from January and peaked in May, then it was negatively correlated with the month (edf=6.29) (Fig 4A). There was a generally negative correlation between malaria and time in years (edf=8.41) (Fig 4B), as the number of cases has declined. The mean of temperature, between 20 to 30°C had the highest and slightly positive relation with the incidence of malaria (edf=7.55) (Fig 4C). Rain fall (Fig. 4D) showed a negative association with small fluctuations between 20 and 45 mm, and a positive association over 50 mm (edf=7.52). Mean relative humidity from above 50% had a negative relation with number of cases (edf=6.93) (Fig. 4E). The hours of sunshine in a month, until 235 hours had a negative correlation, between 320-340 had a negative correlation and above 340 hours had a positive correlation with the incidence of malaria (edf=7.4) (Fig. 4F).
4. DISCUSSION
The results of this study and previous studies [22-24] show that malaria incidence fluctuates during different months and seasons. In this study, the number of cases increased from April (the first month of spring in Iran) and decreased in October (the first month of autumn in Iran). These fluctuations show that meteorological variables are likely to be affecting the incidence of this disease.
In this study, the SARIMA model (1,0,1) (0,1,1)12 had the best fit, and the number of malaria cases in each month was affected by the number of cases in previous months. A study done in Kahnooj, Iran, reported autocorrelations between the number of cases in consecutive dekads (ten-day periods) [25] and a time series study conducted in Minab, Iran showed that the number of malaria cases was related to the number of cases that occurred 2 weeks before [26].
Based on this study, in both multivariate SARIMA and GAM analysis, by increase in the monthly mean temperature, the incidence rate of malaria increased significantly in the same month; and the most suitable temperature for malaria transmission was 20 to 30°C. Also, sunshine hours had a positive effect on increasing cases, between 240-320 hours per month. In a study done by in Kerman province, Iran by negative binomial regression, a 1°C increase in maximum temperature in one month increased the incidence of malaria by 15 and 19 percent in the same month and next month, respectively [14]. Another time series study done in Kahnooj, Iran reported positive associations between mean of daily maximum temperature, with 3 dekads (ten-day periods) lagged, and the number of P. vivax malaria cases (Risk ratio=1.34, P<0.001) [25]. A study reported that it takes 15 to 25 days for P. Vivax to complete its life cycle at 15 to 20°C, and a shorter time which is 6 to 10 days to complete its life cycle at 25 to 30°C [7]. However, a study from Malawi (a small country in Southern Africa), showed that minimum temperature in the three preceding months was not associated with malaria transmission [27]; and a study in the south of Iran showed that maximum and minimum temperature with 2-months lag time, negatively correlated with malaria cases, which is in contrast with the results of this study [26].
Temperature affects the sporogonic cycle of the plasmodium and the longevity of the vector [11, 27]. The incubation period or latent period of subtropical and temperate plasmodia strains lasts eight to ten months, but this period is shorter in tropical strains and is about 3 to 6 weeks. Tropical strains relapse faster than temperate strains [10]. For most malaria-carrying species of Anopheles, the optimum temperature range for their evolution is between 20 to 30°C [28]. However, the transfer of P. vivax requires a minimum average temperature of 15°C, and the transfer by P. falciparum requires a minimum temperature of 19°C. This minimum temperature should remain over a period of time for the completion of sporogony in mosquitoes [29]. The time required for the development of mature oocytes in the salivary glands is between 7-30 days and is also affected by ambient temperature [30]. A temperature-dependent dynamic population model used on data from Eastern Africa showed that a 0.5°C increase in air temperature, can lead to a 30 to 100% increase in mosquito abundance [31]. In western Kenya, a 1°C increase in air temperature was predicted to reduce the larval duration of Anopheles gambiae from 47 to 37 days [31]. Temperature is a factor that affects every stage of the mosquito's life. If the temperature of the water in which the mosquito lays eggs is too hot or cold, fewer eggs will hatch. Temperature is also effective in the process of turning the eggs into larvae and then pupae. The shortest larval and pupal period happens when the temperature is between 22 and 26°C [32]. In Mauritius, in the temperature range of 18 to 26°C, a temperature decrease of 1°C was reported to increase the lifespan of the mosquito by more than a week [33]. In general, 5 factors including temperature, moisture, predation, disease and nutrients are effective in the dynamics of Anopheles mosquito population. Temperature is a critical factor for the growth and development of mosquitoes and affects the duration of the gonotrophic cycle [34].
In this study, multivariate SARIMA models indicated that minimum humidity was associated with malaria incidence; and in GAM analysis, mean relative humidity above 50% had a negative relation with number of cases. This is probably because humidity shortens the life span of mosquitoes. Similarly, a study conducted in Sistan and Baluchistan using negative binomial regression showed the incidence of malaria had a positive correlation with humidity, when humidity was >60%, but humidity <60% had a negative impact on malaria incidence [35]. A time series study conducted in Kahnooj, Iran reported negative associations between relative humidity lagged 3 dekads (30 days) and incidence of malaria (Risk ratio=0.9. Pvalue=0.002) [25]. In India, where the principle rural vector is An. Culicifacies, the urban vector is An. Stephensi, and the vector in the hilly-forested area is An. Fluviatilis, most malaria cases occur from May to October, when the average relative humidity is between 55 to 80 percent and the average temperature is between 15 to 30° [7].
The results of the present study showed monthly rain fall had a negative association with malaria incidence in the same month, when it was above 20 mm, and especially above 35, but the association was positive for over 50 mm. A study in Gash Bakra, in Eritrea found that rain fall with 2 and 3 months lag was significantly and positively related to the increased number of malaria cases [36]. However, no clear relation was observed between malaria occurrence and annual rainfall in some studies [37, 38].
Anopheles eggs can survive in dry soil for up to 15 days, but in some parts of Africa they survive for more than two months [39]. In general, survival in hot weather decreases with low humidity, but in some areas where such conditions are dominant, such as the dry season in Sudan, mosquitoes have also adapted [40]. Deforestation by reducing shade and changing rainfall patterns can affect the local climate and affect the behavior of Anopheles mosquitoes. Wetland drainage by reducing vector production sites can reduce the incidence of malaria [10].
In addition to climatic factors, the behavior and cultural characteristics of the community, including the pattern of daily activities, the location of houses, proximity to mosquito breeding sites, the use of nets and the health care system, are effective in the incidence of malaria.
One of the most important barriers to malaria control in Iran is the patients’ delay in visiting health centers, and delay in diagnosis and treatment, which is related to people’s lack of information about the disease and misdiagnosis. Other reasons are people’s lack of trust and not cooperating with the health system, as well as illegal travel to neighboring countries (Afghanistan and Pakistan), which are among the areas with a high incidence of the disease [15].
Malaria is still endemic in three southern and south-eastern provinces of Iran. The reason malaria has not been eliminated in these provinces is the humid and ideal weather for vector development, the proximity of these provinces to Pakistan and illegal immigrants [24].
The study had some limitations, as it did not consider demographic and socio-economic conditions or the effect of the malaria control programs in the region.
CONCLUSION
Meteorological factors, including monthly relative humidity, monthly sunshine hours, monthly cumulative rainfall and the monthly average temperature, are likely to affect the incidence of malaria in Iran.
AUTHORS' CONTRIBUTION
NK suggested the topic, was the main supervisor, and helped write and edit the manuscript. SN acquired the data, cleaned the data, analyzed the data, and prepared the initial draft. EG provided statistical consultation consolation and edited the final manuscript. MK provided scientific advice and edited the final article. All authors read and approved the final manuscript.
LIST OF ABBREVIATIONS
| ACF | = The autocorrelation function |
| PACF | = Partial autocorrelation function |
| AR | = Auto-regressive |
| AIC | = Akaike Information Criterion |
| BIC | = Bayesian Information Criterion |
| CCF | = Cross Correlation Function |
| GAM | = Generalized additive models |
| VIF | = Variance Inflation Factor |
ETHICS APPROVAL AND CONSENT TO PARTICIPATE
This project was approved by the Ethics Committee of Kerman University of Medical Sciences, Kerman, Iran. Monthly aggregated data was used, and all health data were anonymous.
HUMAN AND ANIMAL RIGHTS
No animals were used in this research. All procedures performed in studies involving human participants were in accordance with the ethical standards of institutional and/or research committee and with the 1975 Declaration of Helsinki, as revised in 2013.
CONSENT FOR PUBLICATION
Informed consent was obtained from all participants.
STANDARDS OF REPORTING
STROBE guidelines were followed.
AVAILABILITY OF DATA AND MATERIALS
The number of cases was inquired from the health deputy of Zahedan University of Medical Health and can be inquired from the first author upon reasonable request.
FUNDING
This project was supported by grant number 99000307, by Kerman University of Medical Sciences, Kerman, Iran. The funder had no role in the scientific aspects or write-up of this study.
CONFLICT OF INTEREST
The authors declare no conflict of interest financial or otherwise.
ACKNOWLEDGEMENTS
The authors would like to sincerely thank the Center for Communicable Disease Control and Prevention, The Iranian Ministry of Health, the Deputy of Health of the Sistan-Baluchistan University of Medical Science and the Meteorological Organization of Iran (IRIMO).

