All published articles of this journal are available on ScienceDirect.

Clustering Countries based on the Trend of COVID-19 Mortality Rates: An Application of Growth Mixture Models
Authors Info & Affiliations
Abstract
Background:
The pattern of death due to COVID-19 is not the same worldwide and requires special approaches and strategies to identify.
Objective:
This study aimed to investigate the pattern of COVID-19 mortality rates in different countries using the Growth Mixture Model (GMM).
Methods:
This longitudinal study examined mortality trends due to COVID-19 for 214 countries during 2020-2022. Data were extracted from the World Health Organization reports. Countries were classified using Latent Growth Models (LGM) and GMM based on reported death trends.
Results:
Countries worldwide were classified into four clusters with different mortality patterns due to COVID-19. The highest increase in the death rate was related to cluster 2, including three countries of Iran, Peru, and Spain. The lowest increase in the death rate in each period belonged to cluster 1, which included about 60% of the world's countries. In cluster 3, most European countries, the United States, and a few countries from South America and Southeast Asia were placed. Italy was the only country in the fourth cluster.
Conclusion:
Our findings showed which countries performed better or worse in dealing with the COVID-19 pandemic.
1. INTRODUCTION
Acute respiratory syndrome coronavirus (SARS-CoV-2), the seventh human coronavirus, was identified in January 2020 in Wuhan, China, during a recent pneumonia epidemic [1, 2]. The extremely high contagiousness of the virus caused the disease to spread quickly worldwide. It was declared a pandemic by the World Health Organization (WHO) on March 11, 2020 [3, 4]. This pandemic became one of the most significant challenges to humanity in modern history and the most important priority and concern of countries’ health systems. It caused many worries and problems among the people of the world [5]. More than 614 million people worldwide were infected with the virus, and around 6.52 million people lost their lives due to COVID-19 until September 30, 2022 [6].
Based on the statistics reported by the countries and WHO, the pattern of infection and death due to COVID-19 differs in various countries, and there is significant heterogeneity between regions and countries in the statistics. For example, 1,915,647 confirmed deaths in the European continent compared to 257,553 confirmed deaths in the African continent, and another example comparing two neighboring countries, Belgium with 281.49 confirmed deaths and the Netherlands with 132.04 confirmed deaths per 100,000 as of September 20, 2022 [7, 8]. These differences may be influenced by geographical, cultural, economic, and social conditions. Thus, countries need special approaches and strategies to control the disease. Therefore, to control and reduce the burden of the disease, the source of these differences in the epidemiological patterns and behaviors of COVID-19 in different societies should be identified. One practical data-based solution is clustering countries based on similar trends in mortality from this disease. This approach can be a breakthrough, especially for infectious diseases that lead to global disasters such as epidemics.
Many studies use longitudinal approaches to evaluate the changes in the response variable (mortality rate). There are various statistical methods for longitudinal data analysis, including the Growth Mixture Model (GMM), which is less limited and more potent than traditional approaches. One of the advantages of this model is the identification of possible heterogeneity and the classification of samples into homogeneous groups, assuming that all countries are from a single homogeneous society. Identifying countries with similar death trends can lead to identifying prevention policies and measures with similar outcomes so that the most effective steps to control COVID-19 and potential future pandemics can be recognized. Consequently, this study aims to classify and compare countries based on the pattern and trend of deaths caused by COVID-19 using GMM in order to identify the most effective measures in dealing with the COVID-19 pandemic for the use of policymakers.
2. METHODS
2.1. Data
This study received death data from the WHO website [6]. Data included the number of daily deaths caused by COVID-19 for 214 countries in five time points with an interval of six months during 2020-2022 (March 11, 2020; September 11, 2020; March 11, 2021; September 11, 2021; March 11, 2022). The data on countries' populations were obtained from the United Nations website [8]. Then, each country's death rates due to COVID-19 were calculated per 100,000 people.
2.2. Statistical Method
In this longitudinal study, the Latent Growth Model (LGM) was first used to evaluate mortality trends due to COVID-19 during 2020-2022. Then, the Growth Mixture Model (GMM) was used to classify countries based on similar trends. The LGM is a longitudinal data analysis method, popular in recent years. This model determines the pattern of response variable changes by using hidden factors and is defined as follows:
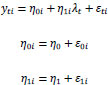 |
Where yti is the value of the observed response variable corresponding to the i-th sample at time t (the death rate of the i-th country in year t); two random variables η0i and η1i are hidden factors of the intercept and slope, respectively; λtS are time scores that describe trends over time on the response variable. Also, ε represents the term of random error; η0 and η1, respectively, represent the average intercept (the average of the response variable at the beginning of the study) and the average slope (the average changes of the response variable over time) [9].
When the changes in the response variable are not linear, the latent non-linear growth model should be used [9]. For this purpose, there are various non-linear models, of which the free time score method was used in this study. Finally, AIC (Akaike Information Criterion) and BIC (Bayesian Information Criterion) were used to determine the most efficient linear or non-linear model. Lower values of these criteria indicate a better fit [10, 11].
An essential limitation of LGM is that it assumes that all people belong to a homogeneous statistical population and that the changing trend is the same for all samples [12]. Therefore, in case of heterogeneity of response variable changes and identification of homogeneous subgroups in which all samples have a similar trend over time, LGMM or the generalized LGM, is used [13] and defined as follows:
Where ykit represents the value of the response variable related to the i-th sample at time t in class k [9].
BLRT (Bootstrap Likelihood Ratio Test) was used to determine the number of hidden classes; finally, among the models for which the BLRT was significant, the model with the lowest values of AIC and BIC was selected as the optimal model. Entropy statistic was used to evaluate the quality of classification, and a value of 0.8 and higher was considered a good classification [14]. All statistical analysis and model fitting was done using Mplus 7.4 software.
3. RESULTS
3.1. Assessing the Trend by the LGM
The results of the linear and non-linear growth curve models are indicated in Table 1. Due to the lower values of AIC and BIC criteria of the non-linear model compared to the linear model, the non-linear model showed a better fit than the linear model. In the non-linear model, the average intercept and the average slope were respectively estimated as 0.002 (P=0.113) and 11.63 (P<0.001). The average death rate due to COVID-19 in the world has increased by 11.63 people per 100,000 in each period. In the first period of the study (March 11, 2020 - September 11, 2020), the average death rate increased by 11.63 per 100,000 people. In the second period (September 11, 2020 - March 11, 2021), the average death rate increased by 22.67 per 100,000 people (η1(λ(t+c)-λt) = η1(λ32-λ22) = 11.63 x (2.95-1) = 22.67), but in the third period (March 11, 2021 - September 11, 2021), it decreased by 1.27 per 100,000 people (η1(λ(t+c)-λt) = η1(λ42-λ32) = 11.63 x (2.84-2.95) = -1.27), and in the fourth period (September 11, 2021; March 11, 2022), it increased by 3.37 per 100,000 people (η1(λ(t+c)-λt) = η1(λ42-λ32) = 11.63 x (3.13-2.84) = 3.37.
| Models | Intercept | Slope | Time Scores | AIC | BIC |
|---|---|---|---|---|---|
| Mean (SE) | Mean (SE) | ||||
| linear LGM | 0.002 (0.001) | 10.68 (0.74)* | (0, 1, 2, 3, 4) | 7478.47 | 7512.13 |
| Non-linear LGM | 0.002 (0.001) | 11.63 (2.46)* | (0, 1, 2.95, 2.84, 3.13) | 7434.19 | 7477.95 |
3.2. Clustering Countries by GMM
The results of the indices of the fitting models to determine the number of hidden classes are shown in Table 2. As can be seen in Table 2, a total of five models, from one to five classes, were created. Of which the BLRT (Bootstrap Likelihood Ratio Test) was statistically significant for four models (P<0.05). Considering the low values of AIC and BIC in the model with four classes, this model was chosen as the optimal model.
| Fit Indices | Number of Classes | ||||
|---|---|---|---|---|---|
| One Class | Two Classes | Three Classes | Four Classes | Five Classes | |
| AIC | 7434.19 | 7214.48 | 7091.15 | 6618.09 | 6676.50 |
| BIC | 7477.95 | 7278.43 | 7175.30 | 6712.33 | 6780.84 |
| BLRT test p-value | - | < 0.001 | < 0.001 | < 0.001 | < 0.001 |
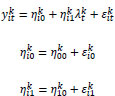
The result of fitting the mixed growth model for the optimal model with four classes is shown in Table 3, and the trend of the estimated changes of the classes is shown in Fig. (1). Also, the estimated means and observed individual values of mortality rate for each class are depicted in Fig. (2). The value of the entropy statistic for the selected model was calculated as 0.83. As a result, the quality of sample classification was good.
| Class | Trend | Intercept | Slope | Time Scores | Number of Countries (%) |
|---|---|---|---|---|---|
| Mean (SE) | Mean (SE) | ||||
| 1 | Non-linear | 0.00 (0.00) | 13.37 (1.75)* | (0, 1, 1.71, 1.63, 0.91) | 130 (0.60) |
| 2 | Non-linear | 0.03 (0.01)* | 114.43 (48.71)* | (0, 1, 0.87, 0.94, 0.29) | 3 (0.01) |
| 3 | linear | 0.001 (0.00)* | 17.92 (1.68)* | (0, 1, 2, 3, 4) | 80 (0.37) |
| 4 | Non-linear | 0.28 (0.00)* | 62.79 (0.66)* | (0, 1, 1.71, 0.76, 0.69) | 1 (0.004) |

| Class 1 | Class 2 | Class 3 | Class 4 |
|---|---|---|---|
| 130 (60.7)a | 3 (1.4) | 80 (37.4) | 1 (0.5) |
| Afghanistan, Algeria, Andorra, Angola, Argentina, Australia, Bahrain, Bangladesh, Belgium, Benin, Bhutan, Bolivia (Plurinational State of), Botswana, Brazil, Brunei Darussalam, Burkina Faso, Burundi, Cabo Verde, Cambodia, Cameroon, Canada, Central African Republic, Chad, Chile, China, Colombia, Comoros, Congo, Côte d’Ivoire, Cuba, Democratic Republic of the Congo, Djibouti, Dominican Republic, Ecuador, Egypt, El Salvador, Equatorial Guinea, Eritrea, Eswatini, Ethiopia, France, French Polynesia, Gabon, Gambia, Ghana, Gibraltar, Guatemala, Guinea, Guinea-Bissau, Haiti, Honduras, Iceland, India, Indonesia, Iraq, Ireland, Japan, Kazakhstan, Kenya, Kiribati, Kuwait, Kyrgyzstan, Lao People's Democratic Republic, Lesotho, Liberia, Libya, Luxembourg, Madagascar, Malawi, Maldives, Mali, Mauritania, Mayotte, Mexico, Montserrat, Morocco, Mozambique, Myanmar, Namibia, Nepal, Netherlands, New Zealand, Nicaragua, Niger, Nigeria, Norway, Oman, Pakistan, Panama, Papua New Guinea, Paraguay, Philippines, Portugal, Qatar, Republic of Korea, Rwanda, Saint Barthélemy, Saint Martin, Saint Pierre and Miquelon, San Marino, Sao Tome and Principe, Saudi Arabia, Senegal, Sierra Leone, Singapore, Solomon Islands, Somalia, South Africa, South Sudan, Sri Lanka, Sudan, Sweden, Switzerland, Syrian Arab Republic, Tajikistan, Thailand, The United Kingdom, Timor-Leste, Togo, Tunisia, Uganda, United Arab Emirates, United Republic of Tanzania, Uruguay, Uzbekistan, Venezuela (Bolivarian Republic of), Wallis and Futuna, Yemen, Zambia, Zimbabwe | Iran (Islamic Republic of), Peru, Spain | Albania, Anguilla, Antigua and Barbuda, Armenia, Aruba, Austria, Azerbaijan, Bahamas, Barbados, Belarus, Belize, Bermuda, Bonaire, Bosnia and Herzegovina, British Virgin Islands, Bulgaria, Cayman Islands, Costa Rica, Croatia, Curaçao, Cyprus, Czechia, Denmark, Dominica, Estonia, Faroe Islands, Fiji, Finland, French Guiana, Georgia, Germany, Greece, Greenland, Grenada, Guadeloupe, Guam, Guyana, Hungary, Isle of Man, Israel, Jamaica, Jordan, Latvia, Lebanon, Liechtenstein, Lithuania, Malaysia, Malta, Martinique, Mauritius, Monaco, Mongolia, Montenegro, New Caledonia, North Macedonia, Northern Mariana Islands (Commonwealth of the), occupied Palestinian territory, including east Jerusalem, Palau, Poland, Puerto Rico, Republic of Moldova, Réunion, Romania, Russian Federation, Saint Kitts and Nevis, Saint Lucia, Saint Vincent and the Grenadines, Serbia, Seychelles, Sint Maarten, Slovakia, Slovenia, Suriname, Trinidad and Tobago, Turkey, Turks and Caicos Islands, Ukraine, United States of America, United States Virgin Islands, Viet Nam | Italy |
| a Number (%) | - | - | - |
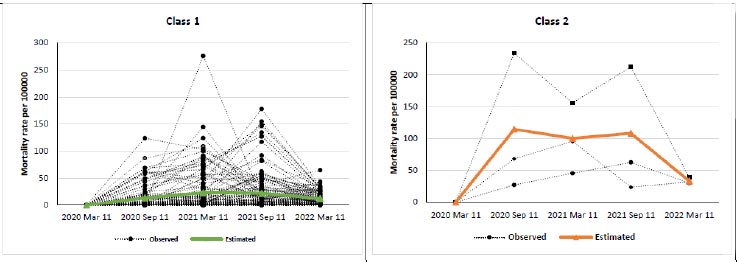
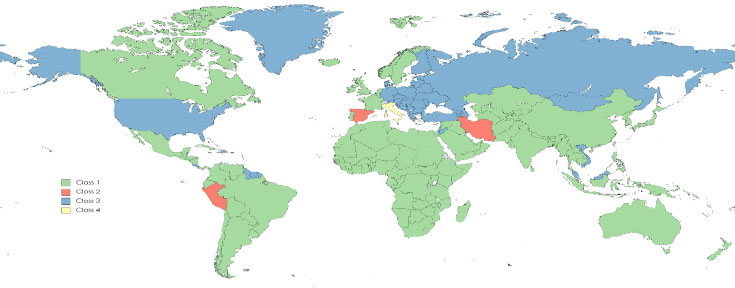
Fig. (3) hows the distribution of countries based on the class number, and Table 4 shows the countries of each class.
4. DISCUSSION
In this longitudinal study, an overview of worldwide deaths due to COVID-19 was provided using GMM, and countries all over the world were classified into four clusters with different trends of COVID-19 deaths. Similar studies have been conducted in this field, and different results have been achieved in different studies. Three to four clusters were obtained in terms of the trend of deaths caused by COVID-19 [15, 16]. The different results in the number of clusters and countries within them might be due to differences in the studies' methodology and period.
During the study period, the trend of death due to COVID-19 increased non-linearly by 11.63 people per 100,000 on average every six months. This increase will be alarming if it happens continuously, but when the results are analyzed in six-month periods, it becomes clear that this change is different in various periods. In the second period (September 11, 2020, to March 11, 2021), it increased the most with 22.67 per 100,000 people. However, in the third period (March 11, 2021, to September 11, 2021), it not only did not increase but also decreased drastically to 1.27 per 100,000 people. In general, the deaths caused by COVID-19 in the world increased in the first year of the pandemic, but in the second year, the trend faced a sharp decrease. This procedure showed that the trend of death due to COVID-19 in the world could not constantly be increasing, and it will decrease with the implementation of correct preventive measures. One of the essential preventive measures that played a prominent role in this reduction was the availability of the COVID-19 vaccine and the start of vaccination in the world. Although the first COVID-19 vaccine was introduced on December 8, 2020, it took months to vaccinate a relatively large population in the world [17], and this coincided with the third period of the study (March 11, 2020, to September 11, 2020) when the number of deaths had decreased sharply. Another reason for the decrease in the death rate due to COVID-19 in the second year of the study was the dominance of the Omicron variant, with a lower case fatality rate than previous dominant ones [18-20]. The trends of death due to COVID-19 in the studies conducted globally are similar and in line with the trends obtained in the present study [15, 16]. Given that the data are global and unique, the findings of this study in terms of death trends are near to those of others using global data with the same objectives [15, 16].
Although the results showed that the general trend of death due to COVID-19 in the world was increasing during the first year of the study, this increasing trend cannot be generalized to all regions of the world, and different countries have experienced different trends in death due to the COVID-19 [15, 16, 21, 22]. These differences in trends can happen for various reasons, including the time of the disease's first occurrence in a country [23], the readiness of the health care system and the available facilities and equipment, the percentage of people at risk [24-26], the percentage of the elderly population [24, 27], the level of population mobility [23], the quality of implementation of prevention protocols [28], the quality of education of the general population through the media [28], the timely action of the government in the implementation of lockdowns [23], the level of compliance with prevention protocols by people including non-gathering [23], use of masks [29], physical distancing [30], ventilation of closed environments [30], and most importantly the time of access to the vaccine and the percentage of vaccination coverage [31]. Also, reported cases depend on countries' sampling, testing and diagnosis capacity, and reporting policies [32], so comparing countries is a complex task. However, by clustering the countries based on the trend of COVID-19 deaths over time and comparing the clusters and the countries within each cluster, more accurate results can be achieved regarding the mentioned cases [23, 33].
Out of the four clusters, the highest increase in the death rate due to COVID-19 was related to cluster 2, including three countries, Iran, Peru, and Spain, where the average death rate in each period increased by 114.43 per 100,000 people. Although cluster 2 is a small cluster with only three countries, the increment of deaths in these countries is significant. This increment has various reasons in each country. In Iran, wrong decisions at the national level caused an increased number of gatherings in different places, such as shops, public transportation, banks, government offices, industrial settings, and other similar venues [34, 35]. Lack of proper programs for children and the elderly; monopoly on the distribution of essential foods leading to gathering in front of related shops; accumulation in clinics of medical centers and hospitals, medical offices, and private clinics at specific hours; closure of open-air public parks leading to gathering in closed places, lack of affordable face masks; and non-observance of prevention protocols by most people [34] were among the most important reasons of high mortality. In Peru, the most important factors were the lack of good prevention practices and disparities in rural and urban areas in good prevention practices against COVID-19 [36]; social factors, individual factors, the health care system, and other direct and indirect factors related to COVID-19 [37]; and high prevalence of obesity and its association with COVID-19 mortality [37]. Also, the main elements of high mortality in Spain included the overwhelming of hospitals, early infection and resting in quarantine of a disproportionate number of healthcare providers (doctors, nurses, and other healthcare providers), the shortage of diagnostic tests and personal protective equipment (like masks and gloves) causing healthcare providers to leave their jobs, large elderly population and high death rate among them, gatherings and demonstrations in the country, and lack of in-time prevention measures for strategic people [38]. However, in the studies conducted regarding the additional deaths of COVID-19, these countries had a relatively good situation in reporting the number of deaths due to COVID-19. They did not make a considerable underestimation [39, 40].
The lowest increase in the death rate caused by COVID-19 in each period belonged to cluster 1, which included about 60% of the world's countries, including Australia, Canada, China, India, Japan, all African countries, and most of Southeast Asia. In this cluster, the death rate due to COVID-19 increased by 13.37 per 100,000 people in each period. This finding can be interpreted from different dimensions. Perhaps, at first glance, this finding shows the more appropriate performance of the countries of this cluster in dealing with the deaths of COVID-19. However, with a deeper look at the countries within the cluster, it can be observed that highly developed countries, such as Japan, Canada, Australia, Sweden, and Norway and less developed countries, such as sub-Saharan African and Southeast Asian countries, are in this cluster. The performance of these countries in dealing with COVID-19 has been different in terms of the quantity and quality of personnel, healthcare facilities and equipment, and the capacity of sampling, testing, and case tracking [22, 41]. Therefore, low mortality in the cluster cannot be attributed solely to the better performance of the countries in this cluster, and the factors mentioned above are influential in this regard. On the other hand, the developing countries of this cluster have much higher death underestimation than the developed countries [39, 40], and perhaps this misclassification made them fall into the same cluster.
In cluster 3, most European countries, the United States, and a limited number of countries from South America and Southeast Asia are placed, which are mostly high-income or upper-middle-income countries. This cluster is considered the most homogeneous in terms of the development indicators of the countries within it. During the first six-month period of the study, the death rate in this cluster was higher than in others. From one point of view, this indicated the unpreparedness of the healthcare system of the countries of this cluster at the beginning of dealing with COVID-19. From another point of view, the touristic nature of most of these countries and their significant population movement caused the virus circulation to start earlier in these countries, which could be an essential factor in the increase in mortality [7]. Most of them were among the most prosperous countries in the world in controlling the epidemic in the later stages, including sampling, diagnosing, case-finding, and reporting deaths [7, 39, 40, 42].
Italy is the only country in the fourth cluster. Considering that there is only one country in this cluster, it can be viewed as an outlier instead of a cluster, and all countries can be classified into three clusters and one outlier. Regardless, the trend of death due to COVID-19 in this country is different from others. In Italy, the disease started with a rapid spread and reached its first peak in a short period, which is why the trend of death in this country is different from other countries. One of the main reasons for the rapid increase in the disease outbreak in Italy was the presence of various industries in the north of this country, with the presence of Chinese workers, most of whom were from Wuhan, the birthplace of COVID-19. This caused many trips from Wuhan to northern Italy, and even direct flights introduced on this route. As a result, it caused the early spread of the disease in Italy. Due to the very large number of older adults in northern Italy and the higher risk of infection and death for these people, considering that they were among the first people to be infected in Italy, the death trend in Italy was steeper than in other countries [4]. Another reason for the rapid increase in the death rate in Italy was the Champions League soccer match between Atalanta from Italy and Valencia from Spain in Milan on February 19, 2020. In this match, 45,792 spectators were present in the stadium, most of whom had traveled to Milan from Bergamo.
Furthermore, they hugged and kissed each other four times due to Atalanta's four goals. It is probably for this reason that Bergamo was known as the worst affected area of Italy in terms of the spread of COVID-19. In addition, there were 2,500 Spanish spectators at the stadium, who, after returning to Spain, caused an increase in the spread of the disease in this country. This is probably one of the reasons for the sharply increased death trend in Spain [4, 6].
In cases where many countries are compared in dealing with a disease, it is impossible to compare individual countries due to their multitude and the issue’s complexity. In such cases, although clustering is a valuable and effective method for easier comparison, it has limitations, such as the difference in the quality of data of different countries, which reduces the accuracy of the comparison. As a result, it cannot be concluded with confidence that the countries within each cluster acted the same. This may be considered the main limitation of the current study.
CONCLUSION
In this study, the trend of death due to COVID-19 in different countries has been clustered and compared. Our findings showed which countries performed better or worse in dealing with the COVID-19 pandemic. Therefore, by examining the actions taken in the countries that performed better in dealing with the COVID-19 pandemic, it is possible to identify the most effective measures for use in potential future pandemics. It is recommended that subsequent studies compare countries' policies, planning, and disease control measures to obtain helpful information to control potential future epidemics.
LIST OF ABBREVIATIONS
| WHO | = World Health Organization |
| GMM | = Growth Mixture Model |
| LGM | = Latent Growth Model |
| AIC | = Akaike Information Criterion |
| BIC | = Bayesian Information Criterion |
| SARS-CoV-2 | = Severe Acute Respiratory Syndrome Coronavirus 2 |
ETHICS APPROVAL AND CONSENT TO PARTICIPATE
Not applicable.
HUMAN AND ANIMAL RIGHTS
No humans/animals were used for studies that are the basis of this research.
CONSENT FOR PUBLICATION
Not applicable.
AVAILABILITY OF DATA AND MATERIALS
The data for the number of deaths due to COVID-19 are accessible on the WHO website (https://covid19.who.int), and data for the countries' populations are available on the United Nations website (https://population.un.org/wpp/Download /Standard/Population/).
FUNDING
None.
CONFLICT OF INTEREST
The authors declare no conflict of interest, financial or otherwise.
ACKNOWLEDGEMENTS
Declared none.

