All published articles of this journal are available on ScienceDirect.

Health System Responsiveness in the Primary Health in a Developing Country: Expectations and Experiences of Clients
Authors Info & Affiliations
Abstract
Background:
Healthcare responsiveness is an essential goal of health systems. Responsiveness focuses on the nonclinical aspects of healthcare and measures individuals; experiences. There is little knowledge about responsiveness in primary care; most responsiveness studies have focused on inpatient services.
Objectives:
This study aimed to assess the responsiveness of primary care in the Urmia District Health Network in northwestern Iran.
Methods:
Data collection was conducted at urban health centers. The data presented are from a single observational research project.
Results:
Two hundred forty regular clients were interviewed in selected urban health centers in the Urmia district health network. The mean total response score was satisfactory. Full access and easy receipt of services without discrimination were important and noteworthy results for responsiveness. Regarding respondents, expectations, dignity, and prompt attention were the most important domains, while provider choice and social support were the least important. The results showed no statistically significant differences between the mean responsiveness scores for ambulatory care and hospital services.
Conclusion:
Improvements in responsiveness domains increase convergence and alignment between clients' expectations and health system performance. In this context, dignity and prompt attention are essential.
1. INTRODUCTION
Healthcare responsiveness, or the extent to which the process of providing services is according to the patient's expectations [1], has been set as one of three overall goals in health systems [2]. The concept of responsiveness as a criterion of health systems performance was issued by the World Health Organization (WHO). It integrated a set of eight non-medical and non-financial domains [3].
Domains of responsiveness are divided into two categories: respect for humans and client orientation [4]. Responsiveness is different from patient satisfaction and quality of care [5] and focuses on non-clinical aspects of healthcare in the health system as a whole and measures through individuals' experiences. Satisfaction is generally restricted to healthcare facilities such as a hospital [6].
Patients' opinions are an excellent source of information about non-medical features of health care delivery in health systems [3], and responding to legitimate expectations of the public about how to deal with them is recognized as an essential part of the performance of health systems [7].
A review of the previous survey data showed that the importance of responsiveness domains is not equal to individuals [8]. The recommendation of the WHO is to measure responsiveness by referring to the experience of health system clients [7].
According to the World Health Report 2000, the Iranian health system was ranked 100 in responsiveness [2], which signaled acceptable responsiveness as a challenge in the country's health system [9, 10]. So, improving responsiveness was defined as one of the goals of the health reform plan in Iran in 2014 [11, 12].
The concept of responsiveness especially applies to Primary Care (PC) systems. Throughout their lives, the general population has more regular referrals and access to primary care than other healthcare services [13]. It provides permanent care to individuals to meet their health and non-health needs [14]. Primary care, the first level of contact between families and the health system, provides various services, mostly targeted to women and children [15].
However, most responsiveness studies have focused on the users of inpatient services in Iran, and little knowledge is available on responsiveness in primary care. This study aimed to assess the responsiveness in the healthcare system from the perspectives of primary care clients of primary care.
2. METHODS
2.1. Participants
This cross-sectional case study was carried out in the Urmia District Health Network (UDHN), the capital city of West Azerbaijan Province, in northwest Iran, for six months in 2017-2018. The data collection setting was urban health centers in five different areas of Urmia. The study population was 30,000 households covered by urban health centers. The sample size was calculated at 232 based on the active household records in health centers using Cochran's formula. The final sample was determined to be 240 records.
The number of calculated samples was proportionally distributed among selected health centers. Participants were selected purposively. The eligibility selection criteria for study participants were having an active household record and reference to the center in the past year.
2.2. Data Collection Instrument
The Persian version of the responsiveness questionnaire which was used in another study on health system responsiveness by the WHO, was used to collect data [16]. The questionnaire consisted of four sections: 1. Demographic and background information of the respondents; 2. health services utilization; 3. Questions related to the importance of responsiveness domains; and 4. Questions related to the participants' views about the level of responsiveness in the services delivered and problems. The validity and reliability of the questionnaire had already been confirmed [16] and used in several studies in Iran [11, 17, 18].
Likert response scales were used for Reporting items: [(Always, Usually, Sometimes, Never), or: (Same day, 1-2 days, 3-5 days, 6-10 days, More than 10 days)] and Rating items: (Very good, Good, Moderate, Bad, Very bad), or: (No problem, Mild, Moderate, Severe, Extreme Problem) to assess the perceptions and experiences of the respondents according to the WHO guidelines [8].
2.3. Data Collection
Data collection was conducted on a randomly selected day of the week. Data were gathered through face-to-face interviews by a trained interviewer in Persian, Turkish, and Kurdish languages and experienced in public health. A brief explanation was given before the interview on the project and its goals to the respondents. The interview included data on domains of responsiveness at the center and in the previous visit to the hospital (if they had visited).
The respondents were selected from the people who had previously visited the center and were visited on the day of data collection and were satisfied with the interview.
2.4. Statistical Analysis
All domains were assessed as "good responsiveness" (good or very good choices) or "poor responsiveness" (very bad, bad, and moderate options). Analyses were performed for both ambulatory and hospital services.
A pilot study was conducted (N = 15) in another center, and Cronbach's Alpha test showed that the items were internally consistent (α = 0.723). Data were analyzed using the SPSS statistical package (16.0 Version). Spearman and Pearson correlation coefficients were applied to explore the relationship between responsiveness and ordinal (education level) or scale (domains) variables. One-way analysis of variance (ANOVA) and independent t-tests were applied to compare the mean scores of the respondents’ perceptions and experiences. In all statistical analyses, P≤0.05 was considered significant. All tables and figures were prepared in Microsoft Excel.
Questionnaire completion was voluntary and anonymous, and the respondents verbally announced their and their minors' informed consent before the interview. Selected centers were numbered in Arabic numerals. The ethics committee approved the study by the deputy of research affairs at Urmia University of Medical Sciences (Reference number: IR.UMSU. REC.1396.40).
3. RESULTS
Two hundred forty regular clients were interviewed in selected urban health centers in UDHN, including 217 females (90.4%) and 23 males (9.6%). Fifteen to seventeen respondents from each center participated in the interviews on every selected day. The face-to-face interviews were conducted in centers without audio or visual recording to collect the data, as respondents were comfortable. Apart from the participant and researcher, no other person was at the interview site. The interviews lasted between 15 and 20 minutes. There was no repeated interview or taking notes during the interview. The mean (±SD) age of respondents was 34 (±12.8) years (Range: 16-69 years) (Table 1).
| S.No. | - | Variable | N | % | ||
|---|---|---|---|---|---|---|
| 1. | - | 16-25 | 63 | 26.3 | ||
| 26-35 | 98 | 40.8 | ||||
| 36-45 | 41 | 17.1 | ||||
| 46-55 | 10 | 4.2 | ||||
| 56-65 | 21 | 8.8 | ||||
| >66 | 7 | 2.9 | ||||
| 2. | Language | Turkish | 179 | 74.6 | ||
| Kurdish | 58 | 24.2 | ||||
| Persian | 3 | 1.3 | ||||
| 3. | Religion | Shia | 180 | 75 | ||
| Sunni | 60 | 25 | ||||
| 4. | Job Group | State | 15 | 6.3 | ||
| Non-state | 16 | 6.7 | ||||
| Housekeeper | 204 | 85 | ||||
| Unemployed | 5 | 2.1 | ||||
| 5. | Insurance Coverage | Yes | 234 | 97.5 | ||
| No | 6 | 2.5 | ||||
| 6. | Education | Illiterate | 29 | 12.1 | ||
| Elementary | 40 | 16.7 | ||||
| Guidance | 54 | 22.5 | ||||
| High school | 61 | 25.4 | ||||
| University | 56 | 23.3 | ||||
| Services\Domains | Ambulatory (N=240) | Hospital (N=100) | ||
|---|---|---|---|---|
| N | % | N | % | |
| Prompt attention | 154 | 68.2 | 82 | 82 |
| Dignity | 172 | 73 | 52 | 52 |
| Communication | 192 | 80 | 58 | 58 |
| Autonomy | 103 | 43 | 49 | 49 |
| Confidentiality | 175 | 73 | 51 | 51 |
| Choice of provider | 37 | 15.4 | 62 | 62 |
| Basic amenities | 187 | 78 | 65 | 65 |
| Social support | - | - | 73 | 73 |
3.1. Health Service Utilization
Among all 240 service users, 100 individuals (42%) had received hospital services during the past 12 months. The last healthcare visit was done during the past 30 days by 28.8% (n=69) and between 1 to 12 months by 68.7% (n=165) of respondents.
3.2. Responsiveness in UDHN
The performance of studied facilities in UDHN showed maximum and minimum good responsiveness, and poor responsiveness in ambulatory services was in communication (80%) and choice of provider (15.4%). In this regard, good responsiveness and poor responsiveness in hospital services were in prompt attention (82%) and autonomy (49%) domains, respectively (Table 2).
Comparison of ambulatory/hospital care showed that the maximum and minimum gaps were in the choice of provider and autonomy domains, respectively (Graph 1) [8].
Regardless of system usage, all respondents rated responsiveness as necessary or valuable. In this regard, 33% of the respondents (N=79) rated dignity as the most important domain, followed by prompt attention (N=33). However, only seven percent of the respondents (N=17) rated the choice of provider as the most important domain. The mean score of domains ranged from 3.12 to 3.81 in ambulatory care and 3.34 – 3.83 in hospital services. The mean score of authority was the same in both service groups.
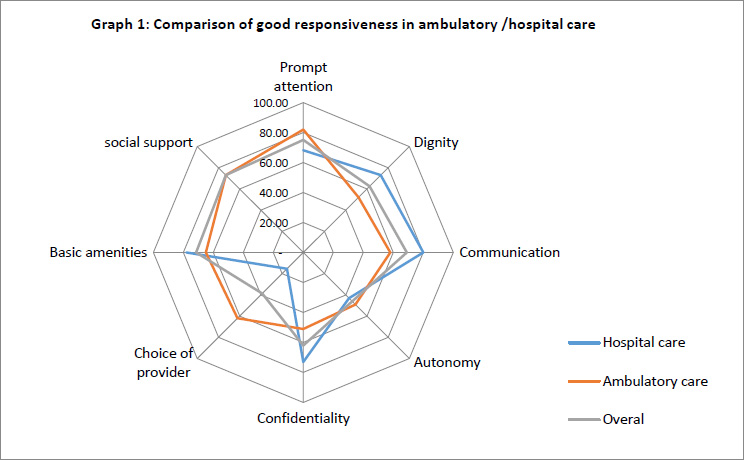
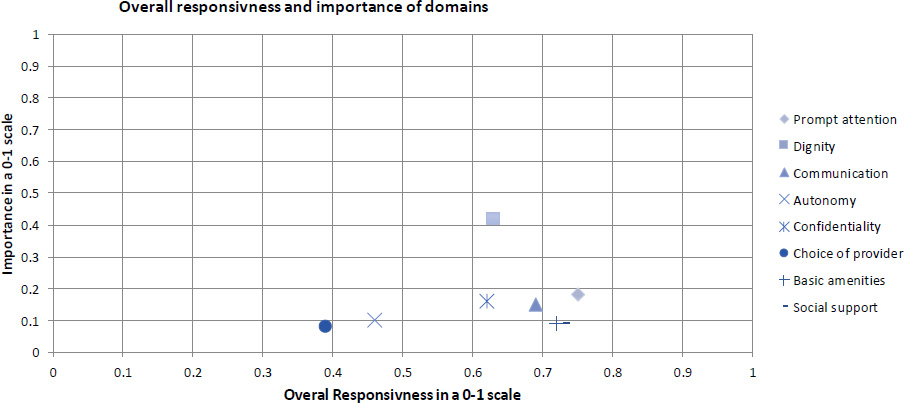
Fig. (1) shows the relative importance of responsiveness domains and the perceptions of responsiveness as poor or good (%) in a 0-1 interval. Dignity was rated as the most important domain with relatively high responsiveness performance. On the other hand, the choice of provider was ranked as the least important domain with poor responsiveness performance (Fig. 1) [8].
3.3. Openings, Discrimination and Problems in the UDHN
Respondents did not report restrictions or obstacles in accessing and receiving the necessary services. Service recipients have not declared discrimination in receiving services based on demographic and contextual characteristics, including gender, age, income, ethnicity, and illness. All of the prescribed respondents (5%) had access to prescriptions. There was no discrimination in ambulatory services. The insured respondents did not have financial problems. There were some problems with costs, access to information, and discriminatory treatment (Table 3). Two percent of respondents declared discrimination in receiving services from hospitals due to the lack of money (95% CI: 10.4% - 48.7%), and four percent due to social class (age group 26-25) (95% CI: 26.8% - 33.7%).
| S.No | Problems | (%) | N | "What" and "Why" |
|---|---|---|---|---|
| 1. | Bill discount (uninsured) | 1.3 | 3 | not relevant |
| 2. | Getting information | 9.2 | 22 | not relevant |
| 3. | Insurance registration | 2 | 5 | not relevant |
| 4. | Discrimination | 2 | 5 | hospitals services /the lack of money |
| 5. | Discrimination | 4 | 10 | hospitals services/ social class |
| First Author | Year of Research | Total Responsiveness | Social Support | Autonomy | Prompt Attention | Confidentiality | Communication | Dignity | Choice of Provider | Basic Amenities | |
|---|---|---|---|---|---|---|---|---|---|---|---|
| Ebrahimipour | 2015 | 50.6 | - | 56.7 | 32.1 | 63.8 | - | 76.3 | 30 | 47.1 | |
| Fazaeli | 2016 | 60 | - | 64 | 68.2 | 73.3 | 66.7 | 83.2 | 63 | 61.1 | |
| Sajjadi | 2015 | 67 | 78 | 52 | 63 | 76 | 70 | 85 | 63 | 63 | |
| Javadi | 2011 | 49.2 | 52.4 | 50 | 50 | 51.6 | 48.2 | 50 | 43 | 47.2 | |
| Zarei | 2016 | 64 | 72 | 62 | 62 | 68 | 64 | 64 | 54 | 72 | |
| Arab | 2015 | 74 | 70 | 78 | 74 | 72 | 74 | 78 | 74 | ||
| Total | - | 60.8 | 67.4 | 59.1 | 59.1 | 67.5 | 64.9 | 72.1 | 55.1 | 60.7 | |
| Current study | Ambulatory | 2018 | 61.5 | - | 43 | 68.2 | 73 | 80 | 73 | 15.4 | 78 |
| Hospital | 2018 | 61.5 | 73 | 49 | 82 | 51 | 58 | 52 | 62 | 65 | |
The mean score of responsiveness in ambulatory care and hospital care were 3.2±0.18 and 3.6± 0.42, respectively. The independent t-test showed no significant difference in the mean responsiveness score between ambulatory care and hospital services. Also, the independent T-test showed no significant difference between the mean responsiveness score in ambulatory care and hospital services based on insurance coverage and the gender of the respondents. There was significant difference between the mean responsiveness score and service utilization (P=000).
Analysis of variance (ANOVA) showed no significant difference among the mean scores of the ambulatory, hospital, and overall responsiveness based on age groups, occupation, and education. ANOVA showed a significant difference in the mean responsiveness score only in hospital services based on the clients of health centers as the health system components in different areas (P = 0.021). LSD test showed a significant difference between the mean score of responsiveness in centers number one and two (P = 0.049), centers number one and three (P = 0.01), and centers number three and four (P = 0.04).
Spearman test showed a high correlation and positive relationship between respondents' responsiveness and their education level (r = 0.838, P≤0.01). Pearson's test showed a direct and significant relationship among the domains of responsiveness (P≤0.01).
A comparison of past studies with current ones showed some similarities and differences in domains. Prompt Attention in hospital care and choice of provider in ambulatory care were remarkable. Generally, total responsiveness was almost the same (Table 4) [19].
4. DISCUSSION
The mean score of overall responsiveness showed that the responsiveness was satisfactory. Full access and easy receipt of services were key and noteworthy results of the responsiveness in UDHN. Also, regarding respondents' expectations, dignity and prompt attention were the most important, and choice of provider and social support were the least important domains.
The choice of provider for health centers is almost irrelevant. These facilities have a defined catchment area with determined households. On the other hand service recipients have fewer restrictions in choosing a hospital. Social support and continuous communication with family are important for hospitalized patients in Iran.
Respondents' experience of health system responsiveness showed that the performance of studied facilities was good in communication and social support domains.
The mean score of overall responsiveness was similar to those in Turkey [20], China [21], and Iran [22, 23]. Low levels of responsiveness may lead to inadequate access to health care [24], whereas good responsiveness can lead to full utilization of services.
In this study, the most important domains of responsiveness were dignity and prompt attention, alongside earlier studies, were considered more important than other domains, including Baharvand [22], Valentine et al. [25], Vitrai [26], Kowal [21] and Liabsuetraku et al. [27]. In the study of Vemuri, respondents rated prompt attention and dignity as the most important domains [28]. In the project Of WHO, prompt attention was proposed as the most important domain, and communication and dignity were placed in the following ranks [8].
The findings of this study did not show a significant relationship between sex and domains of responsiveness, which is consistent with studies of Baharvand [22], Fazaeli [29], and Rashidian [30] and contrary to the study of Mohammadi [31] and Sajjadi [32]. Since people's desires depend on their current possessions, their viewpoints about responsiveness are affected by their perceptions about their standard of living, e.g., facilities, income, and expectations.
People may have different expectations in different regions of a metropolis or a country with diverse demographic and background characteristics. This issue can also explain the difference between the mean responsiveness scores in studied centers.
Patient satisfaction would be achieved by providing services and immediate action and reducing waiting times. Numerous studies have reported that people from different cultures, political systems, languages, beliefs, and level of life evaluated similar health system experiences differently [33].
Rashidian reported no significant differences in the rank of responsiveness domains in terms of sex, education, ethnicity, marital and socioeconomic status in the outpatient and inpatient services [30]. These results were consistent with the present study, so service user variables had no significant effect on responsiveness, but mean responsiveness scores were significantly different among selected centers.
In the present study, the worst-performing domain in ambulatory care was the choice of provider. This finding was in line with the studies done in Iran [12] and Germany [34]. Also, Nejru reported that most users declared they didn't have a choice about the provider [35]. The healthcare delivery networks belong to the Ministry of Health and run through its district health networks in Iran.
In a study published in Iran (2014), the fragile performance in ambulatory services was in the choice of provider and prompt attention domains. In ambulatory care, the weakest performance was related to the autonomy domain. Confidentiality had the best functional status of the health system in terms of responsiveness, and overall responsiveness in ambulatory care was better than in hospital services [16]. In the present study, the two domains of communication and social support had the best, and the choice of provider had the weakest position. Also, the low position of social support can indicate satisfaction with this domain or a change in the level of expectations, which has a lower rank than other domains.
In the study of Karami-Tanha, 12% of the respondents declared the existence of discrimination in receiving services. The Reasons for discrimination were lack of private insurance and low income [16]. In the present study, discrimination was reported in a much lower proportion, and the causes were socioeconomic issues and information.
In another study in public rehabilitation clinics in Iran (2017), the three domains of dignity, autonomy, and prompt attention had the best position. The quality of basic amenities had the lowest score [36]. Technical factors and equipment are decisive and necessary in rehabilitation and physiotherapy clinics. The performance of these units depends on the availability of equipment and supplies, so the quality of basic amenities in these units is crucial.
Bahravand, in 2019 reported the highest responsiveness in the social support domain and the least in the choice of provider and autonomy domains. According to the respondents' viewpoints, the most important domains were prompt attention and dignity [22].
Self-reporting on experiences with the health system depends on what expectations a person has regarding that experience. Responses regarding the same care experience may vary among respondents if their expectations vary substantially [8]. People may have different expectations in different regions of a metropolis or a country with diverse demographic and background characteristics.
CONCLUSION
Improving responsiveness reduces the gap between clients' expectations and the health system's performance. Two domains of dignity and choice of provider as indicators of patient rights and the quality of basic amenities as indicators of patient orientation showed the enormous gap in the overall responsiveness.
Increasing community expectations and raising awareness of patient rights indicate the need to pay attention to responsiveness. Information on the importance of responsiveness can help policymakers to prioritize non-medical improvements in the health system. Responsiveness can also be considered in health care reform programs and strengthen the position of non-medical aspects of the patient's expectations.
LIMITATIONS
Since several care recipients were children (under 18 years), interviews were conducted with their guardians.
AUTHORS' CONTRIBUTIONS
SA, BN and HY contributed to the conception and design. BN and SA substantially contributed to the acquisition of data. BN and HY contributed to the analysis and interpretation of data. BN and JAI drafted the article. BN, JAI and HY contributed to the final approval of the version to be published.
LIST OF ABBREVIATIONS
| PHC | = Primary Health Care |
| WHO | = World Health Organization |
| UDHN | = Urmia District Health Network |
ETHICS APPROVAL AND CONSENT TO PARTICIPATE
This project was approved by the Research Ethics Committee at Urmia Medical Science University (approval code: IR.UMSU.REC.1396.40). All methods were performed in accordance with the relevant guidelines and regulations. The respondents verbally announced their informed consent before the interview.
HUMAN AND ANIMAL RIGHTS
No animals were used in this research. All procedures performed in studies involving human participants were in accordance with the ethical standards of institutional and/or research committees and with the 1975 Declaration of Helsinki, as revised in 2013.
STANDARDS OF REPORTING
COREQ guidelines were followed.
AVAILABILITY OF DATA AND MATERIALS
The datasets used and/or analyzed during the current study are available from the corresponding author [B.N] on reasonable request.
FUNDING
This research received no specific grant/fund from any funding agency in the public, commercial, or not-for-profit sectors.
CONFLICT OF INTEREST
The authors stated that there is no case of conflict of interest.
ACKNOWLEDGEMENTS
Thanks should go to the University Vice Chancellor of Research and Technology, Vice Chancellor of Health Affairs, and UDHN authorities who helped in conducting the project. The supervisors of selected centers are sincerely appreciated for their cooperation.

