All published articles of this journal are available on ScienceDirect.

Relationship between Parental Head Circumference and Birth Type: A Pilot Study
Authors Info & Affiliations
Abstract
Aim:
Is there an association between Parental Head Circumference and Birth Type?
Background:
A mismatch between fetal size, especially the fetal head, with the mother's pelvis, also known as cephalo-pelvic disproportion (CPD), can lead to obstructed labor and, ultimately, cesarean section. However, so far, not much focus has been done on the father's anthropometric indices along with maternal anthropometric indices, especially head circumference (HC) and pelvic dimensions in the birth type and prediction of cesarean risk.
Objective:
In this study, anthropometric parameters of parents, such as height, weight, HC, and pelvic circumference and their relationships with the birth type in the first pregnancy, have been studied.
Methods:
This cross-sectional pilot study was conducted on healthy couples over 18 years of age. The mothers were primiparous, which had their first and full pregnancies with natural vaginal delivery or cesarean section (without elective cesarean). A trained expert measured the anthropometric data of parents, and the babies ‘data were collected from the neonatal record. Result: 33 cases completed full-term pregnancy, and of these mothers, 23 (69.7%) experienced natural vaginal deliveries (NVD) and 10 (30.3%) cesarean section (CS). The mean of the parent's HC in the CS group was significantly higher than those in the NVD group.
Conclusion:
The results showed that an increased average size of the parent's HC, especially in the mother with a smaller pelvic size, can logically increase the risk of cesarean section.
1. INTRODUCTION
Obstructed labor means the lack of labor progression due to mechanical problems, such as a mismatch between fetal size, especially the fetal head, with the mother's pelvis or cephalo-pelvic disproportion (CPD), which can lead to stopping normal delivery and, ultimately, cesarean section [1, 2]. This disproportion can not only hurt the birth canal but also may lead to asphyxia and increase the chance of an infant's death [3]. Therefore, examination of the obstetric diameters is one of the vital parts of decision-making for the delivery type [4]. In other words, predicting this issue is vital in preserving the health of the mother and the infant [5]. On the other hand, the dimensions and weight of the infant also play a special role in passing through the birth canal and practically determining the birth type [6]. Because several factors affect the phenotype and weight of the newborn and consequently predict the birth type [7], examining the mother's pelvimetry alone cannot be a good indicator to determine the birth type [8].
Nowadays, anthropometric findings have a crucial role in understanding human development and a special effect on community health [9]. On the other hand, the genetics and phenotypes of each parent are closely related to the formation of neonatal phenotype during the embryonic period [10-12]. Some studies in recent years have shown that anthropometric indices of parents can be associated with fetal size, birth type, and complications of childbirth [13-16]. However, most studies have only studied maternal height and weight. For example, a very short maternal height (<150 cm) can be one of the causes of CPD [17] and has been reported as a risk factor in childbirth [18]. Also, maternal height and the outer pelvic width (distance between two greater trochanters) have been introduced as two predictors of CPD and increased risk of cesarean section [19]. However, conflicting reports have been specified about the effects of maternal height on neonatal weight. So, maternal height is not the only influential factor in infant phenotype, weight, and subsequent labor problems [20]. Although some maternal anthropometric data help determine and predict the birth type [21], few studies have been conducted on other anthropometric indices of the mother, such as head circumference (HC), pelvic circumference, and so on.
It seems that most studies have been conducted on mothers and few studies on fathers' anthropometric indices and the simultaneous effect of parental phenotypes on the birth type. For example, few studies on the father-baby relationship have shown that height and even father weight are vital factors in infant weight during birth [22, 23]. Although no relationship has been observed between the father's height and the risk of childbirth problems [15], it has been reported that a very tall father or a very short mother are both risk factors for high-risk childbirth [24]. More research is needed to investigate the father-baby relationships and genetic mechanisms that affect fetal growth [14].
As mentioned above, among a small number of anthropometric studies on parents of newborns, longitudinal variables, such as their height, have been investigated more, and no study has been done on transverse and circumferential parameters, such as HC and pelvic circumference and their relationships with birth type. One of the vital parameters in human anthropometry is HC in its largest part, which is usually measured in infants and children up to the age of 5 as part of routine child care in growth assessment to provide information about health, growth, and nutrition [25]. HC and height are higher in men than women, and a direct correlation is observed between them in the whole population [26].
Since nearly half of the genetic pool of the children belongs to the father, its epigenetics and phenotypes, such as height and HC, can be associated with the anthropometric coordinates of the newborn and, accordingly, the birth type and the risk of cesarean section (CS). In other words, a newborn that is a genetic product of the total outcome of the parent’s genome must cross the pelvic canal during delivery, whose dimensions are subject to maternal anthropometrics. In this pilot study, in addition to common metric and longitudinal anthropometric indices, such as parental height, other circumferential and transverse anthropometric indices of parents, such as HC, pelvic circumference and width, and their relationships with the birth type in the first pregnancy, have been studied. We also investigated the probability of presenting models in predicting the birth type.
2. MATERIALS AND METHODS
2.2. Setting Study
This pilot study was conducted on 33 healthy couples over 18 years of age referred to selected health centers in Arak City, Iran, between March 2021 and March 2022.
2.3. Sampling Methods
The four regions of Arak City were considered clusters. We selected one health center from each region by simple random sampling. Then, couples were selected by convenience sampling.
2.4. Participants
The mothers were primiparous women who experienced first and full pregnancies with NVD or CS (without elective cesarean). They have entered the study after signing a written consent form. 2.2. Data for 2.2.
2.5. Data for Analysis
Trained experts measured anthropometric information of infants and parents. Anthropometric data, including HC, weight, and height of the baby at birth, were collected from the neonatal record. Then, parents' anthropometric indices, such as height, weight, HC, chest circumference, pelvic circumference and width (distance between two greater trochanters), waist circumference, and foot length, were measured by the related instrument (including tape meter,
3. RESULTS
3.1. Obstetric Variables
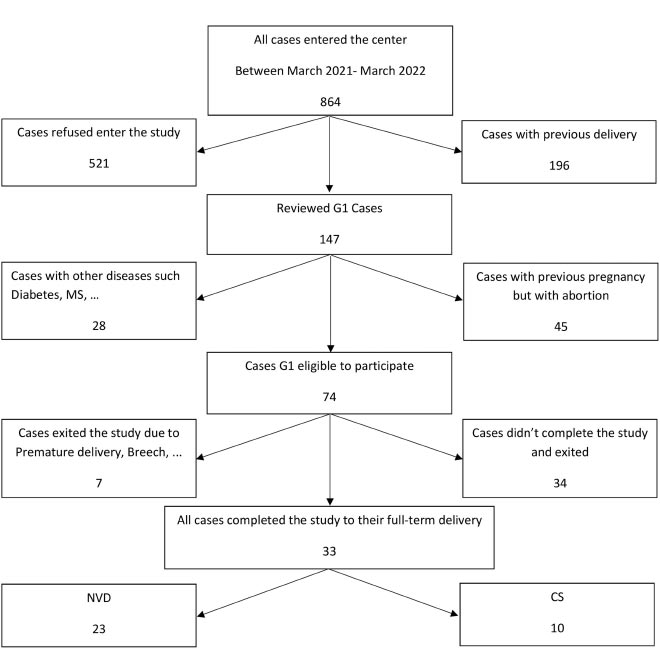
In the present study, 33 cases completed full-term pregnancy, and of these mothers, 23 (69.7%) experienced NVD, and 10 (30.3%) CS based on gynecologist diagnosis (Fig. 1). Of 33 babies born, 18 (55%) were boys, and 15 (45%) were girls.
3.2. Descriptive Data of Anthropometric Variables in All Parents
Table 1 provides descriptive statistics of the entire anthropometric information on measured maternal and paternal parameters of the newborn. In the study of different anthropometric indices measured, in most cases, such as height, weight, HC, chest circumference, waist circumference, and foot length, the size of these traits in men or all fathers was greater than those in women or mothers (Table 1).
| Trait | Paternal (Mean± SD) | Maternal (Mean± SD) |
|---|---|---|
| Age (year) | 33.63 ± 4.78 | 31.12 ± 5.97 |
| Height (cm) | 177.60 ± 6.42 | 164.96 ± 4.90 |
| Weight (kg) | 82.33 ± 9.33 | Before:64.09 ± 11.04 After:75.63 ± 12.41 |
| BMI (kg/m2) | 26.06 ± 4.37 | Before:23.52 ± 3.91 After: 27.78 ± 4.37 |
| Head Circumference (cm) | 57.93 ± 1.76 | 55.87 ± 1.70 |
| Chest Circumference (cm) | 104.09 ± 7.54 | 98.54 ± 7.82 |
| Pelvic Circumference (cm) | 99.81 ± 8.00 | 101.24 ± 7.99 |
| Pelvic Width (cm) | 40.66 ± 6.03 | 38.57 ± 3.92 |
| Wrist Circumference (cm) | 18.51 ± 1.30 | 16.21 ± 0.89 |
| Foot Length (cm) | 26.84 ± 1.41 | 24.30 ± 1.38 |
3.3. Relationships between Different Anthropometric Variables in Parents by Gender
By examining the Pearson correlation coefficient between the shared anthropometric indices of all parents by men and women and regardless of the birth type, it was observed that height in men had a moderate correlation with their weight (Table 2). However, no relationship was observed between heights and weights -before and also after pregnancy- in women. Also, height in both men and women in this study was a low correlation with HC. A low correlation was observed between HC in men and all the parameters measured in this study. However, in all mothers in the present study, HC had a low correlation with chest circumference and weight at the end of the pregnancy (Table 2). Wrist circumference had a moderate correlation with the father's height, but this was a low correlation in mothers. Also, a moderate correlation was observed between wrist circumference and weight and pelvic circumference in both men and women. (Table 2). Foot length was moderately correlated in men with height, weight, and wrist circumference, but a low correlation between Foot length was significant only with their height in women (Table 2). Comparing body mass index (BMI) with different parameters in men and women, it was found that BMI was moderately correlated only in women and with chest circumference and pelvic dimensions (Table 2).
3.4. Comparing Anthropometric Variables of Newborns by Gender
Table 3 presents newborns' anthropometry information in this study, so the average HC in the girls (35.40±1.35mm) was less than the boys (36.72±1.81mm). Also, the average weight of girls (3.02±0.41kg) was less than boys (3.49±0.66kg).
| - | Women | - | Men | |||||||||||||||||||
|---|---|---|---|---|---|---|---|---|---|---|---|---|---|---|---|---|---|---|---|---|---|---|
| - | - | 1. | 2. | 3. | 4. | 5. | 6. | 7. | 8. | 9. | 10. | - | - | 1. | 2. | 3. | 4. | 5. | 6. | 7. | 8. | |
| 1. | Height | - | - | - | - | - | - | - | - | - | - | 1. | Height | - | - | - | - | - | - | - | - | |
| 2. | Weight | After | 0.30 | - | - | - | - | - | - | - | - | - | 2. | Weight | 0.66** | - | - | - | - | - | - | - |
| 3. | Before | 0.34 | 0.93** | - | - | - | - | - | - | - | - | |||||||||||
| 4. | Head circumference | 0.24 | 0.42* | 0.29 | - | - | - | - | - | - | - | 3. | Head circumference | 0.33 | 0.26 | - | - | - | - | - | - | |
| 5. | Chest circumference | 0.13 | 0.77** | 0.70** | 0.43* | - | - | - | - | - | - | 4. |
Chest circumference |
-0.07 | 0.15 | 0.21 | - | - | - | - | - | |
| 6. | Pelvic circumference | 0.10 | 0.68** | 0.79** | 0.08 | 0.54** | - | - | - | - | - | 5. | Pelvic circumference | 0.33 | 0.47** | 0.2 | 0.48** | - | - | - | - | |
| 7. | Pelvic width | 0.21 | 0.42* | 0.41* | 0.11 | 0.28 | 0.45** | - | - | - | - | 6. | Pelvic width | 0.40* | 0.26 | 0.33 | 0.08 | 0.45** | - | - | - | |
| 8. | Wrist circumference | 0.12 | 0.59** | 0.64** | 0.08 | 0.58** | 0.51** | 0.21 | - | - | - | 7. | Wrist circumference | 0.57** | 0.54** | .34 | 0.20 | 0.56** | .49** | - | - | |
| 9. | Foot length | 0.38* | -0.08 | -0.02 | 0.03 | -0.03 | -0.13 | -0.14 | 0.12 | - | - | 8. | Foot length | 0.56** | 0.37* | 0.33 | -0.07 | 0.33 | 0.23 | 0.57** | - | |
| 10. | BMI | Before | 0.03 | 0.87** | 0.95** | 0.22 | 0.70** | 0.80** | 0.35* | 0.65** | -0.14 | - | 9. | BMI | 0.04 | 0.77** | 0.07 | 0.24 | 0.32 | -0.01 | 0.23 | 0.03 |
| 11. | After | -0.05 | 0.94** | 0.86** | 0.34 | 0.73** | 0.69** | 0.35* | 0.58** | -0.21 | 0.92** | |||||||||||
BMI: Body mass index.
| - | Gender | N | Mean± SD | Total (Mean± SD) |
|---|---|---|---|---|
| Child head Circumference (cm) | Girl | 15 | 35.4 ± 1.35 | 36.12 ± 1.72 |
| - | Boy | 18 | 36.72 ± 1.80 | |
| Child chest Circumference (cm) | Girl | 15 | 37.33 ± 3.86 | 38.12 ± 3.47 |
| - | Boy | 18 | 38.77 ± 3.05 | |
| Child pelvic Circumference (cm) | Girl | 15 | 35.13 ± 3.37 | 35.72 ± 3.98 |
| - | Boy | 18 | 36.22 ± 4.46 | |
| Child Pelvic Width (cm) | Girl | 15 | 13.33 ± 1.58 | 14.00 ± 1.87 |
| - | Boy | 18 | 14.55 ± 1.94 | |
| Child Height (cm) | Girl | 15 | 49.93 ± 3.3 | 51.15 ± 3.84 |
| - | Boy | 18 | 52.16 ± 4.04 | |
| Child Weight (kg) | Girl | 15 | 3.01 ± 0.41 | 3.27 ± 0.6 |
| Boy | 18 | 3.49 ± 0.66 | ||
| Child Wrist Circumference (cm) | Girl | 15 | 9.00 ± 0.92 | 9.00 ± 0.96 |
| - | Boy | 18 | 9.00 ± 1.02 | |
| Child Foot Length (cm) | Girl | 15 | 8.40 ± 0.91 | 8.51 ± 0.98 |
| - | Boy | 18 | 8.61 ± 1.05 |
3.5. Comparing Parental Anthropometric Variables Based on the Birth Type
Table 4 presents the values of parents' anthropometric data by birth type. Different anthropometric parameters of the parents between the two groups of natural delivery and cesarean section, the father's HC, the mother's HC, and the mean of the parent's HC in the cesarean section group, were higher than those in the natural delivery group. Maternal weight at the end of pregnancy in the CS group was higher than that in the NVD group. The average weight gain of mothers during pregnancy in the CS group (14.30 ± 5.74 kg) was higher than the average weight gain of mothers during pregnancy in the NVD group (10.35 ± 3.75 kg) (P<0.05).
| - | Birth Type | No | Mean± SD | |
|---|---|---|---|---|
| Maternal age (year) | NVD | 23 | 30.17 ± 5.98 | |
| - | CS | 10 | 33.3 ± 5.63 | |
| Paternal age (year) | NVD | 23 | 32.91 ± 5.43 | |
| - | CS | 10 | 35.3 ± 2.21 | |
| Maternal height (cm) | NVD | 23 | 164.47 ± 4.47 | |
| - | CS | 10 | 166.1 ± 5.87 | |
| Paternal height (cm) | NVD | 23 | 177.52 ± 6.67 | |
| - | CS | 10 | 177.8 ± 6.14 | |
| Maternal weight Before (kg) | NVD | 23 | 62.82 ± 10.66 | |
| - | CS | 10 | 67 ± 11.94 | |
| Maternal weight After (kg) | NVD | 23 | 73.17 ± 11.73 | |
| - | CS | 10 | 81.3 ± 12.64 | |
| Paternal weight (kg) | NVD | 23 | 82 ± 9.9 | |
| - | CS | 10 | 83.1 ± 8.3 | |
| Maternal Head circumference (cm) | NVD | 23 | 55.34 ± 1.55 | |
| - | CS | 10 | 57.1 ± 1.44 | |
| Paternal Head circumference (cm) | NVD | 23 | 57.47 ± 1.64 | |
| - | CS | 10 | 59 ± 1.63 | |
| Maternal Chest circumference (cm) | NVD | 23 | 97.08 ± 7.59 | |
| - | CS | 10 | 101.9 ± 7.66 | |
| Paternal Chest circumference (cm) | NVD | 23 | 103.78 ± 7.07 | |
| - | CS | 10 | 104.8 ± 8.89 | |
| Maternal Pelvic circumference (cm) | NVD | 23 | 101.08 ± 8.87 | |
| - | CS | 10 | 101.6 ± 5.87 | |
| Paternal Pelvic circumference (cm) | NVD | 23 | 99.82 ± 8.41 | |
| - | CS | 10 | 99.8 ± 7.37 | |
| Maternal Pelvic Width (cm) | NVD | 23 | 39.17 ± 3.93 | |
| - | CS | 10 | 37.2 ± 3.7 | |
| Paternal Pelvic Width (cm) | NVD | 23 | 40.95 ± 5.97 | |
| - | CS | 10 | 40 ± 6.46 | |
| Maternal Wrist Circumference (cm) | NVD | 23 | 16.21 ± 0.73 | |
| - | CS | 10 | 16.2 ± 1.22 | |
| Paternal Wrist Circumference (cm) | NVD | 23 | 18.39 ± 1.11 | |
| - | CS | 10 | 18.8 ± 1.68 | |
| Maternal Foot Length (cm) | NVD | 23 | 24.26 ± 1.38 | |
| - | CS | 10 | 24.4 ± 1.42 | |
| Paternal Foot Length (cm) | NVD | 23 | 26.78 ± 1.50 | |
| - | CS | 10 | 27 ± 1.24 | |
| Paternal Height Difference (cm) | NVD | 23 | 13.04 ± 7.15 | |
| - | CS | 10 | 11.7 ± 5.96 | |
| Mean Parental Head Circumference (cm) | NVD | 23 | 56.41 ± 1.1 | |
| - | CS | 10 | 58.05 ± 1.06 | |
| Difference of MHC and MPW (cm) | NVD | 23 | 16.17 ± 3.97 | |
| - | CS | 10 | 19.9 ± 3.24 | |
| Difference of PHC and MPW (cm) | NVD | 23 | 18.3 ± 4.17 | |
| - | CS | 10 | 21.8 ± 3.88 | |
| MWD (kg) | NVD | 23 | 10.34 ± 3.74 | |
| - | CS | 10 | 14.3 ± 5.73 | |
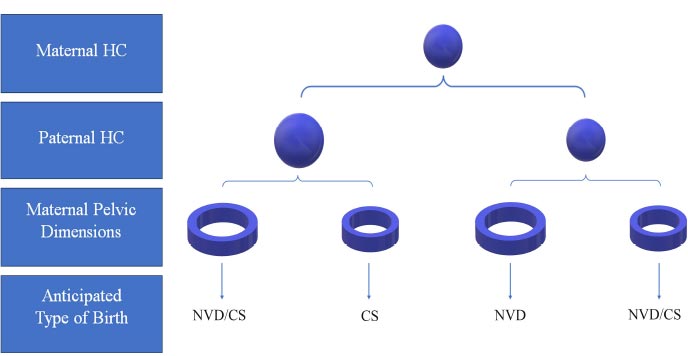
Comparing the proposed indices using the anthropometric measurements obtained from parents, such as the difference between the mother's HC size and the width of her pelvis, as well as the difference between the father's HC and the mother's pelvic width between the two groups, we found that these values were higher in the CS group than the NVD group, (Table 4 and Fig. 2).
Also, comparing anthropometric indices among naturally born infants and cesarean section, the difference was observed only in infants ‘foot length, which was higher in babies in the CS group,
4. DISCUSSION
The results of the current pilot study showed that the mean HC of the parents is a better index to predict the delivery type in the first delivery than other parental anthropometric parameters such as parental height difference [24] or maternal height [27]. According to some studies, the taller height of the mother has also reduced the risk of cesarean section, and the short height of the mother has increased the risk of cesarean section [28, 29]. In the present study, no relationship was observed between the height of the parents and the birth type and the increased risk of cesarean section. Although this relationship may be correlated in a larger population, the results of our pilot study showed that in the same population, the mean HC of parents is a better index to predict the delivery type. Our analysis showed that with each centimeter increase in the mean HC of the parent, the risk of cesarean section increases three times.
Comparing the anthropometric indices between men and women participating in this study regardless of their child’s birth type, showed that most of the measured parameters in men, except for the circumference and width of the pelvis, were more significant than those in women, which is consistent with the data obtained in previous studies [30-33].
In the present study on the relationships between the various parameters in men and women by gender, it was observed that the heights of men correlate with weight, pelvic width, wrist circumference, and foot length but are independent of the body's circumferential and transverse sizes, such as the HC, chest, and pelvis circumference. This means that men of the same height can have heads with different dimensions especially different HC, and these two anthropometric indices are not correlated tightly. Based on our findings, no correlation was seen between the sizes of the HC and any of the recorded sizes in men, which indicates that the size of the HC is almost independent of other anthropometric parameters. In men, the wrist circumference had a relationship with most other parameters. Nevertheless, this variable in women was only related to pelvic dimensions and weight. It can be said that due to the lack of pelvic changes for the preparation of childbirth in men, there is a synchronization in the growth of most parts of the body, especially in their length.
Overall, regardless of the birth type, it can be said that more correlation is observed between the demographic parameters in men than in women. For example, a correlation was observed between the chest circumference, the pelvic width, the wrist circumference, and even the fathers' weight with their height. However, no relationship was observed between any of the circumferential and longitudinal parameters of the mothers. Pelvic dimensions in women, although independent of height, were related to the mother's weight both before and at the end of pregnancy. This finding suggests that the circumferential parameters of the mother as an influential factor can be effective in the process of inheritance as well as in the birth type by forming different pelvic dimensions. It means that women of the same height have pelvises in different dimensions that may put some of them through a problem such as obstruction in the birth canal during labor. Unlike men, no relationship was observed between their height and weight (not before pregnancy and not after pregnancy) in women. The HC size of women, like men, was independent of most parameters but interestingly had a correlate with the weight at the end of pregnancy. Therefore, based on the results of this pilot study, it seems that the HC size in both men and women is independent of most longitudinal parameters.
As described above, no relationship was observed between the HC size of the fathers and mothers with their heights and their pelvic dimensions. However, the mother's weight at the end of pregnancy was a function of the HC size of the mother, and in mothers with cesarean delivery, the average HC size of the mother and the increased weight at the end of pregnancy was higher than the mothers with NVD. Consistent with our results, Whiter et al. showed that mothers with more increase in their weight during pregnancy have a higher risk of cesarean section [34]. Scott et al. also reported that the average weight of infants born with cesarean section is higher than that of infants born with normal delivery [35]. Whiter et al. also reported the average weight of infants more than 3500 g as a risk factor for cesarean section [34].
On the other hand, the mother's height will lead to more weight gain for the baby [36]. In a study, it was reported that the mother's HC was correlated to the fetal HC and the baby's weight, but the relationship of the mother's HC with the birth type had not been investigated [14]. However, Lipshoetz showed that the infant's HC is more important than the infant's weight in predicting cesarean section [37]. Therefore, it seems that the HC size of the mother, along with more weight gain at the end of pregnancy, will be accompanied by baby weight gain and size, which can be a factor in increasing the risk of cesarean section.
The size of the baby's head, like its other parts, is obviously affected by the epigenetics of the parents, and it can be indirectly related to the size of the parent's head [38]. In examining the anthropometric parameters of infants by gender and regardless of the birth type, it was observed that the average HC and weight of boys at birth is more than that of girls, similar to previous studies [15]. However, was observed between the pelvic dimensions of male and female infants, as well as their wrist circumference and foot length. Also, in this study, no relationship was observed between the baby's gender and the birth type. However, some previous studies showed that male babies are more exposed to the failure of delivery progression due to their heavier weight [39]. Of course, due to the multifactorial nature of the reasons for deciding to have a cesarean section and its relationship with gender [40], more studies on a larger population are needed in this issue. It should be mentioned that most couples referred to our center rejected participating in this study during the COVID-19 pandemic due to the extra time we asked them to stay in for further measurements. The HC size of babies delivered by cesarean compared to the NVD group was also larger, but this, which seems to be due to the small number of cases in this pilot study. However, although in the regression model, no correlation was observed between the parental anthropometric parameters and babies' phenotype, the average HC of parents in the cesarean delivery group was the probability of cesarean delivery.
CONCLUSION
It seems that the larger size of the mother's HC, considering its potential effect in increasing the mother's weight at the end of pregnancy along with an external factor, i.e., the paternal epigenetics (which can affect the different growth of the fetus and, consequently increase in the baby's weight and dimensions), and no relationship between the size of the mother's HC and her pelvic dimensions, can affect the risk of cesarean section. Also, in this pilot study, the average size of the parent's HC and the weight gain during pregnancy in the CS group was higher than in NVD, which confirms this hypothesis.
Therefore, an increase in the average size of the parent's HC, especially in couples in that the mother has a smaller pelvic width, can logically increase the risk of cesarean section by increasing the size of the baby, especially the baby's head. However, other factors, such as maternal nutrition, environment, underlying diseases, and so on, can effectively increase or reduce this risk, which requires further cohort studies. The limitation is that the study is a pilot study and had low participants because of the Coronavirus.
LIST OF ABBREVIATIONS
| CPD | = Cephalo-pelvic Disproportion |
| HC | = Head Circumference |
| NVD | = Natural Vaginal Deliveries |
| CS | = Cesarean Section |
ETHICS APPROVAL AND CONSENT TO PARTICIPATE
The approved research project was approved by the Ethical Committee of Arak University of Medical Sciences with the approval number IR.ARAKMU.REC.1399.304.
HUMAN AND ANIMAL RIGHTS
No animals were used in this research. All procedures performed in studies involving human participants were in accordance with the ethical standards of institutional and/or research committees and with the 1975 Declaration of Helsinki, as revised in 2013.
CONSENT FOR PUBLICATION
Informed consent was obtained from all participants.
STANDARDS OF REPORTING
STROBE guidelines were followed.
AVAILABILITY OF DATA AND MATERIALS
The data and supportive information are available within the article.
FUNDING
This research is funded by Arak University of Medical Sciences and Health Services as code no:3747.
CONFLICT OF INTEREST
The authors declare no conflict of interest, financial or otherwise.
ACKNOWLEDGEMENTS
The authors of this article kindly express their gratitude to all the staff of the Health Centers and all the couples who cooperated in performing this research.

