All published articles of this journal are available on ScienceDirect.

The Pattern of Morbidity and Access to Healthcare Service in the Riverine Flood-prone Villages of Assam, India
Abstract
Background:
Floods are considered one of the common phenomena causing substantial death, morbidity, and damage to infrastructure as well as economic conditions across the world. India receives 75% of its total rainfall in the monsoon season, as a result, annually on average 8 million people are affected by the floods. The Brahmaputra valley of Assam is one of the worst flood-affected regions in the country. This study focuses on understanding the pattern of morbidity, health service utilization, and challenges faced to access healthcare services in the riverine flood-prone villages of Assam.
Methods:
A mixed method study was followed to conduct the study. Primary data have been collected through interview schedules from 83 households. Descriptive statistics of both frequency and percentage were shown for categorical as well as continuous variables. Qualitative data were analyzed using a thematic framework.
Results:
The research findings indicate that in the flood-prone villages people face difficulty in accessing healthcare. However, the challenges intensify during flood times. It was identified that illnesses like fever, skin infection, diarrhea, and dysentery are linked to floods. Three themes were identified from the qualitative analysis i.e., lack of transportation facilities, non-functional sub-centres, and lack of money. The transportation facilities and the non-functional sub-centers were some of the causes along with the financial constraint to avail the health care facilities.
Conclusion:
It can be concluded that to improve the health service condition in the flood-prone areas, there is an urgent need to improve both the quality and quantity of the sub-centres infrastructures and the manpower. Other public health interventions such as providing food, water, and shelter, especially during floods need to be developed. Encouraging early flood preparedness and public health awareness programs through community participation would also help to reduce the damage to these people.
1. INTRODUCTION
Among all the disasters floods are considered one of the common phenomena causing substantial death, morbidity, and damage to infrastructure as well as economic conditions across the world [1, 2]. India receives 75% of its total rainfall in the monsoon season as a result, annually on average 8 million people are affected by floods [3]. India has been witnessing an increase in the flood-prone area with time at the rate of 0.014 million hectares per year [4]. (Singh, O., Kumar, M. 2013). The Brahmaputra valley of Assam is one of the worst flood-affected regions in the country [5]. The Rashtriya Barh Ayog (RBA) had assessed that 39.58% of the total land area of Assam are flood-prone areas [6] (Government of Assam). Every year the people living in the Brahmaputra valley of Assam receive hazardous annual floods which bring distress in the lives of people residing in the region [5]. In this valley, the riverine areas locally known as chars and chapories are affected by severe floods annually. These areas are segregated from each other leading to limited accessibility and preventing them from low access to health infrastructure and services as well [7]. Ratul Mahanta and Daisy Das's (2017) study shows that in the Brahmaputra Valley, households are vulnerable to poverty due to floods [8]. According to the Planning Commission Poverty Estimate (2011-12), the percentage of the population living below the poverty line in India is 21.92% whereas compared to the national average the percentage of the population below the poverty line is way higher in Assam i.e., 31.8% [9]. It reveals that compared to other states Assam is still lagging behind. Moreover, annual flood stands as one of the major factors hindering the socio-economic progress of the state. Thus notably the char areas of Assam have a huge concentration of poor population as it had been revealed that 80% of the char populations are living below the poverty line [10]
The National Family Health Survey-4 data reveals that some of the outcome measures in this state are in a very worse condition like infant mortality rate and under-five mortality rates in Assam is 40.7 and 56.5 deaths per 1000 live births. 46.9% of the population states that the absence of a nearby health facility is the reason for not visiting the government health facility. After giving immense attention to institutional delivery in rural areas, 31.6% of women had home delivery and 54.2% of women had assistance from a doctor during delivery [11]. These data give a glimpse of the condition of the health facilities of Assam, especially in the rural areas. Moreover, due to annual floods, these conditions worsen when floods wash away their properties and livelihoods. During floods, due to lack of basic needs such as food, water, and shelter makes these poor people more likely to be exposed to waterborne and vector-borne diseases.
Studies conducted in Bangladesh and Mozambique reported that fever, diarrhea, malaria, and respiratory problems were frequently reported illnesses among the population facing the risk of flooding [12, 13]. A study conducted in China indicates that the occurrence of gastric issues and external injuries remains elevated during periods of flooding [14]. Similarly, Biswas et al. (1999) underscored that in West Bengal, the incidence of diarrhea and respiratory infections was notably higher among those affected by floods [15]. Additionally, during times of disaster, para-professionals and drug stores play a crucial role as primary healthcare providers [16].
However, to the best of the author's knowledge, very little evidence is presented to provide insights on the pattern of health service utilization and morbidity in the flood-affected areas in Assam. Hence, a holistic understanding of the pattern of illness and health care services in flood-prone areas is necessary to plan and formulate policies better to mitigate and meet the needs of health care at times.
2. MATERIALS AND METHODS
2.1. Study Setting
The study was conducted in the Lakhimpur district located in the northeastern part of Assam. The district is situated between 26°48′ and 27°53′ North latitude and 93°42′ and 94°20′ East longitude. It is surrounded by Arunachal Pradesh in the northern part, the Dhemaji district in the east, the Majuli district in the southern part, and the Biswanath district lying on its west. This district covers an area of about 2277 square km out of which only 20 square km consist of urban areas and 2257 square km comes under rural.
2.2. Study Design
The study was based on the data collected from the villages of the flood-prone areas in the North Lakhimpur block of the Lakhimpur district. This cross-sectional study was carried down from October to December 2019. Each year the revenue circle of Lakhimpur kept records of the village inundated with floods on a daily basis which was collected. The list shows that in 2019, nearly 50 villages were affected by floods. Based on the highest frequency of days submerged under the water, six villages were selected. Among the six villages, four villages were selected attached to the mainland and the rest of the two villages were completely isolated from the mainland (referred to as char and chapories locally in Assam).
2.3. Data Collection and Sampling
A mixed method study was followed to conduct the study. A random sampling technique was applied to select the households of the village in the flood-prone areas of Lakhimpur district in Assam. In each village with the help of a key informant, the social map of the villages was prepared followed by a transect walk. The study covers six villages and 15 household samples were requested to participate in the study. So, ideally, 90 household schedules should be completed from all villages, but due to the data saturation, the study covered 83 households as a respondent in the final analysis of the study. It is important to note that this study covered in total of 475 population.
The author collected the data from the head of the household using face-to-face interviews. About 30 minutes were required to complete each of the household schedules. The schedule comprises of 6 parts socio-economic characteristics, housing and basic amenities, health facilities in the village, illness episodes, and place of treatment for each illness within 6 months from the survey in normal time, the illness occurred during flood and seeking care in the year 2019, and problems faced in seeking healthcare during the flood. The reported illness data were collected from the individuals but in case of the person below 18 years of age or not present during the survey, the household head answered the questions.
2.4. Variable Definitions
2.4.1. Morbidity
In the study based on the duration, the ailments had been classified into two types. They are acute and chronic morbidity. The duration of illness lasting not longer than 30 days is termed acute morbidity and on the other hand the duration of chronic morbidity is longer than 30 days (Dilip, T. R., 2002).
2.4.2. Public Health Facilities
It includes health camps, sub-centre, primary health center, and community health center.
2.5. Analysis
The study used descriptive statistics to present the frequency and percentage outcome variables such as pattern of morbidity and place of treatment in the selected flood-prone villages. The entire quantitative data analyses were performed using Stata version 14 (StataCorp LP, College Station, Texas, USA).
All the handwritten narratives and audio-recorded interviews were translated and transcribed from Assamese to English. The transcribed were analyzed using a thematic analysis approach [17]. Initially, the transcribes were read and reviewed for familiarization. After that codes and sub-codes were allocated to data grouped under the themes. Tables were generated to outline primary themes, subthemes, and the corresponding quotes associated with each subtheme. This approach was undertaken to identify data patterns and summarize the challenges faced by the respondents to access health care during the flood.
2.6. Ethical Consideration
Informed consent was taken from the respondents. At first, the purpose of the research was explained to them before starting the interview. The respondent was informed that the participation is completely voluntary. Even if he/she agrees to participate they have the right to withdraw at any time or refuse to answer any question that they do not want to respond to. Permission was sought to audio record the interview. It was also informed that the identity of the respondent will be confidential and the quotes of the interview will be used without disclosing his/her identity.
3. RESULTS
The study covered 241 males (50.74%) and 234 females (49.26%). On average 5.72 members are there in each household. Among the entire sample, 53.47% population were married and 42.95% were single. Children upto 5 years were 9.05%, and 4.84% were above the age of 60 years. The total percentage of the adolescent population was 16.42%. Only Hindu and Christian religions were found but the majority of the population belongs to the Hindu religion (96.39%). This study covers 47% of the share of the Scheduled Caste population, 37% of the Scheduled Tribe, and 15.66% of other categories. 14.32% population above the age of 10 years had not even completed their primary education. 32.63% of the population completed the primary level of education. Only 1.26% of the population have education above graduation. In the study area, the percentage of agricultural laborers was found highest i.e., 21.69%. About 20.48% of households produce crops. One of the common occupations among the Mishing tribe is fishing and livestock rearing,and the rest are self-employed in works such as owning a shop, and vendors. Only 13.25% of the households engaged in salaried work. The results show that 49.4% of respondents had an income below Rs 100000 (Table 1).
| Demographic Characteristic | Frequency | Percentage |
|---|---|---|
| Sex | - | - |
| Male | 241 | 50.74 |
| Female | 234 | 49.26 |
| Marital status | - | - |
| Single | 203 | 42.95 |
| Married | 254 | 53.47 |
| Separated/Divorce | 2 | 0.42 |
| Widow | 15 | 3.16 |
| Age | - | - |
| 0-5 years | 43 | 9.05 |
| 6 to 10 years | 58 | 12.21 |
| 11 to 20 years | 78 | 16.42 |
| 21-30 | 115 | 24.21 |
| 31-60 | 158 | 33.26 |
| above 60 | 23 | 4.84 |
| Religion | - | - |
| Christian | 3 | 3.61 |
| Hindu | 80 | 96.39 |
| Caste | - | - |
| Scheduled Caste | 39 | 46.99 |
| Scheduled Tribe | 31 | 37.35 |
| Others | 13 | 15.66 |
| Level of education | - | - |
| No education | 68 | 14.32 |
| Primary | 155 | 32.63 |
| Secondary | 97 | 20.42 |
| Higher Secondary | 48 | 10.11 |
| Graduate | 15 | 3.16 |
| Post Graduate | 6 | 1.26 |
| Main occupation of the households | - | - |
| Crop production | 17 | 20.48 |
| Livestock rearing | 5 | 6.02 |
| Agriculture labour | 18 | 21.69 |
| Self employed | 9 | 10.84 |
| Non agricultural casual lab | 13 | 15.66 |
| Salaried work | 11 | 13.25 |
| Fishing | 10 | 12.05 |
| Annual income of the household | - | - |
| Below 100000 | 41 | 49.4 |
| 100000-150000 | 26 | 31.33 |
| 151000-200000 | 9 | 10.84 |
| Above 200000 | 7 | 8.43 |
| Households’ Basic Amenities | Frequency | Percentage |
|---|---|---|
| Type of house | - | - |
| Kutcha | 76 | 91.57 |
| Pucca | 7 | 8.43 |
| Type of drinking water facility | - | - |
| Piped water | 2 | 2.41 |
| Tube well | 77 | 92.77 |
| River | 4 | 4.82 |
| Have toilet facilities | - | - |
| Yes | 44 | 53.01 |
| No | 39 | 46.99 |
| Toilet type | - | - |
| Open defecation | 39 | 46.99 |
| Kutcha | 17 | 20.48 |
| Semi Pucca | 8 | 9.64 |
| Pucca | 19 | 22.89 |
3.1. Characteristics of Households’ Basic Amenities
Table 2 shows that the majority of the households have Kutcha houses (houses made with bamboo, and clay (91.57%). Furthermore, 92.77% of households used tube wells to drink water. 4 houses have been found that drink water from the river. About 47% of households do not have any toilet facility as a result the open defecation is very high in the study area.
3.2. Pattern of Morbidity in the Flood-prone Areas
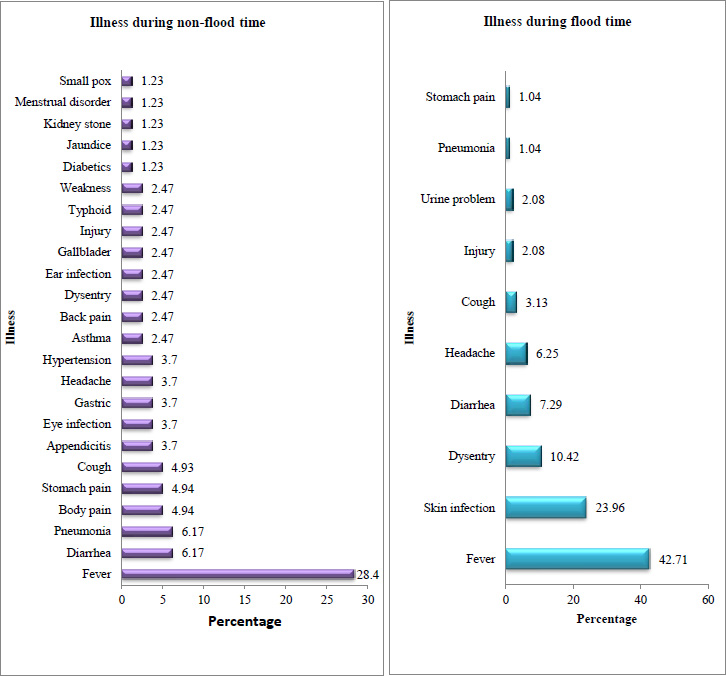
Based on the duration the illness had been classified into two types. They are acute and chronic illnesses. The duration of illness lasting not more than 30 days is termed as acute ailments and on the other hand, the duration of chronic ailments is longer than 30 days. The result shows that in both non-flood and flood times, the percentage of acute morbidity was high. In flood times the acute morbidity was 77.08% and chronic morbidity was 22.92%. In the case of non-flood times the acute morbidity was 80.25% which was slightly higher than the flood times.
In response to the questions of illness during the flood in the study area total of ten types of the disease have been found (Fig. 1). The percentage of fever was highest in both non-flood (28.4%) and flood times (42.7%). The proportion of people suffering from skin infection was high (10.42%) in the flood times while this illness was generally absent during non-flood times. Diarrhea and pneumonia rank second (6.17%) in terms of the percentage of the illness during non-flood times. However, the percentage of diarrhea increased upto 10.42% in flood times. Similarly, during the flood, the percentage of the population suffering from cough increased by 7.29% while in non-flood it was 4.93%.
3.2.1. Acute Ailments
During non-flood, it was found that among the four villages attached to the mainland almost all the households had most of its members suffering from acute illness (Table 3). In both flood and non-flood Duwarpur has the highest percentage of the population suffering from acute illness. Compared to the males the percentage of the population suffering from acute ailment was high among the females. Acute ailments were found more whose age was between 0-9 years. Similarly, in flood times both children below 5 years of age and people above 80 years of age were found to suffer more in the flood With an increase in the households’ annual income the percentage of acute illness decreases. Acute illness was high among the households within the income category of Rs 1 lakh to Rs 1.5 lakh. Moreover, the percentage is highest among the population whose income is above Rs 2 lakh.
| - | Non-Flood | Flood | ||
|---|---|---|---|---|
| Ailment | Acute Ailment | Chronic Ailment | Acute Ailment | Chronic Ailment |
| Village | ||||
| Bongaon | 12 (80%) | 3 (20%) | 16 (76.19%) | 5 (23.81%) |
| Duwarpur | 12 (100%) | 0 | 13 (100%) | 0 |
| Khaga Chandrapur | 9 (69.23%) | 4 (30.77%) | 14 (77.78%) | 4 (22.22%) |
| Na Ali Koibarta 3 | 11 (84.62%) | 2 (15.38%) | 10 (76.92%) | 3 (23.08) |
| Morton Chapori | 10 (71.43%) | 4 (28.57%) | 10 (71.43%) | 4 (28.57%) |
| Na Ali Aunibari | 11 (78.57%) | 3 (21.43%) | 11 (64.71%) | 6 (35.29%) |
| Sex | ||||
| Male | 28 (73.68%) | 10 (26.32%) | 34 (75.56%) | 11 (24.44%) |
| Female | 37 (86.05%) | 6 (13.95%) | 40 (78.43%) | 11 (21.67%) |
| Age | ||||
| 0 to 5 years | 3 (100%) | 0 | 12 (80%) | 3 (20%) |
| 6 to 9 years | 9 (100%) | 0 | 6 (66.67%) | 3 (33.33%) |
| 10 to 19 years | 8 (72.73%) | 3 (27.27%) | 8 (80%) | 2 (20%) |
| 20-39 | 28 (82.35%) | 6 (17.65%) | 27 (77.14%) | 8 (22.86%) |
| 40-59 | 9 (64.29%) | 5 (35.71%) | 13 (76.47%) | 4 (23.53%) |
| 60-83 | 8 (80%) | 2 (20%) | 8 (80%) | 2 (20%) |
| Income | ||||
| Below 100000 | 32 (82.05%) | 7 (17.95%) | 42 (79.25%) | 11 (20.75%) |
| 100000-150000 | 23 (88.46%) | 3 (11.54%) | 23 (76.67%) | 7 (23.33%) |
| 151000-200000 | 6 (66.67%) | 3 (33.33) | 5 (71.43%) | 2 (28.57%) |
| Above 200000 | 4 (57.14%) | 3 (42.86%) | 4 (66.67%) | 2 (33.33%) |
3.2.2. Chronic Ailments
Chronic illness was highest in the village of Khaga Chandrapur. Male members were found to suffer more from a chronic ailment. Among the age group of 40-59 years of age members of the household had the highest chronic ailment. The households with income of more than 20000 shared the highest percentage of chronic ailments.
On the other hand in the flood times, it was observed that in most of the villages, the percentage of chronic illness increased. Its rate of increase was high in the char village i.e., Na Ali Aunibari (35.29%). Compared to non-flood times the females were more affected with chronic illness in flood (21.67%).
3.3. Place of Treatment
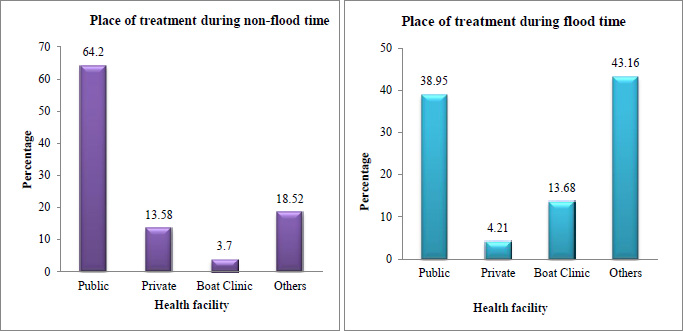
The respondents were asked about the healthcare facility that they visited during the reported illness. Along with the place of treatment, the barriers faced to access healthcare were asked. Public health facility includes CHC, PHC, and SC. Private health facilities were private hospitals and clinics. Others cover the informal health provider i.e., quack and traditional healer. In the study, 62% of the individuals seek care from public health facilities. Furthermore, compared to the private health facility the share of treatment-seeking was more from the quack and the traditional healer. The majority of the individuals suffering from acute illness seek treatment from public health facilities (61.54%) followed by others (23.08%). For chronic illness, 75% of the individuals in the study area seek treatment from a public health facility. 18.75% of the individuals receive treatment for chronic illness from boat clinics (Fig. 2).
During floods, about 38% of patients seek treatment from public health facilities such as CHC, PHC, and SC. However, in the study area 40% of the individuals visited the quack, traditional healer, and pharmacy for their treatment. Another health facility used by the population was the boat clinic i.e. 13.68%. Na Ali Aunibari had the highest percentage of respondents to use the boat clinic (52.94%).
3.4. Distance Travelled to Seek Treatment
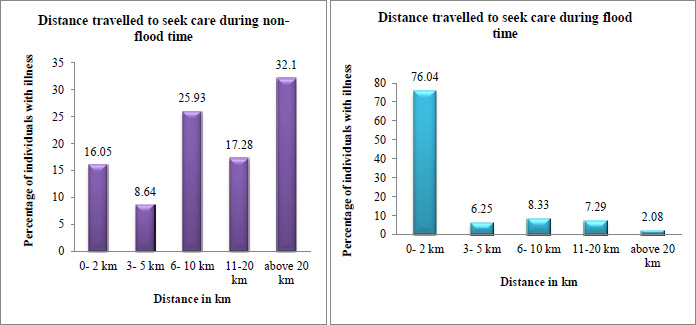
Fig. (3) shows the majority of the individuals in the study area travel above 20 km to seek care during non-flood. On the contrary the percentage of the population traveling more than 20 km decreases in flood times. Due to the lack of transportation facilities, the majority of the population (76.04%) replied that they travelled generally 2 km to seek treatment during flood times.
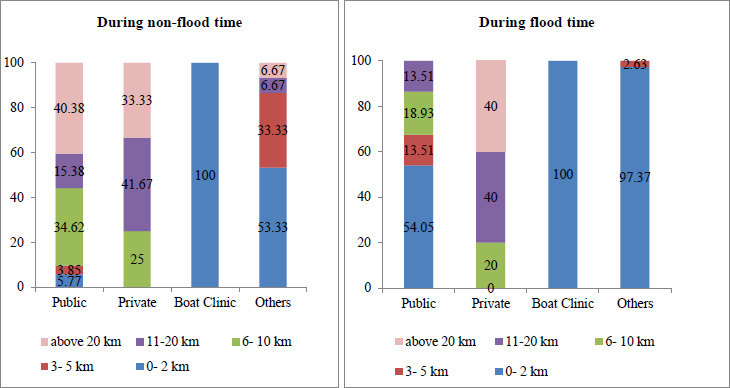
Fig. (4) shows that during non-flood 5.77% of individuals traveled up to 2 km and 40.38% traveled above 20 km respectively. To seek care from a private provider they had to travel above 6 km. The boat clinic was the nearest health facility they had each month just near the village.
Eventually, during the flood, it was found that there was a sharp increase to 54.05% of the population utilizing public health care (54.05%) that includes health camps with a travel distance of 2 km . In the case of other health care providers, the distance traveled in flood decreases to 5 km.
3.5. Problem Faced in Accessing Healthcare Services during Flood
Conversations with the respondents in the field confirmed that the households located in the remote areas receiving flood every year face various constraints such as transportation facilities, non-function of sub-centre, and lack of money to access health care service.
3.5.1. Lack of Transportation Facilities
The majority of the households responded that the distance between the village and the health care facility is the prime obstacle for them. This condition gets more worse during the flood when the road gets damaged. The utilization of health care services largely depended on access to transportation. In rural areas when the distance to travel is more and no proper transportation facility is available it ultimately leads to low utilization of public health care services and an increase in their out-of-pocket health expenditure.
As described by participants how they faced problems due to the unavailability of transportation facilities:
I was sick during the flood but as the ferry service was closed for 7 days at that time due to an increase in the level of water in the river, I was not able to go to the health center and unfortunately, I sought care from a quack of our village because there is no any permanent health center available near to our village. And for treatment, we cannot solely depend on the boat clinic which visits only once a month. (N41, Age- 40 years, Male, Vill- Morton Chapori,)
Another woman explained her experience with the obstacles faced during her delivery due to the lack of transportation facilities:
Two months back in the early morning my labor pain started while I was at home. But to reach any health center from our village we had to always face the challenges of crossing the river in an emergency situation. As I belong to a poor family, they cannot manage money to take me urgently to the health center. We had to wait for the public ferry to start but unfortunately, before crossing the river I had to deliver my baby. I felt like there was no chance of my survival and it was a very uncomfortable and awkward moment in my life as without any privacy I delivered the baby in front of the ferry passengers. (N14, Age- 28 years, Female, Vill-Na Ali Aunibari)
Similarly, two more participants discussed the transportation problem:
It was rainy season when I fell down and my leg was injured. During the flood, all the road networks broke down and our temporary bridge too. It was too difficult to take me to the health center. But the villagers with lots of hurdles somehow carried me and walked for about 8 km, and when we reached the proper road I saw the ambulance was waiting and I was taken to the health center. From this, I can say that just because of the bad road connectivity in our villages we have to face many problems not only in the rainy season but also in the dry season also. (N35, Age-50 years, Male, Vill- Morton Chapori)
In our village, those who do not own any vehicles have to walk a long distance as due to poor road connectivity no public transport facility is available. As I went to town for some work I sought treatment from a private clinic along with my friend but my wife who was ill too did not go to the health center, she sought care from a quack of our village. (N15, Age-30 years, Male, Vill- Na Ali Aunibari)
3.5.2. Non-functional Sub-centres
The sub-centres presented in the concerned study area found that none of the sub-centres have residential facilities for ANM. The ANMs mainly travel from the urban areas to the sub-centres. Compared to the sub-centres in the mainland village the sub-centres in the char areas are in a worse condition. The basic infrastructure for the functioning of the sub-centre is not available. As a result most of the time it was found that the sub-centres are only open during the time of vaccination and immunization camp. As highlighted in these quotes we can understand the non-function ability of the sub-centre in the study area:
There is no point in visiting the sub-centre and wasting our time as we do not get cured of it because the medicines are of poor quality and sometimes medicines are not available. (N 63, Age- 35 years, Male, Vill-Duwarpur)
Walking for 30 minutes while you are sick and not sure about whether the health personnel will be available or not in the sub-centre. So, instead of going to the sub-centre most of the time we prefer to go to the primary health center directly. (N76, Age-70 years, Male, Vill-Duwarpur)
The sub-centre is only open for 8 hours but when there is an emergency and the sub-centre is closed we have to call the quack from the distant village and they used to come and treat us at our home. (N71, Age-60, Female, Vill- Bongaon)
The sub-centre of our village is for those who are pregnant and their child for immunization. (N27, Age- 65 years, Male, Vill- Khaga Chandrapur)
3.5.3. Lack of Money
The villagers depend mainly on primary occupation and most of them are daily wage labor. In a year most of them get unemployed during the rainy season. They used to borrow money in the rainy season and in the winter they gave the money to the lenders. But this condition repeats again when they receive a flood as a result they fall into the trap of money constraint. In such conditions when they do not have money if a member of the household falls sick, the health care is compromised as they are unable to manage the cost of treatment. The citations below manifested how due to the lack of money their problem accessing health care intensified:
My son was suffering from stomach pain for a few days so after taking advice from the doctor we diagnosed him in the CHC at first and the very next day took the report. We came to know he had appendicitis. But due to lack of money, I am unable to do treatment of my son though the doctor asked me to do an immediate operation. During the flood, I already lost my livestock; crops and my land got eroded. I am in a very miserable condition as I am the sole bread earner, whatever I earn the whole day I have to spend to feed my family if I do not work a single day all my family members have to starve. I already spent around Rs 1000 for his diagnosis. It is very difficult for us to go to the town and stay in the hospital because it needs a huge amount of money. So, I am trying to borrow money to start his treatment. (N42, Age-50 years, Male, Vill-Morton Chapori)
Similarly, another respondent explained
I was not satisfied with the treatment provided in the health camp so I wanted to do a check up in a good health center. But at that time my house was washed away by flood so we were staying on the road. I was in despair because for three months I was not getting any work. Each day we have to struggle for food, water, and toilet facilities. In such a condition I could not manage money for my treatment and took the medicine provided in the health camp. (N62, Age-50 years, Male, Vill-Bongaon)
4. DISCUSSION
This study was based on the analysis of the data on the pattern of health service utilization collected from the flood-prone villages of Lakhimpur district. The mixed method applied in the study helps to explore the pattern of morbidity, health care utilization, and the barriers faced to utilizing health care in the context of rural flood-prone areas in Assam. It is a well-known fact that the utilization of health care is affected by multiple factors for example availability, cost, travel distance, quality of care, social structure, and health beliefs [18]. Globally it was found that people residing in rural areas face different barriers while accessing healthcare services [19]. Likewise, the present study also reveals that like other villages in remote areas, the populations of the study area have to face similar problems but these problems get magnified as it receives severe floods each year.
It was identified that illnesses like fever, skin infection, diarrhea, and dysentery are linked to floods. Dell D. Saulnier et al. study showed that during the time of flood, there was an increase in the number of visits to health centers for the treatment of skin infections and diarrhea [2, 20]. A study done in Pakistan also shows that the common disease found in the flood affected are waterborne diseases such as skin infections and diarrhea [21].
The sanitation conditions in the villages are not in an improved condition. Poor sanitation has a direct impact on the condition of health [22]. Open defecation was practiced in all villages and it increased mainly during the flood. Moreover, along with other household property damage, the tube wells submerged under the water at the time of the flood, people settled down in the road and highland areas in temporary tents, as they were displaced the households did not have any option to collect water they had to face difficulties to collect clean drinking water. There were few households found in the study area that used dirty floodwater without any kind of purification. Studies revealed that as it creates unhygienic conditions the chance of suffering from diarrhea is supposed to increase among the population [22, 23]. Gautam et al. state that due to floods the water and sanitation facilities get destroyed and as a result diarrheal diseases rise as people use contaminated drinking water and open defecation is practiced [24]. Along with sanitation a low level of education among the population increases diarrhea morbidity. Studies found that those people with a low level of education had less awareness about health prevention measures [25]. The study found that in normal times compared to males higher levels of acute morbidity among females. In flood times there was a similar pattern of morbidity among both males and females. However a study conducted on the morbidity pattern in Kerala shows females have higher morbidity because females are two times more prone than males to diseases like bone and joint pain, and hypertension [26].
The findings indicate that many respondents do not feel the existence of the sub-centre in their village because they think it is difficult to reach the health center, the sub-centre is meant for only pregnant women, and most of the time the medicines are not available. The findings corroborate with Saleem SM, et al. 2017 study that it was difficult to travel to the sub-centre and complain about the non-availability of medicine [27]. A study done in Andhra Pradesh highlights that about 73% of people in the remotest area travel more than 5 km from their village to reach sub-centres. Compared to normal times there was an increase in the use of both the boat clinic in the villages where boat clinic service was provided and other informal health providers in all the villages.
Since a long time, it had been identified that the travel distance of the patients to seek treatment is a major determinant of health care utilization [28]. The study found more than 33% of the patients had to travel more than 20 km to seek care. Studies show that difficult geography as well as long-distance walks, leads to poor access to health care services [18, 29]. A study done in Ethiopia shows that the perceived physical barriers like long distances, lack of transportation, uneven distribution of health centers, and the topography of the area determine the behavior of rural women seeking care for maternal health care [30]. Awoyemi TT et al. study suggests that transportation problem and the cost stands as the major barrier to repeated visits for treatment [31]. In India, the ambulance services provided to take pregnant women, children as well as, patients who are in need of emergency medical care have not been well improved [32]. The goal of an ambulance is to reach any place within 15-20 minutes after the distress call and transport the patient to a health facility within 20 minutes thereafter [33].
Overall it was found that for both acute and chronic illnesses the patients mostly sought treatment from the public health facility. However, the study confirmed that next to the government health center for treatment they visited quack and traditional healers whom they met in the periphery of their village, and sometimes they traveled from house to house as well as the village to provide services in the doorstep. This finding is similar to several other studies which revealed that one of the major providers of basic health care in the rural area is the informal health care provider [34, 35]. Additionally one of the interesting health facilities found in the study area is the boat clinic that provides primary care once a month to each of the char villages. As the road connectivity was damaged the respondents reported that they could not visit the higher health facilities as a result they visited informal health care providers and boat clinics in flood times.
Therefore, in order to address the challenges encountered by the flood-affected population, it can be recommended that firstly the transportation facilities of the prone areas should be improved which might increase the mobility of the health care provider as well as the user. For instance, the government should implement measures to ensure the presence of boats in flood-prone areas. This would enable villagers to use boats during emergencies, allowing them to reach mainland areas and access healthcare services. An effective public health system should be ensured to cater to the needs of flood-prone areas, specifically at the sub-centre level. Residential buildings for the health workers in the sub-centre should be constructed. This initiative would extend the service provision hours, enabling villagers to access services even during nighttime emergencies. Early flood preparedness should be one of the prime responsibilities of the service provider. It was evident from the study that in the health camps villagers often complain about the non-availability of medicines. Moreover, there should be ongoing awareness programs on sanitation and hygiene practices throughout the year.
CONCLUSION
It can be concluded that the combination of poor economic conditions and flooding during the rainy season significantly impacts both the health conditions and utilization of health services in the study area. The findings reveal that villages in both mainland areas and riverine islands encountered challenges in accessing health services, with these challenges becoming more pronounced during flood times. Factors such as transportation limitations, non-functional sub-centers, and financial constraints contribute to difficulties in accessing healthcare facilities. Sub centers as the nearest available public healthcare facilities for rural areas, experience varying usage patterns between non-flood and flood times. Interestingly, this gap is bridged by informal healthcare providers, including quacks, and mobile boat clinics that serve isolated char villages, particularly during floods. Therefore in order to improve the health services in the flood-prone areas, there is an urgent need to improve the infrastructure and manpower of sub-centers in terms of both quality and quantity. The sub-centers should be built in a way that during the flood the building should not get affected. Additionally, the capacity of boat clinics should be expanded to serve a larger population during times of severe road connectivity. Other public health interventions such as providing food, water, and the shelter of the people, especially during floods need to be developed to prevent drinking contaminated water and open defecation to minimize the health hazard in the flood-prone areas. Encouraging early flood preparedness and raising public health awareness through community engagement are vital strategies to minimize the impact of such events on the health and well-being of affected populations.
ABBREVIATION
| RBA | = Rastriya Barh Ayog |
ETHICS APPROVAL AND CONSENT TO PARTICIPATE
Not applicable.
HUMAN AND ANIMAL RIGHTS
No humans/animals were used for studies that are the basis of this research.
CONSENT FOR PUBLICATION
Informed consent was taken from the respondents.
AVAILABILITY OF DATA AND MATERIALS
The authors confirm that the data supporting the findings of this study are available within the article.
FUNDING
None.
CONFLICT OF INTEREST
The authors declare no conflict of interest financial or otherwise.
ACKNOWLEDGEMENTS
Declared none.

