All published articles of this journal are available on ScienceDirect.

Digital Health Interventions in Dengue Surveillance to Detect and Predict Outbreak: A Scoping Review
Authors Info & Affiliations
Abstract
Background
Dengue fever is a global concern, with half of the population at risk. Digital Health Interventions (DHIs) have been widely used in Dengue surveillance.
Objective
The objective of this review is to identify DHIs that have been used in Dengue surveillance.
Methods
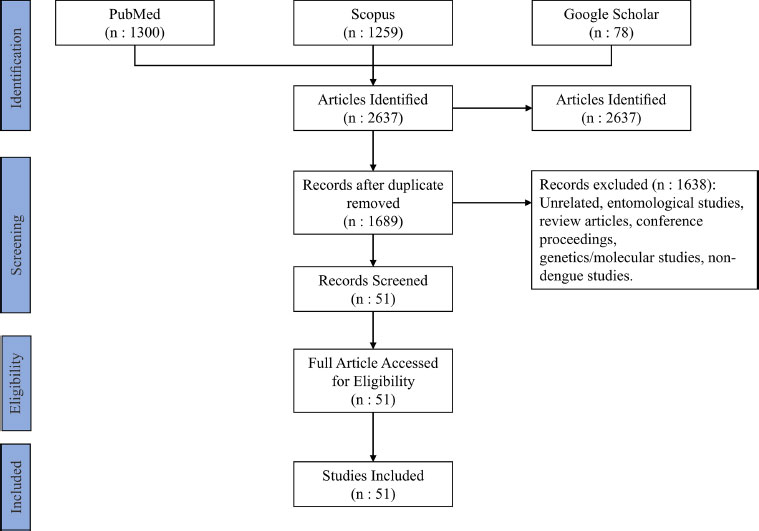
A systematic literature search was performed on three primary databases: PubMed, Scopus, and Google Scholar. A total of 2637 studies, including duplicates, were found to be possibly pertinent to the study topic during the electronic search for the systematic literature review. After the screening of titles and abstracts, 51 studies remained eligible.
Results
The study analyzed 13 main categories of DHIs in Dengue surveillance, with Brazil, India, Sri Lanka, China, and Indonesia being the top five countries. Geographic Information System was the most used DHIs, followed by Machine Learning, Social Media, Mobile Applications, Google Trends, and Web Applications. DHIs were integrated, as evidenced by the deployment of many DHIs simultaneously in a single Dengue surveillance program.
Conclusion
Future research should concentrate on finding more efficient ways to combine all available data sources and approaches to improve data completeness and predictive model precision and identify Dengue outbreaks early.
1. INTRODUCTION
Dengue fever is a tropical infectious illness caused by one of four Dengue virus serotypes (DENVs 1-4) and transmitted to humans by the bite of an infected mosquito [1]. The Aedes aegypti mosquito and, to a lesser extent, Aedes albopictus mosquito are the primary vectors of Dengue transmission and are found worldwide in tropical and subtropical climates, especially in urban and semi-urban areas. This disease has serious public health, social, and economic implications in many low and middle-income countries (LMICs) [2, 3].
According to World Health Organization (WHO), the increase of people in the world being at risk due to urbanization and climate change whereby increased temperatures and rainfall patterns have extended the range of Aedes aegypti and albopictus to new regions globally where Dengue has not previously been endemic [4]. Dengue continues to be the arbovirus with the highest number of cases reported in the Region of the Americas, with outbreaks that occur cyclically every 3 to 5 years. 2023 is the year with the highest historical record of Dengue cases, exceeding 4.1 million new infections. This figure exceeded those of 2019, the year in which they registered more than 3.1 million cases, including 28,203 serious cases and 1,823 deaths [5]. Despite an estimated 100–400 million infections every year, more than 80% of them are generally mild and asymptomatic. Moreover, this infection can cause an acute flu-like illness. Sometimes this condition develops into a potentially lethal complication known as Dengue Shock Syndrome (DSS) [4, 6].
Several strategies have been implemented to reduce Dengue fever mortality and morbidity following The Global Plan for Dengue Prevention and Control 2012-2020 WHO. Dengue mortality can be reduced by implementing early case identification and adequate treatment of severe cases, as well as reorienting health services to identify early cases and successfully manage Dengue epidemics, primary health-care worker training, and appropriate referral mechanisms. Dengue morbidity can be reduced by improving outbreak prediction and detection through coordinated epidemiological and entomological surveillance; supporting the concepts of integrated vector management, and implementing locally adapted vector control strategies, such as efficient management of home and urban water supplies. Behavior changes brought about by effective communication can support prevention programs [7].
Surveillance, which provides the data required for risk assessment and program direction, is another element of Dengue prevention [8]. Surveillance is an essential component of any Dengue prevention and control program because it provides the data required for risk assessment, epidemic response, and program evaluation. Surveillance can make use of both passive and active data collection methods. Surveillance activities should ideally encompass monitoring human Dengue cases, laboratory-based surveillance, vector surveillance, and environmental risk factors for Dengue epidemics. The epidemiological picture of transmission risk is enhanced and expanded by surveillance using a wide range of data sources, depending on the circumstances under examination [9].
The main goal of Dengue disease surveillance is to detect and predict epidemic activity [9]. DHF (Dengue Hemorrhagic Fever) surveillance is carried out manually, on paper, digitally, or electronically. Digital health, or the use of digital technology for health, has developed as an emerging practice sector for meeting health requirements through ordinary and creative forms of information and communication technology (ICT). The term digital health has evolved along with eHealth and other terms, which is described as “the use of information and communication technology to support health and health-related sectors” [10].
In disease surveillance, digital health interventions (DHIs) have been widely implemented. As shown by the detection of polio and Ebola epidemics, digital surveillance can improve early detection and response to worldwide public health emergencies and should be viewed as an essential complement to existing official surveillance mechanisms [11]. Many studies have applied digital surveillance to detect and predict Dengue outbreaks such as Google Trends, internet search engines, social media platforms, online news, geographic information systems, and others [12–14].
Moreover, in Dengue fever surveillance, many studies have been conducted on DHIs to support policymaking in the prevention and control of Dengue fever. Since each DHI has different objectives for its Dengue fever surveillance initiatives, more information is required. For instance, it takes a combination of several types of DHIs to support Dengue surveillance activities comprehensively from data collection to information dissemination for policy support, so this study offers fundamental knowledge for researchers in adopting and implementing appropriate DHIs in the future. The distribution and trend of DHIs implementation also indicate the level of attention that has been shown recently by scientists. To the best of our knowledge, no study systematically reviews this area. This study aims to fill that gap. Therefore, the first aim of this review is to identify digital health interventions that have been applied in Dengue surveillance to detect and predict outbreaks. The second aims to analyze data sources, study locations, and purposes of DHIs in Dengue surveillance.
2. MATERIALS AND METHODS
The scoping review was conducted based on Arksey and O’Malley’s scoping review framework [15]. The literature search was conducted from June to November 2022. This scoping review was not formally registered with the international systematic review database (PROSPERO). It was not required to register scoping reviews with PROSPERO at the time this text was written.
We define digital health interventions refer to the use of Information and Communication Technology (ICT) to support Dengue surveillance programs. It encompasses a range of related concepts such as mobile applications, health informatics, desktop computer programs, websites, artificial intelligence, machine learning, data analytics, and others that support Dengue surveillance both online and offline.
2.1. Eligibility Criteria
The scoping review focused on studies that used information technology in Dengue surveillance to monitor, early detection, predict, and/or forecast Dengue outbreaks. The inclusion criteria included: (1) Dengue diagnosis based on the standard WHO definition; (2) Articles published between January 2017 and November 2022 in English to capture the latest and relevant studies because technology in DHIs rapidly transforms; (3) Studies focused on digital health interventions or implementation of health information technology for Dengue surveillance. The exclusion criteria were: (1) Studies without original data, such as reviews, editorials, guidelines, and perspectives articles; (2) Opinion papers, conference proceedings, book abstracts, study protocols, reflection articles, letters, and posters due to the limitation of the information; (3) Studies for which full-text was not available; (4) Studies exclusively on entomological (without any human data) in order to allocate resources effectively to human-related analyses and interventions.
2.2. Search Strategy
The search strategy was conducted through electronic databases (PubMed, Scopus, and Google Scholar). Three categories were created for search terms: 1) Surveillance; 2) Dengue; and 3) Information Technology are the first three. Despite the presence of this option in the search command, Medical Subject Headings (MeSH) were employed to ensure an accurate search. Each term was entered separately from the electronic database into the advanced search field, and then combinations were applied using the basic search structure “Surveillance” AND “Dengue” AND “Information Technology” (as appropriate) (Table 1).
We imported references into Mendeley Reference Manager and removed duplicates. The selection procedure was divided into two stages. First, we screened titles and abstracts using the previously mentioned inclusion and exclusion criteria. Second, we examined the full text of the articles found in the first phase. Four reviewers worked independently on the screening and full-text review. Studies were selected once a consensus was reached.
2.3. Data Collection Process
The full-text selected papers' data was exported into Microsoft Excel®. We extracted the following details: title, author, abstract, purpose, intervention type, study design, main results publication year, setting/scenario, journal, and databases searched.
2.4. Data Extraction
A data extraction form was constructed using a Microsoft Excel® spreadsheet. Each text was reviewed after being classified using the extraction form. There was no formal assessment of the methodological quality of the included articles following the standards for conducting a scoping review; nonetheless, the quality of the papers was defined by the study designs that were eligible for inclusion.
2.5. Data Synthesis
The themes emerging from the data were analyzed and discussed with the research team. Given the variety of the literature, descriptive numerical and thematic analyses were offered as narrative summaries. We used Microsoft Excel® to create the bar chart, pie chart, word cloud chart, and map. A descriptive analysis was performed to specify information based on type, themes, the trend of DHIs research in Dengue surveillance, and location distribution studies. A word cloud was also produced to detect keywords that appeared often in the abstracts of the publications reviewed. To determine the most popular keywords in digital health interventions on Dengue surveillance, the abstracts of all articles were examined. The word cloud graph displays the top 100 words from the abstracts of the 51 articles that were chosen.
| Database Source | Search Terms |
|---|---|
| PubMed | (Surveillance[Title/Abstract] OR “epidemiological surveillance”[Title/Abstract] OR “Public Health Surveillance”[Title/Abstract] OR “Electronic Surveillance”[Title/Abstract] OR “Digital surveillance”[Title/Abstract] OR “Active Surveillance”[Title/Abstract] OR “Passive Surveillance”[Title/Abstract] OR Report*[Title/Abstract] OR “Sentinel Surveillance”[Title/Abstract]) AND (Dengue[Title/Abstract] OR “Dengue Fever”[Title/Abstract] OR “Dengue Hemorrhagic Fever”[Title/Abstract]) AND (Technology[Title/Abstract] OR Information[Title/Abstract] OR Informatics[Title/Abstract] OR Digital [Title/Abstract OR Data[Title/Abstract] OR “Information System”[Title/Abstract] OR “Information Management”[Title/Abstract] OR “Health Information”[Title/Abstract] OR “Health Informatics”[Title/Abstract] OR “Public Health Informatics” [Title/Abstract] OR “Health Information Technology”[Title/Abstract] OR “Health Information System”[Title/Abstract] OR “Health Information Management”[Title/Abstract] OR “Electronic Health Record”[Title/Abstract] OR “Electronic Medical Record”[Title/Abstract] OR “Personal Health Record”[Title/Abstract] OR “Mobile Health”[Title/Abstract] OR “m-health”[Title/Abstract] OR “e-health”[Title/Abstract] OR “Health Record”[Title/Abstract] OR “Medical Record”[Title/Abstract] OR “Digital”[Title/Abstract] OR “Medical Informatics”[Title/Abstract] OR “Internet”[Title/Abstract] OR “Medical Informatics Application”[Title/Abstract] OR Software[Title/Abstract] OR “Machine learning”[Title/Abstract] OR “Artificial intelligent”[Title/Abstract]) |
| Scopus | TITLE-ABS-KEY((Surveillance OR “epidemiological surveillance” OR “Public Health Surveillance” OR “Electronic Surveillance” OR “Digital surveillance” OR “Active Surveillance” OR “Passive Surveillance” OR Report* OR “Sentinel Surveillance”) AND (Dengue OR “Dengue Fever” OR “Dengue Hemorrhagic Fever”) AND (Technology OR Information OR Informatics OR Digital OR Data OR “Information System” OR “Information Management” OR “Health Information” OR “Health Informatics” OR “Public Health Informatics” OR “Health Information Technology” OR “Health Information System” OR “Health Information Management” OR “Electronic Health Record” OR “Electronic Medical Record” OR “Personal Health Record” OR “Mobile Health” OR “m-health” OR “e-health” OR “Health Record” OR “Medical Record” OR “Digital” OR “Medical Informatics” OR “Internet” OR “Medical Informatics Application” OR Software OR “Machine learning” OR “Artificial intelligent”)) |
| Google Scholar | Surveillance AND Dengue AND (Technology OR Electronic OR Digital OR Informatics OR Information OR m-health OR e-health OR “Health Record” OR “Medical Record” OR application OR software OR “medical informatics”) |
3. RESULTS AND DISCUSSION
A total of 2637 studies, including duplicates, were identified during the electronic search as potentially relevant to the research question. Following the screening of titles and abstracts, 51 research were found to be eligible (Fig. 1). The main reason for excluding articles was that they were not focused on digital health Dengue surveillance, entomological studies, review articles, conference proceedings, or genetic/molecular studies.
3.1. Characteristic Studies by Trends, Theme, and Categories
Based on the publications reviewed, studies related to DHIs in Dengue surveillance are published every year and they tend to fluctuate (Fig. 2a, b). This can be a sign that the increase in the need for dengue surveillance is related to the burden of disease which also has an impact on the number of studies related to DHIs. The implication is that alternate data sources for Dengue surveillance can be found on digital platforms like social media and big data on the internet. Through an integrated digital surveillance program, policies for Dengue control and prevention can be decided to be carried out precisely and speedily [16].
The most discussed DHIs in Dengue Surveillance were Dengue, disease, data, health, system, cases, surveillance, information, application, and outbreak (Fig. 2a). Dengue is the subject of discussion in each article used, therefore it has the utmost intensity. The word cloud graph includes some words that are strongly related to digital health, including data, information, application, mobile, spatial or GIS (Geographic Information System), tweets, Google Dengue Trends, and machine learning. This demonstrates how data and information are crucial to digital health in Dengue surveillance because the delivery of health services could be enhanced by improved data.
The data analyzed must comply with the rules and cannot be arbitrary in surveillance activities. The three fundamental components of high-quality data in public health surveillance are completeness, accuracy, and timeliness. Data are complete when all cases are included (no cases are missed) and all data variables for cases are entered. When the information entered is correct, the data is accurate. Data are timely when they are available and delivered when required [17]. In practice, data-driven surveillance support depends on having access to the right data, using the proper methods, and making the outputs accessible and understandable to the right stakeholders [18].
Another theme found in this review and related to DHIs is spatial or GIS (Geographic Information System). It is undeniable that this topic has long been used for disease mapping since it was first applied by John Snow, in 1854 [19, 20]. GIS allows researchers to relate health, environmental, and population data, thereby being able to evaluate and quantify the relationship between health-related variables and environmental risk factors. Additionally, GIS helps anticipate outbreaks, including early Dengue incidence site identification and future risk estimations [21, 22]. However, the application of GIS technology still faces several obstacles, such as limited access to GIS infrastructure, lack of technical and analytical expertise, and inconsistent data availability. International cooperation is possible to overcome these obstacles through knowledge exchange and governance [21].
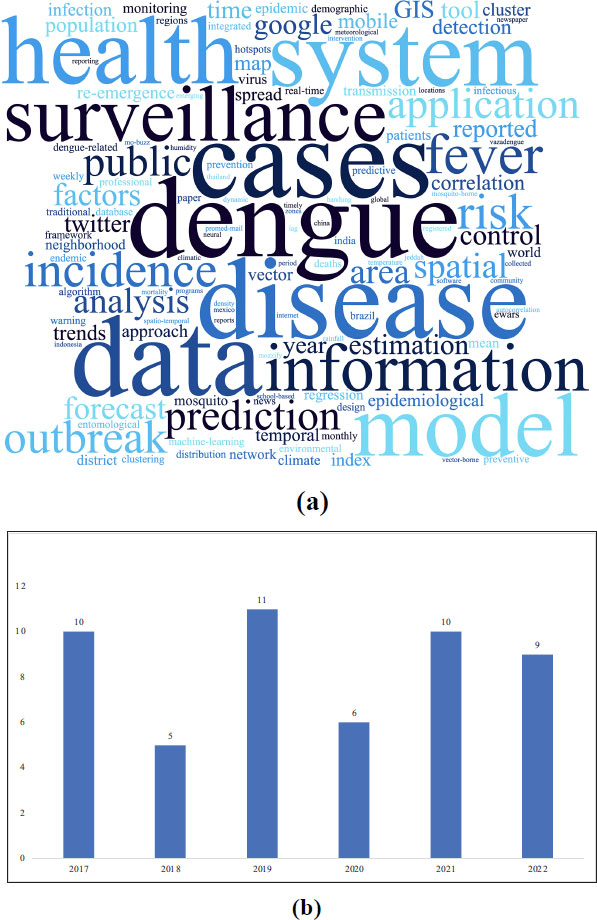
(b) Trend of the studies.
Other topics, such as Google Trends, internet search engines, and Twitter were also found in this research. All of these can be used as important tools for dengue surveillance. Google Trends and internet search engines provide search query data related to dengue. This data is then extracted for dengue surveillance purposes. Meanwhile, Twitter data is based on tweet data that includes topics or keywords related to dengue, and is then analyzed according to dengue surveillance objectives [23–26]. However, there is a need to incorporate untapped possibilities for digital surveillance, and present applications can be scaled up through better integration, validation, and regulatory clarification about ethical considerations. Therefore, a hybrid system that collects data from conventional surveillance with data from search queries, social media posts, and crowdsourcing can improve the quality of Dengue surveillance activities [14, 27].
This study also uncovered other themes such as applications and mobile. Mobile phone technology has been applied to improve arbovirus management, prevention, diagnosis, and surveillance over the past ten years [28]. Mobile applications for Dengue surveillance have great promise for detection, reporting, and mapping Dengue fever cases, changing attitudes about Dengue fever by increasing knowledge and changing perceptions of the disease, and disseminating and sharing information about DHF among the general public and healthcare professionals [29, 30].
Another interesting topic shown on the word cloud is related to the objectives of DHIs in Dengue surveillance (Fig. 2a). The terms “detection,” “prediction,” “forecast,” “monitoring,” “model,” and “reported” are among those that show up. This indicates that the use of DHIs in Dengue monitoring goes beyond just reporting tools and focuses on additional analysis to develop a model that can predict Dengue outbreaks. The term “machine learning,” which is closely related to prediction modelling, also supports this.
3.2. Digital Health Intervention Categories
This study found DHIs categories as shown in Fig. (3a), GIS dominates the use of digital health in Dengue surveillance, (30%) followed by Machine Learning (13%), Social Media (11%), Mobile Applications (10%), and Google Trends (9%) and Web Application (9%). The interesting thing is that several types of DHIs are used simultaneously to support one Dengue surveillance activity, thus indicating the application of the integrated concept. For example, research on VazaDengue: An information system for preventing and combating mosquito-borne diseases with social networks [31]. This study uses at least 4 DHI categories, namely Web applications, Mobile applications, Geographic Information Systems, and Social media.
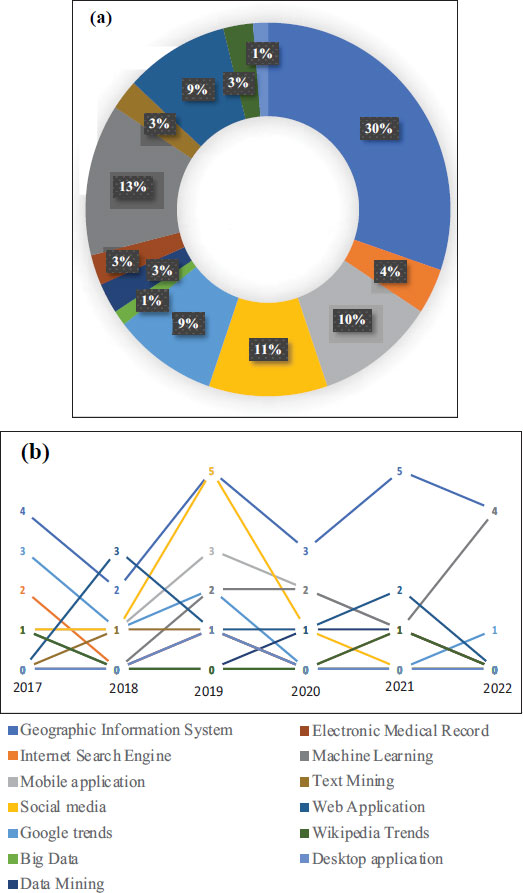
(b) Trends of DHIs on dengue surveillance.
Technological advances such as DHIs in dengue surveillance have enabled many countries to integrate surveillance data globally. However, international institutions such as the World Health Organization (WHO) must set standards related to policies or regulations, resources, and processes to integrate surveillance data globally. By integrating surveillance data for dengue, including clinical, entomological, microbiological/ serological, epidemiological, meteorological, and environmental information, we can gain a holistic understanding of the dengue situation and effectively predict and respond to epidemics [32–36].
This study found 13 different DHIs categories in Dengue surveillance with annual trends (Fig. 3b). GIS is consistently used in Dengue fever surveillance every year. However, there is an interesting thing, namely machine learning that has begun to appear in the last 2 years in Dengue surveillance. This possibility is related to the desire of researchers to predict Dengue incidences. With the use of ICT and other technologies, machine learning is becoming a crucial approach in the field of digital health [37, 38].
3.3. Geographical Distribution of Digital Health in Dengue Surveillance Studies
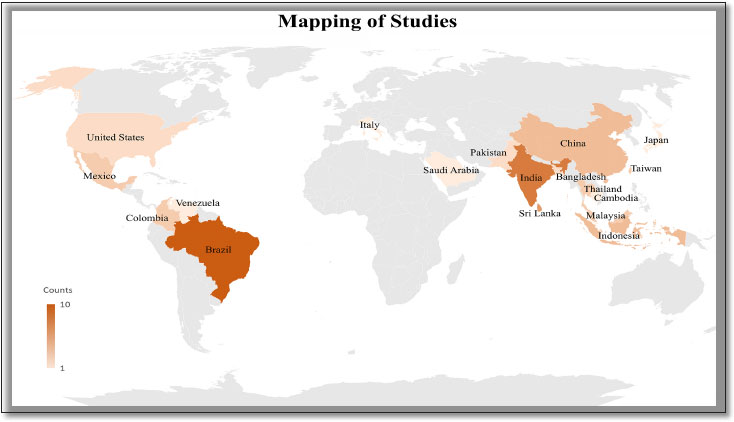
Fig. (4) displays the distribution of the article sites that were chosen for a study concerning the use of digital health in Dengue surveillance around the globe. According to the papers analyzed, Brazil (10 articles), India (8 articles), Sri Lanka (6 articles), China (4 articles), and Indonesia (4 articles) are the top 5 countries for using DHIs in Dengue surveillance. The articles are spread out throughout tropical nations, as seen on the map (Fig. 4). We found that a high number of publications in these countries correlated with a high Dengue prevalence. For example, in Brazil [39, 40], India [41], Sri Lanka [42, 43], China [44, 45], and Indonesia [43] which are also known as Dengue endemic countries.
Additionally, if we look deeper into the DHIs utilized in the top 5 countries, we find that they differ substantially. According to this study, social media (Twitter) is more dominantly discussed (5 articles) in Brazil, while GIS is more dominantly discussed in India (5 articles). Sri Lanka also discusses GIS (2 articles) and Mobile Apps (2 articles). Machine learning (3 articles) and internet search engines (3 articles) dominate in China. Lastly, there is no dominant force in Indonesia; each article discusses GIS, mobile apps, machine learning, and social media (Twitter).
3.4. The Purpose of DHIs in Surveillance Dengue
The purpose of the DHIs in these articles varies greatly depending on the type of DHIs, such as to identify risk areas, predict Dengue cases, develop an early warning model, assist in disease monitoring and surveillance, track Dengue case numbers, and others. Forecasting or predicting the incidence of Dengue is the objective that is most frequently discussed. However, there is an interesting research objective that is not widely discussed, namely the use of Twitter data to measure transmission based on human behaviors and movement. An algorithm is created to generate a dynamic mobility-weighted incidence index using geolocated data from Twitter (MI). According to this study, the MI index can improve timely decision-making within the public health system and is useful and significant for Dengue surveillance and early warning systems [46].
This review found various research designs mentioned in these review articles such as spatial analysis, cross-sectional studies, mixed method studies, design and development studies, big data analytics, data analytics, and ecological studies. The research design that is most widely used in researching DHIs in Dengue surveillance is the spatial analysis and this relates to GIS as the most discussed DHIs category in the previous paragraph. Furthermore, the most frequently used data sources, both conventional and digital, are surveillance data, climate data, internet big data, social media data, sociodemographic data, and remote sensing image data. More detailed information can be seen in Table 2.
| No. | Study/Refs. | Digital Health Interventions | Data Sources | Types of Studies | Purposes |
|---|---|---|---|---|---|
| 1 | Ashby et al. 2017 [47] | Geographic Information System | Surveillance data, population data, remote sensing data | Spatial analysis | To identify risk areas of Dengue fever |
| 2 | Guo et al. 2017 [48] | Internet Search Engines, Machine learning | Surveillance data, meteorological data, demographic data | Data Analytics | To develop an accurate Dengue prediction model |
| 3 | Li et al. 2017 [49] | Internet Search Engine | Baidu website, surveillance data, meteorological data, demographic data | Data Analytics | To develop an early warning model by integrating query data from the internet into traditional surveillance data |
| 4 | Lwin et al. 2017 [50] | Mobile applications | Real-time data from the mobile app | Development study | To digitize form completion and collect site visit information, real-time surveillance of Dengue outbreaks, infographics, and education |
| 5 | Marques-Toledo et al. 2017 [51] | Social media | Surveillance data, Twitter data, sociodemographic data, big data Google, Wikipedia data | Data Analytics | To evaluate and demonstrate the utility of tweet modelling in Dengue estimate and forecasting |
| 6 | Sirisena et al. 2017 [22] | Geographic Information System | Meteorological data, surveillance data | Spatial analysis | To map and evaluate the spatial and temporal distribution of Dengue in Sri Lanka from 2009 to 2014, and to investigate the relationship between climatic factors and Dengue incidence |
| 7 | Strauss et al. 2017 [24] | Google Trends | Big data Google, Surveillance data | Analysis trend/ time series | To compare the accuracy of GDT with traditional surveillance systems in Venezuela |
| 8 | Valson et al. 2017 [52] | Geographic Information System | Meteorological data | Spatial analysis | To analyze the spatiotemporal clustering of Dengue cases and their climatic and physiological environmental correlations |
| 9 | Yang et al. 2017 [53] | Google Trends | Big data Google | Data Analytics | To generate near-real-time Dengue case estimations in five countries/states: Mexico, Brazil, Thailand, Singapore, and Taiwan |
| 10 | Manogaran et al. 2018 [54] | Big data, Geographic Information Systems | Meteorological data | Data Analytics | To propose a big data-based surveillance system that analyses spatial climate big data and performs continuous monitoring of the correlation between climate change and Dengue |
| 11 | Ho et al. 2018 [55] | Google Trends | Big data Google, Surveillance Data | Data Analytics | To evaluate the health-seeking behavior based on Dengue-related search queries and to assess the temporal association between weekly GDT and Dengue occurrence |
| 12 | Hussain-Alkhateeb et al. 2018 [56] | Web applications | Meteorological, epidemiological, and entomological indicator | Development study | To detect potential Dengue epidemics and initiate early response activities |
| 13 | Rizwan et al. 2018 [57] | Web applications, Geographic Information Systems | Surveillance data | Design and development study | To assist in disease monitoring and surveillance |
| 14 | Sousa et al. 2018 [31] | Web applications, Mobile applications, Geographic Information Systems, Social media | Twitter database | Design and development study | To assist in Dengue monitoring and surveillance |
| 15 | Villanes et al. 2018 [58] | Text mining | Online news | Text mining | To describe, analyze and predict Dengue cases |
| 16 | Babu et al. 2019 [59] | Mobile applications, Geographic Information Systems | Surveillance data | Development study | To upload surveillance data, collect key environmental parameter data, collect relevant information from the community, and generate dynamic risk maps. |
| 17 | Jain et al. 2019 [60] | Machine learning, Geographic Information System | Meteorological data, clinical data, socioeconomic data, and the data encoding spatial | Big Data Analysis | To forecast the occurrence of Dengue fever within a geographical area |
| 18 | Lwin et al. 2019 [61] | Mobile applications | Surveillance data | Design and development study | To increase the flow of information and improve Dengue surveillance, with the ultimate goal of reducing disease spread |
| 19 | Ocampo et al. 2019 [62] | Mobile applications, Geographic Information Systems, Web Based Application | Surveillance data | Design and development study | To facilitate the capture and analysis of epidemiological information, mapping, visualization in graphical reports, real-time monitoring, and risk stratification. |
| 20 | Zhang et al. 2019 [63] | Text mining | Online news | Big Data Analysis | To track Dengue case numbers and provide near real-time reporting on outbreak development |
| 21 | Guo et al. 2019 [64] | Internet Search Engines, Geographic Information Systems, Machine Learning, Social media | Surveillance data, social media data, climate data, | Development study | To develop an ensemble penalized regression algorithm (EPRA) to begin near-real-time predictions of the Dengue epidemic trajectory |
| 22 | Ledien et al. 2019 [65] | Desktop application | Surveillance data | Development study | To identify appropriate tools for improving the early warning system and preparation |
| 23 | Mizzi 2019 [66] | Google trends, social media | Online data | Data Analytics | To forecast Dengue incidence |
| 24 | Ramadona et al. 2019 [46] | Social media | Online data | Development study | To design an algorithm to estimate a dynamic mobility-weighted incidence index (MI), which assesses the level of exposure to virus importation in any particular area, to quantify the Dengue virus importation pressure in each study neighborhood monthly |
| 25 | Rangarajan et al. 2019 [67] | Electronic Medical Records, Google Trends | Medical Records of Patient, online data | Data Analytics | To forecast Dengue incidence |
| 26 | Souza et al. 2019 [68] | Social media, Geographic Information Systems | Online data | Data Analytics | To create two probability models to characterize high-risk areas |
| 27 | Damayanti et al. 2020 [69] | Machine learning | Surveillance data | Big Data Analysis | To predict the occurrence of Dengue |
| 28 | Faridah et al. 2020 [70] | Web applications | Surveillance data | Evaluation study | To provide surveillance data, visualize, report, and support decision making |
| 29 | Herbuela et al. 2020 [29] | Mobile application, Geographic Information System | Real-time data from the mHealth app | Design and development study | o enhance awareness, improve knowledge, and change attitudes about Dengue fever, health-seeking behavior, and intent-to-change behavior on Dengue fever prevention among users |
| 30 | Somboonsak 2020 [71] | Mobile application, Geographic Information System | Patient data from the Bureau of vector-borne diseases | Development study | To create predictions and alert people via smartphone |
| 31 | Amin et al. 2020 [72] | Machine learning, social media | Social media data | Data Analytics | To predict and monitor the epidemic outbreak |
| 32 | Khalique et al. 2020 [73] | Geographic Information System, data mining | Surveillance data | Data Analytics | To detect significant hotspots over a region to implement sentinel surveillance |
| 33 | Faridah et al. 2021 [74] | Geographic Information System | Surveillance data | Spatial analysis | To offer strategic information for the Dengue management program, to predict potential Dengue outbreaks, to improve information needed for effective planning, and to investigate the demographic pattern of Dengue cases |
| 34 | Gulley et al. 2021 [75] | Electronic Medical Record | Medical Record of Patient | Data Analytics | To assess temporal and demographic factors |
| 35 | Herbuela et al. 2021 [76] | Mobile applications | Respondent | Cross-sectional mixed method study | To provide early detection of disease outbreaks |
| 36 | Parikh et al. 2021 [77] | Web-based, Geographic Information System, Machine Learning | Database: WHO, PAHO, World Bank, and Gideon | Design and development study | To detect the infectious disease re-emergence (Dengue) |
| 37 | Provenzano et al. 2021 [78] | Wikipedia Trends | Data from Wikipedia | Cross-sectional study | To assess the temporal relationship between Wikitrends and traditional surveillance data |
| 38 | Ramesh et al. 2021 [79] | Geographic Information System | Surveillance data | Cross-sectional study | To investigate the correlation between Dengue cases and vector indices |
| 39 | Ranwala et al. 2021 [80] | Web applications | Surveillance data | Development study | To provide an early warning and response system for Dengue, as well as to supplement existing surveillance |
| 40 | Tasnim et al. 2021 [81] | Data Mining, Machine Learning | Online news | Data analytics/ Data mining | To uncover useful information and create a Dengue news surveillance system |
| 41 | Withanage et al. 2021 [82] | Geographic Information System | Data from Survey | Cross-sectional study | To detect risk hotspots of Dengue |
| 42 | Lin 2022 [83] | Geographic Information System | Surveillance data | Spatial analysis | To identify the cluster and explore different routes of epidemic propagation |
| 43 | Al-Nefaie et al. 2022 [84] | Geographic Information System | Surveillance data | Cross-sectional study | To investigate the geographic patterns of Dengue cases to see if there is a correlation between the following environmental factors and Dengue fever |
| 44 | Baak-Baak et al. 2022 [85] | Machine learning | Surveillance data | Data Analytics | To conduct a spatial and temporal analysis of Dengue cases and deaths in Mexico |
| 45 | Carabali et al. 2022 [86] | Geographic Information System | Surveillance data | Spatial analysis | To quantify the contribution of the area- and observed case-specific variables while simultaneously analyzing the geographical distribution |
| 46 | Chang et al. 2022 [87] | Machine learning | Email Database | Data Analytics | To improve the efficiency of monitoring the epidemic situation in Southeast Asia |
| 47 | Harsha et al. 2022 [88] | Geographic Information System | Surveillance data, census data, satellite image data | Spatial analysis | To identify the Dengue risk areas |
| 48 | Koplewitz et al. 2022 [89] | Google trends, machine learning | Epidemiological data, weather data, and big data Google | Big Data Analytics | To estimate Dengue incidence |
| 49 | Masrani et al. 2022 [90] | Geographic Information System | Surveillance data | Spatial analysis | To examine changes in Dengue case trends and spatial patterns |
| 50 | Roster et al. 2022 [91] | Machine learning | Surveillance data | Data Analytics | To create a model for forecasting monthly Dengue cases in Brazilian cities one month in advance |
| 51 | Santana et al. 2022 [92] | Geographic Information System | Surveillance data | Ecological Study | To explore the spatiotemporal dynamics of Dengue-related mortality and to identify potentially linked factors. |
Based on the objectives of these DHIs for Dengue surveillance system, they are very relevant from the ONE Health perspective, especially for effective dengue prevention and control strategies. The ONE Health perspective recognizes the interconnectedness between human, animal, and environmental health. By integrating a surveillance system into the dengue intervention strategy, information on clinical cases, vector presence, and environmental conditions can be effectively monitored and analyzed to detect and respond to outbreaks in a timely manner. This integrated approach would involve linking clinical care, vector and virus surveillance, and environmental surveillance. This integration would also involve engaging community members and stakeholders from sectors not typically involved in disease control. By integrating surveillance systems into the dengue intervention strategy, we can improve the ability to detect and monitor the spatial and temporal distribution of dengue cases, identify high-risk areas for intervention, and establish alert thresholds for outbreaks [93–95].
3.5. Future Digital Health Interventions on Dengue Surveillance
This study provides several recommendations for future DHI research on Dengue surveillance, specifically regarding topics, objectives, and methodologies. First, we advise that studies on machine learning, big data, data mining, and other fields focus on predicting or forecasting upcoming Dengue outbreaks using a spatiotemporal approach. With a spatiotemporal approach, we will know when and where there is an increase in Dengue cases (outbreaks). This is closely related to the condition of predictors of Dengue events, which always change dynamically, such as environmental conditions, climate, mosquitoes (agents), humans (host), and others. The second point is related to the implementation method, our recommendation is to combine and integrate surveillance data sourced between conventional surveillance and digital surveillance so the accuracy can be relied upon. Finally, researchers can use data available on digital platforms for Dengue surveillance purposes.
Furthermore, we recommend researchers who will conduct research or develop DHIs for Dengue surveillance to leverage vaccination data as a data source. The utilization of vaccination data is an essential dimension of surveillance for Dengue, especially in areas where Dengue vaccines have been introduced. However, based on the studies we reviewed, no articles were found that used vaccine data as a source of DHIs data.
4. LIMITATIONS
This review has certain limitations. First, because of the wide scope of this study, the knowledge gap in DHIs on Dengue surveillance is also not very detailed, i.e., there are no specific categories of DHIs. Future study reviews may focus on a narrower scope to identify gaps at a deeper level; for example, the review may simply focus on the topic of machine learning and identify knowledge gaps on this topic. Second, neither the risk of bias nor the quality of the research reviewed were evaluated. So, the topic or theme may have been studied before but we don't have the quality of the study. Therefore, if you wish to research the same topic or theme, we recommend studying past studies carefully and designing their studies on top of previous studies, taking also into account the risk of bias and the quality of previous studies. Finally, this research can be used as a reference in researching and developing DHIs for Dengue surveillance according to the aims and needs of researchers.
CONCLUSION
This review has demonstrated the use of DHIs across tropical countries and the top 5 countries were Brazil, India, Sri Lanka, China, and Indonesia. There were 13 different categories of digital health and GIS dominates the use of digital health in Dengue surveillance followed by Machine Learning, Social Media, Mobile Applications, Google Trends, and Web Applications. A single Dengue surveillance program uses various DHIs simultaneously, indicating that the use of digital health was integrated. Future digital health on Dengue surveillance should explore the synergies across various combinations due to the significant emphasis on integrated health systems and interoperability to decide which packages of digital health are the most effective and efficient. Recommendations for future research should focus on how to leverage vaccination data and integrate all available data sources and methodologies to increase data completeness and predictive model accuracy so that Dengue outbreaks can be detected earlier.
AUTHORS’ CONTRIBUTION
Conceptualization: All authors ; Data curation: M.F.S., D.D.N. ; Formal analysis: M.F.S. ; Methodology: All authors ; Visualization: M.F.S. ; Writing–original draft: M.F.S. ; Writing–review & editing: all authors.
LIST OF ABBREVIATIONS
| LMICs | = Low And Middle-income Countries |
| WHO | = World Health Organization |
| DSS | = Dengue Shock Syndrome |
CONSENT FOR PUBLICATION
Not applicable.
STANDARDS OF REPORTING
PRISMA guidelines and methodology were followed.
AVAILABILITY OF DATA AND MATERIALS
The data and supportive information are available within the article.
FUNDING
None.
CONFLICT OF INTEREST
The authors have no conflict of interest to declare.
ACKNOWLEDGEMENTS
Declared none.
SUPPLEMENTARY MATERIAL
PRISMA checklist is available as supplementary material on the publisher’s website along with the published article.
Supplementary material is available on the publisher’s website along with the published article.

