All published articles of this journal are available on ScienceDirect.

Examining Fetal Growth Biometrics and Last Menstrual Period Correlation in Minangkabau Ethnicity during Third Trimester Ultrasound
Abstract
Background
Fetal growth significantly impacts well-being and health outcomes at birth, exerting a profound influence on the occurrence of perinatal complications and mortality rates.
Aim
This study aims to establish normal fetal growth data based on biometric variations in the Minangkabau ethnic group.
Methods
An analytical cross-sectional study focusing on pregnant women who underwent pregnancy check-ups was conducted in December 2020.
Results
A total of 520 pregnant women had third trimester ultrasounds. Most were aged 21-39 with one parity, had a senior high school education, and were unemployed. The strongest correlation (R=0.86) was between the last menstrual period (LMP) and biparietal diameter (BPD), while the weakest (R=0.79) was between LMP and head length (HL). All variables were highly significant (p<0.05).
Conclusions
Fetal growth biometrics (BPD, FL, HC, AC, and HL) were associated with LMP of third trimester ultrasound pregnancy on Minangkabau ethnic.
1. INTRODUCTION
The vital factors of fetal growth primarily impact the well-being and health outcomes at birth, influencing perinatal complications and mortality rates [1]. Fetal size and birth weight can be differentiated by considering the significant factors of maternal race and ethnicity [2, 3]. The study found that infants of European descent had significantly higher average weights compared to infants of Chinese descent and South Asian descent [2]. Based on prior indications, this phenotype appears to be mainly with genetic factors and/or influenced by maternal physiological exposure rather than being a result of behaviors, diet, or environmental factors during childhood or later stages of life [2, 4, 5].
Measuring fetal biometrics using ultrasonography (USG) has emerged as the preferred and reliable method for estimating babies' birth weight [6, 7]. With the continuous advancement of science, numerous approaches have been developed for measuring fetuses and estimating babies' birth weight. These include established formulas such as Jeanty, Aoki, Campbell, Shepard, and Hadlock and ongoing research endeavors to develop new methodologies [8]. Among formulas and growth charts for estimating fetal weight introduced by Hadlock, measuring biparietal diameter (BPD), femur length (FL), head circumference (HC), abdominal circumference (AC), and head length (HL) demonstrated greater accuracy in estimating fetal weight within a study encompassing 138 pregnant women [9-12].
Subsequently, longitudinal studies were conducted across multiple centers to establish fetal biometric standards for diverse populations. These studies, along with those conducted by reputable organizations, laid the groundwork for reevaluating the standard measurements of fetal growth [10]. Due to the limited representation of diverse global populations in existing multinational studies, there is a need to overcome this limitation by creating population-specific growth charts. To precisely reflect fetal growth within a specific population, these charts can be customized by incorporating challenging geographical environments, economic factors, economic circumstances, technological resources, cultural distinctions, and other pertinent variables [5, 12, 13].
It is important to note that racial/ethnic-specific standards for fetal growth, as demonstrated in studies like the NICHD Fetal Growth Studies, improve the precision of evaluating fetal growth [14]. Establishing normal fetal growth profiles, as outlined in studies by Anzaku et al., provides a precise overview of what constitutes normal or abnormal fetal growth [15]. Furthermore, reference charts of fetal biometric parameters specific to certain ethnic groups, such as the study on Nigerian women and Brazilian singleton pregnancies, serve as valuable references for clinical settings and high-risk cases [15, 16].
Studying fetal growth biometrics and establishing normal data are crucial aspects of prenatal care, especially in specific ethnic groups like the Minangkabau [17]. Fetal growth biometrics measurements are essential for estimating gestational age, monitoring fetal growth, and guiding clinical decisions [4, 18]. Additionally, fetal growth charts are valuable tools for evaluating the size of the fetus during pregnancy [19]. In the context of the Minangkabau ethnic group, studies like the one on fetal growth percentiles based on ethnic variations are essential for obtaining normal data specific to this group [17]. Understanding the correlation between fetal biometry and factors like the last menstrual period in specific ethnic populations, as highlighted in studies on the Minangkabau ethnic group, contributes to tailoring prenatal care to the needs of diverse populations [17, 20].
Currently, there is a dearth of established reference standards pertaining to fetal weight percentiles in Indonesia. The need for such standards becomes apparent given its status as a populous and developing nation with a diverse range of ethnicities and cultures, encompassing over 250 million individuals. Ensuring accurate identification and appropriate management of pregnancies, encompassing both healthy fetuses and those necessitating additional care, is of utmost importance. Therefore, the authors have set forth the objective of conducting research specifically dedicated to establishing reference standards that correspond to fetal growth patterns within the Indonesian population, with a particular emphasis on the Minangkabau ethnic group. Furthermore, it is crucial to elucidate the association between different variables measured in ultrasound examinations (BPD, AC, HC, HL, FL) and LMP.
The primary aim of this study is to establish comprehensive normal fetal growth data by examining biometric variations within the Minangkabau ethnic group. We aim to contribute to the body of knowledge concerning fetal development in ethnically diverse populations and inform clinical practices tailored to this specific demographic.
2. MATERIALS AND METHODS
2.1. Study Design
In December 2020, an analytical research study with a cross-sectional approach was conducted to evaluate fetal growth biometrics at Hospital M. Djamil Padang. The study focused on pregnant Minangkabau ethnic women for prenatal check-ups. Women willing to participate, having a single intrauterine pregnancy, and a gestational age ranging from 28 to 40 weeks, with a normal body mass index (BMI) of 18.5 to 24.9 were included. The exclusion criteria comprised fetal abnormalities, a previous occurrence of myoma or cyst disease while pregnant, high blood pressure, diabetes, kidney problems, heart conditions, autoimmune disorders (such as systemic lupus erythematosus), and a history of smoking, alcohol use, or prolonged usage of medications including steroids, antihypertensives, insulin. In total, 520 samples were obtained for this study. The dependent variables were fetal growth biometric measurements presented in millimeters. The independent variable was gestational age, which was presented in weeks.
This study involves human subjects and utilizes fetal materials. The ethical considerations of this research adhere to the principles outlined in the Declaration of Helsinki and have received approval from the local ethics committee (approved number: 333/KEPK/2021). All medical information pertaining to this research is treated confidentially. Participants have the right to decline participation if they do not consent. The researcher assumes responsibility for all research-related expenses and associated costs incurred during the study.
2.2. Statistical Analysis
Univariate analysis was conducted to provide a descriptive overview of the study's dependent (BPD, HC, AC, FL, and HL) and independent variables (gestational age). The frequency distribution of the variables will be represented in tabular form. The Pearson's R test was employed for the bivariate analysis. A descriptive summary of both the dependent and independent variables was analyzed using univariate analysis. A significant correlation between the variables was defined as a p-value < 0.05. Multivariate analysis employed linear regression to identify statistically significant variables. The total data were analyzed using the Statistical Package for the Social Sciences (SPSS).
2.3. USG Measurement
Diameter Biparietal involves measuring the maximal distance between the frontal and posterior parietal bones in the transverse occiput position. This measurement, most accurate between 12-28 weeks of gestation, aids in determining fetal age and weight and detecting cranial abnormalities like macrocephaly, microcephaly, or hydrocephalus. Achieving an accurate slice for BPD involves ensuring a symmetrical head shape, perpendicular alignment to the midline, and using low gain to prevent skull thickening artifacts. The oval head shape, confirmed by the cephalic index (normal 75-85), should reveal the thalamus, septum pellucidum, parts of the falx cerebri, and insula with the middle cerebral artery on the correct plane. Common errors in BPD measurement include asymmetric head slices, incorrect cutting planes, and improper transducer positioning.
Head Circumference measurement serves when cephalic indices deviate from normal, indicating conditions like brachycephaly or dolichocephaly. This measurement provides better results than BPD for determining gestational age and aids in diagnosing microcephaly or fetal growth restriction (FGR). To determine the optimal plane for BPD measurement, the cephalic index, the ratio of BPD to occipitofrontal diameter (OFD), is crucial. A cephalic index outside the normal range (0.75-0.85) substitutes BPD measurement with HC.
Abdominal Circumference measurement estimates fetal size, particularly liver height, reflecting nutritional status. Although less reliable for determining gestational age compared to BPD, FL, or HC, AC plays a crucial role in assessing fetal growth, estimating fetal weight, and diagnosing microcephaly.
Femur Length's accuracy spans ± 4-5 weeks. However, it cannot replace BPD but serves as a comparison or alternative when BPD measurement is challenging, such as in advanced gestation or cranial abnormalities like anencephaly.
Humerus length measurement follows a procedure similar to FL, aiding in identifying fetal lie. By aligning the transducer perpendicular to the ultrasound beam, the humerus length is measured from the origin to the distal end, encompassing the entire hardened portion until the epicondyles. This method assists in assessing fetal skeletal development and positioning during ultrasound examinations.
3. RESULTS
A total of 520 pregnant women attended their third trimester check-ups (28-40 weeks as determined by ultrasound). Table 1 describes the distribution of subject characteristics.
According to Table 1, the majority of pregnant women had ages ranging from 21-39 years and one parity. Most of our study subjects were at senior high school level and were not employed.
Table 2 provides the normal percentiles (5, 10, 25, 50, and 97) of gestational age biometrics based on LMP in the third trimester USG. The result illustrates increasing variability for all five variables.
| Characteristics | N (%) |
|---|---|
| Age (year), mean ± SD | 28.49 ± 4.5 |
| <20 | 11 (2.1) |
| 21-39 | 501 (96.3) |
| ≥40 | 8 (1.5) |
| Parity Status | - |
| 0 | 175 (33.7) |
| 1 | 203 (46.7) |
| ≥2 | 102 (19,6) |
| Education Status | - |
| Without higher education | 1 (0.2) |
| Junior high school | 12 (2.3) |
| Senior high school | 431 (82.9) |
| University | 76 (14.6) |
| Working Status | - |
| Government employee | 65 (12.5) |
| Non-government employee | 47 (9,0) |
| Self-employed | 111 (21.3) |
| Unemployed | 297 (57.1) |
Table 2.
| GA (Weeks) | Biometrics | Percentile of Fetal Growth (cm) | ||||
|---|---|---|---|---|---|---|
| 5 | 10 | 25 | 50 | 97 | ||
| 28 | BPD | 7,59 | 8,23 | 8,47 | 8,49 | 9,36 |
| 29 | 7,74 | 8,25 | 8,49 | 8,51 | 9,45 | |
| 30 | 8,09 | 8,55 | 8,56 | 8,52 | 9,5 | |
| 31 | 8,25 | 8,56 | 8,79 | 8,72 | 9,61 | |
| 32 | 8,47 | 8,66 | 8,81 | 8,73 | 9,73 | |
| 33 | 8,52 | 8,7 | 8,91 | 8,96 | 9,76 | |
| 34 | 8,53 | 8,74 | 8,96 | 9 | 9,79 | |
| 35 | 8,54 | 8,79 | 8,97 | 9,17 | 9,83 | |
| 36 | 8,57 | 8,87 | 9 | 9,22 | 9,84 | |
| 37 | 8,58 | 8,89 | 9,09 | 9,21 | 9,95 | |
| 38 | 8,59 | 8,9 | 9,11 | 9,32 | 10,24 | |
| 39 | 8,7 | 8,91 | 9,13 | 9,46 | 10,34 | |
| 40 | 8,71 | 8,92 | 9,26 | 9,88 | 10,45 | |
| 28 | HC | 29,76 | 29,78 | 30,48 | 30,72 | 31,14 |
| 29 | 29,81 | 29,86 | 30,5 | 31,33 | 32,23 | |
| 30 | 29,86 | 29,88 | 31,2 | 31,51 | 32,43 | |
| 31 | 30,14 | 30,13 | 31,34 | 31,52 | 33,48 | |
| 32 | 30,16 | 30,14 | 31,35 | 31,95 | 33,61 | |
| 33 | 30,23 | 30,27 | 31,66 | 31,97 | 33,65 | |
| 34 | 30,37 | 30,76 | 31,67 | 32 | 33,7 | |
| 35 | 30,67 | 30,93 | 31,68 | 32,1 | 34,22 | |
| 36 | 30,81 | 31,04 | 31,7 | 32,31 | 35,5 | |
| 37 | 30,86 | 31,06 | 31,77 | 32,65 | 36,15 | |
| 38 | 30,94 | 31,22 | 31,95 | 33,68 | 36,97 | |
| 39 | 30,95 | 31,38 | 31,97 | 33,79 | 37,05 | |
| 40 | 31,4 | 32,94 | 33,55 | 35,42 | 37,37 | |
| 28 | AC | 27,12 | 28,05 | 29,57 | 31,18 | 31,96 |
| 29 | 27,41 | 28,06 | 30,53 | 31,28 | 32,05 | |
| 30 | 27,55 | 28,29 | 29,56 | 31,73 | 32,67 | |
| 31 | 27,83 | 28,54 | 29,58 | 31,96 | 33,84 | |
| 32 | 27,84 | 29,29 | 30,68 | 32,03 | 34,32 | |
| 33 | 27,88 | 29,56 | 30,89 | 32,1 | 35,8 | |
| 34 | 28,66 | 29,75 | 30,92 | 32,82 | 36,1 | |
| 35 | 29,68 | 30 | 31,06 | 33,33 | 36,2 | |
| 36 | 29,71 | 30,14 | 31,56 | 33,91 | 36,48 | |
| 37 | 29,75 | 30,82 | 32,87 | 34,17 | 36,53 | |
| 38 | 30,23 | 30,95 | 32,89 | 34,24 | 37,63 | |
| 39 | 30,34 | 31,11 | 33,11 | 35,25 | 37,65 | |
| 40 | 30,91 | 32,12 | 34,27 | 36,41 | 38,92 | |
| 28 | FL | 5,62 | 6,18 | 6,58 | 6,96 | 7,35 |
| 29 | 5,68 | 6,26 | 6,78 | 7,02 | 7,38 | |
| 30 | 5,87 | 6,47 | 6,83 | 7,06 | 7,43 | |
| 31 | 5,89 | 6,5 | 6,86 | 7,09 | 7,5 | |
| 32 | 6,07 | 6,58 | 6,87 | 7,13 | 7,57 | |
| 33 | 6,13 | 6,62 | 6,88 | 7,17 | 7,58 | |
| 34 | 6,19 | 6,65 | 6,9 | 7,22 | 7,61 | |
| 35 | 6,33 | 6,68 | 6,97 | 7,25 | 7,63 | |
| 36 | 6,35 | 6,69 | 7,02 | 7,26 | 7,66 | |
| 37 | 6,44 | 6,7 | 7,06 | 7,29 | 7,73 | |
| 38 | 6,61 | 6,78 | 7,1 | 7,31 | 7,74 | |
| 39 | 6,64 | 6,86 | 7,18 | 7,34 | 7,77 | |
| 40 | 6,68 | 7,1 | 7,25 | 7,37 | 7,91 | |
| 28 | HL | 5,16 | 5,35 | 5,81 | 5,97 | 6,64 |
| 29 | 5,19 | 5,55 | 5,85 | 5,99 | 6,72 | |
| 30 | 5,22 | 5,57 | 5,91 | 6,12 | 6,73 | |
| 31 | 5,31 | 5,65 | 5,96 | 6,14 | 6,75 | |
| 32 | 5,41 | 5,69 | 5,99 | 6,22 | 6,79 | |
| 33 | 5,54 | 5,73 | 6,01 | 6,23 | 6,95 | |
| 34 | 5,59 | 5,76 | 6,02 | 6,24 | 7,08 | |
| 35 | 5,6 | 5,77 | 6,04 | 6,33 | 7,11 | |
| 36 | 5,62 | 5,78 | 6,06 | 6,35 | 7,15 | |
| 37 | 5,63 | 5,8 | 6,11 | 6,38 | 7,21 | |
| 38 | 5,73 | 5,81 | 6,15 | 6,4 | 7,27 | |
| 39 | 5,75 | 5,84 | 6,22 | 6,61 | 7,43 | |
| 40 | 5,76 | 5,85 | 6,28 | 6,87 | 7,62 | |
Fig. (1) displays the chart illustrating the normal percentiles of typical fetal growth biometrics from the LMP to the third trimester USG examination in Minangkabau ethnic.

|
Dependent Variable (weeks) |
Independent Variables (cm) | Pearson Correlation R | P-value |
|---|---|---|---|
| LMP | BPD | 0,86 | 0,001 |
| LMP | HC | 0,82 | 0,001 |
| LMP | AC | 0,82 | 0,001 |
| LMP | FL | 0,84 | 0,001 |
| LMP | HL | 0,79 | 0,001 |
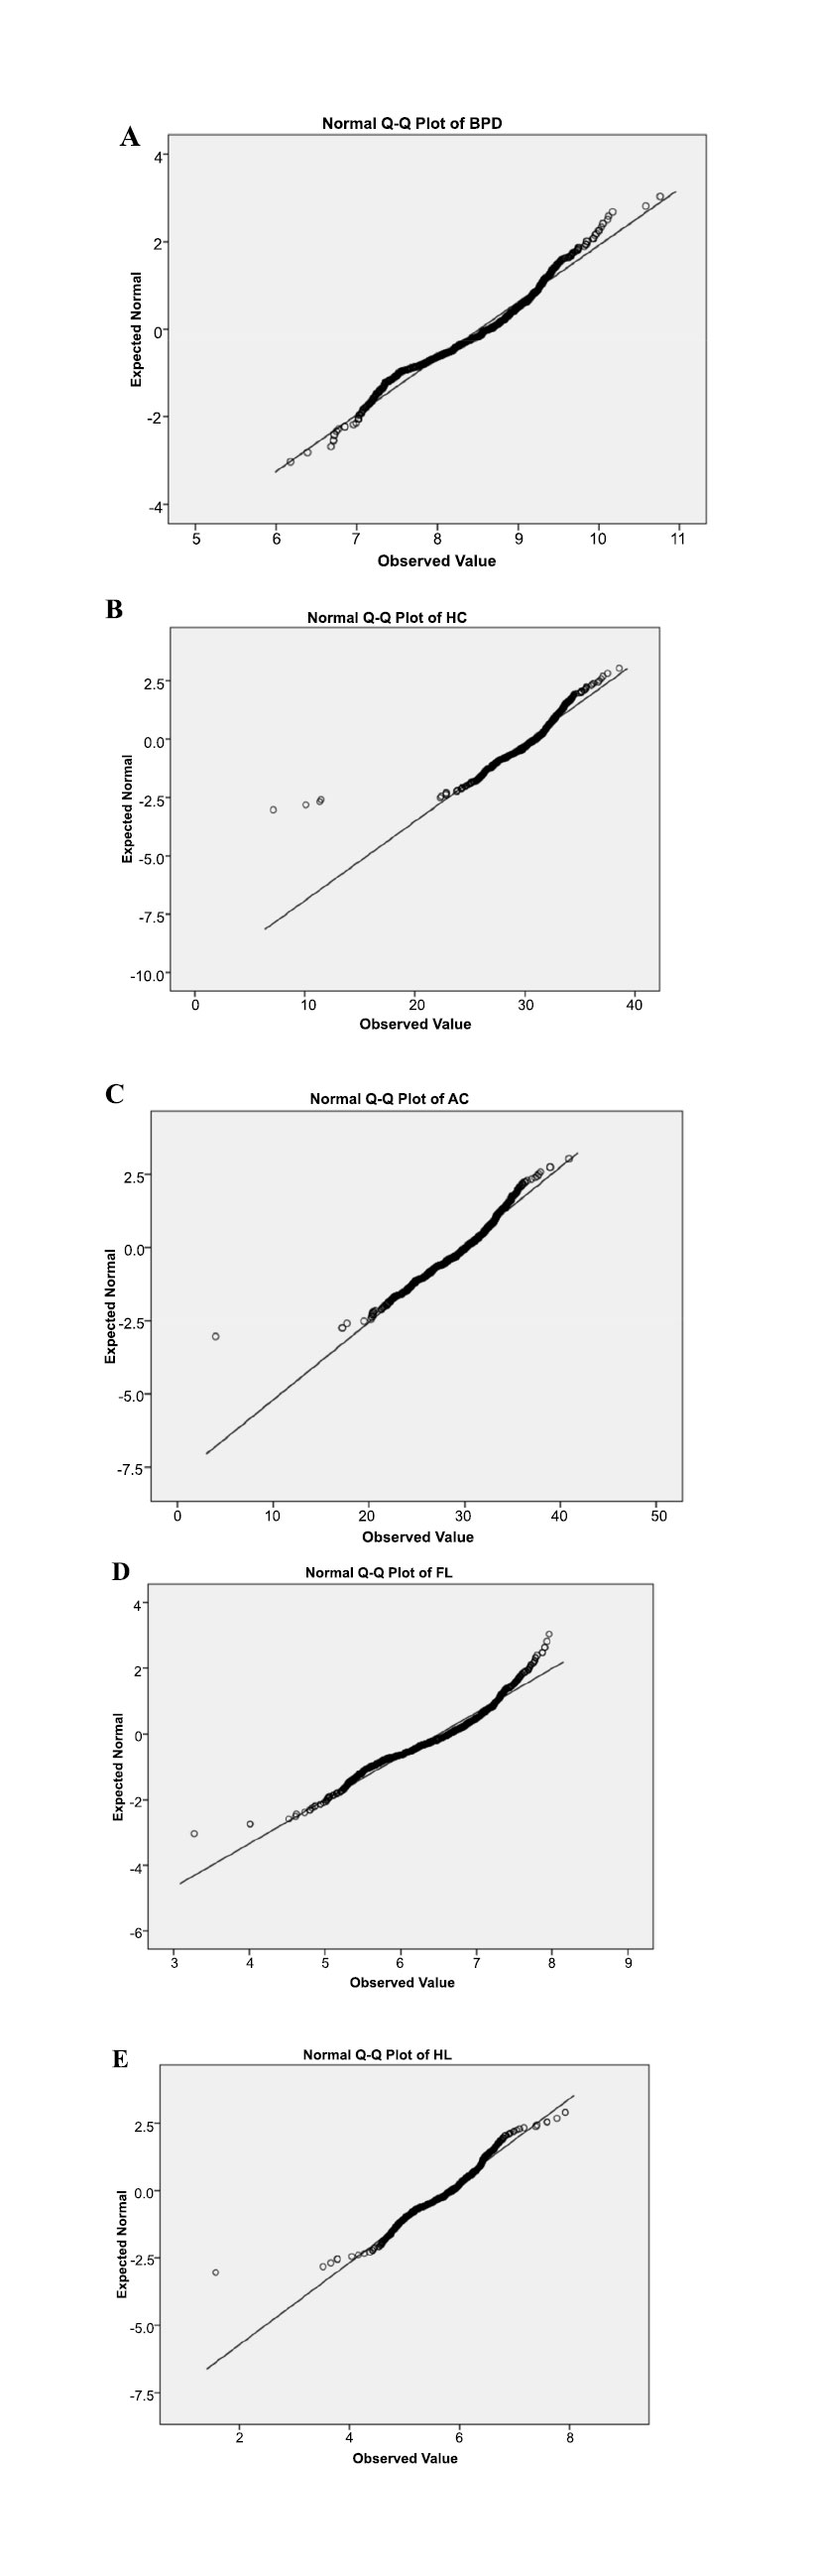
The correlation between fetal growth biometrics during pregnancy is depicted in Table 3 and plotted in Fig. (2).
The analysis of Table 3 reveals that the strongest correlation exists in BPD, followed by FL, HC, and AC, with the lowest correlation being HL. Notably, all the variables demonstrated p value < 0,05 (statistically significant).
4. DISCUSSION
The assessment of fetal growth during the third trimester of pregnancy is crucial for identifying potential risks and ensuring the well-being of both the mother and the fetus. Ultrasound has been widely utilized for this purpose, with studies supporting its effectiveness in assessing fetal growth [21]. Routine third trimester ultrasound scans have been found to incidentally identify fetal abnormalities, emphasizing the importance of such assessments [22]. The role of third trimester ultrasound in low-risk pregnancies has also been studied to assess its impact on antenatal interventions and perinatal outcomes [23]. Additionally, ultrasound monitoring in the second and third trimesters has been proposed to prevent complications such as chronic hypertension with preeclampsia [24]. Furthermore, studies have focused on the accuracy of ultrasound in assessing fetal growth, emphasizing its essential role in antenatal care [25].
Based on the subject characteristics, our study revealed that the majority of third trimester pregnancies were at the reproductive age. Most of the subjects have experienced at least one previous pregnancy or have parity. In terms of maternal education, the highest proportion achieved a senior high school level of education. Regarding job status, a majority of the subjects were unemployed and primarily identified as housewives. These factors play a significant role as determinants of fetal growth.
Data were analyzed based on ethnicity in a previous study involving 6044 pregnant women in the Netherlands. The study revealed that Dutch pregnant women had an average age of 31.2 ± 4.5 years, while pregnant women of non-Dutch ethnicity had an average age of 26.1 ± 5.4 years. Dutch women had a higher percentage of parity at 58.6%, compared to non-Dutch women at 38.0%. Regarding educational attainment, Dutch women had a significantly higher percentage at 56.7% compared to non-Dutch women at 12.2% [1]. These findings support the important role of educational level, maternal age, and parity status, although their impact is relatively modest when compared to maternal and parental height, as well as a shorter gestational age [1-4]. Therefore, it can be inferred that nulliparity may not pose a significant risk to fetal growth.
Conversely, a separate study by Chiara di Gravio et al. highlighted a significant occurrence of maternal age at both early ages (≤19 years) and advanced ages (≥35 years). It has been observed that maternal age during pregnancy is associated with adverse fetal and birth outcomes. More precisely, There is a correlation between younger maternal age and an increased risk of fetal growth restriction, preterm delivery, low birth weight, being small for gestational age, and neonatal mortality [3, 5-7]. Maternal nulliparity is considered a risk factor for suboptimal maternal hemodynamic adaptations during pregnancy, potentially leading to adverse effects on fetal nutrient supply. Infants born to nulliparous mothers tend to exhibit slower fetal growth rates starting from the third trimester, followed by accelerated growth rates during infancy [8].
In the study conducted in Bangladesh by Ferdous et al., 2678 pregnancies involving singletons were analyzed. The average maternal age was 25.9 years (standard deviation [SD] of 5.8), ranging from 14 to 47 years. Nulliparous women accounted for approximately one-third (33.0%) of the participants. Only 68.3% of the women possessed basic reading and writing skills. The average maternal height was 149.9 cm (SD of 5.3). Additionally, the mean early pregnancy body mass index (BMI) was 20.1 kg/m2 (SD of 2.6), and 27.6% of the women were categorized as underweight [4].
The assessment of fetal growth using ultrasound biometrics such as BPD, HC, AC, HL, and FL is crucial for monitoring fetal development and identifying potential growth abnormalities. Studies have explored various aspects of fetal growth assessment using ultrasound and have provided valuable insights into the use of these biometric measurements. Comparing fetal organ measurements using ultrasound and magnetic resonance imaging highlights the standard ultrasound biometry assessment, including measurements such as BPD, HC, and AC [21]. This emphasizes the significance of these biometric parameters in routine fetal growth assessment. Additionally, a community-based longitudinal study obtained BPD, HC, AC, FL, and estimated fetal weight at different gestational ages, providing valuable data for assessing fetal growth patterns [26]. Furthermore, it aimed to produce customized quantile regression-based fetal biometric nomograms, including BPD, HC, and AC, using a large database of biometric data obtained from ultrasound units [27]. This study underscores the importance of developing customized growth charts based on these biometric parameters to assess fetal growth accurately.
Moreover, examined the impact of biometric measurement error on identifying small- and large-for-gestational-age fetuses, emphasizing the significance of accurate AC, HC, and FL measurements in assessing fetal growth [28]. Additionally, the hypothesis presented that percentile values of AC, estimated fetal weight, and FL are highly correlated with neonatal birth weight, highlighting the prognostic power of these biometric measurements in fetal growth restriction [29]. Furthermore, it was discussed that fetal body proportions, including the HC to AC ratio and FL to AC ratio, were used to classify fetuses as either symmetric or asymmetric, demonstrating the importance of considering multiple biometric measurements in assessing fetal growth and body proportion [30]. This highlights the significance of utilizing a combination of biometric measurements to evaluate fetal growth comprehensively.
Using percentile grouping (5, 10, 25, 50, and 97) as represented in Table 2 and Fig. (1), our study found increased variability across all variables with advancing gestational age. Our previous publication also reported that the mean fetal biometrics in the third trimester, compared to gestational age based on the LMP, demonstrated significant differences among the Minangkabau ethnic group. For instance, at 28 weeks of gestation, the variable BPD measured 7.37 cm, whereas at 40 weeks, it increased to 9.54 cm. Similarly, the variable AC recorded 24.01 cm at 28 weeks and 33.49 cm at 40 weeks gestation [17].
The study conducted in the Kingdom of Saudi Arabia by Al Marri et al. analyzed the average values of BPD for each week of GA. The findings revealed consistent growth patterns in BPD values throughout each week. However, the differences compared to BPD values from other countries such as the USA, Norway, Australia, Zimbabwe, India, China, and Malaysia were not statistically significant. Consequently, the authors strongly recommend using these newly established BPD values by medical practitioners as the reference range for fetal biometry specific to the Saudi Arabian population. By adopting these reference values, healthcare providers can enhance the quality of care and well-being for both mothers and their fetuses [9, 10]. In line with Al Marri's study, which focused on establishing the new BPD variable in Saudi Arabia, our study endeavors to develop a similar standard and value for the BPD variable specifically applicable to practitioners in Indonesia, particularly among the Minangkabau ethnic group. This study aims to provide healthcare practitioners with a reliable tool for assessing fetal growth by introducing the new BPD variable.
Jhonsons S.L.'s study titled “Longitudinal reference charts for growth of the fetal head, abdomen, and femur” elucidated that the BPD length measures 7.5 cm at 28 weeks and 11.3 cm at 40 weeks of gestation. The abdominal circumference (AC) variable also measured 24.0 cm at 28 weeks and 36.0 cm at 40 weeks. Furthermore, various literature highlights significant disparities in body weight, length, and head circumference among infants based on their ethnicity [9]. This suggests that variations in biometric measurements exist between foreigners and Indonesians. This indicates that the fetal size among foreigners tends to be larger than that of Indonesians. Consequently, there is a need for more specific data on the size of Indonesians, particularly within the Minangkabau ethnic group.
A study in Bangladesh observed that the fetal growth rate declined more in the third trimester compared to the two reference charts. This trend was particularly evident in the BPD and AC measurements. The average growth per week for BPD was 34.7 mm up to 20 weeks, followed by 60.8 mm from 21 to 29 weeks and 81.7 mm from 30 to 37 weeks. Regarding the AC, there was a growth rate of 110.0 mm per week until 20 weeks, followed by a rate of 198.4 mm between 21 and 29 weeks, and finally a rate of 276.4 mm up to 37 weeks. However, a slightly different growth pattern was observed for the HC and FL. HC's growth rate was comparatively lower, up to 29 weeks, but it exceeded that of both international references during the final trimester. The HC exhibited a growth of 131.4 mm up to 20 weeks, followed by 229.7 mm from 21 to 29 weeks, and 306.4 mm up to 37 weeks [4].
This study examined the correlation between fetal growth and various variables in the Minangkabau ethnic group. The results showed a strong correlation between LMP and BPD, indicating a relationship between gestational age and biparietal diameter. Other variables, such as HC, AC, FL, and HL, also demonstrated correlations with LMP. These findings highlight the importance of considering these variables in assessing fetal growth and development. Our study's findings align with previous research highlighting the importance of accurate gestational age estimation in assessing fetal growth. Thorsell et al. emphasized the impact of accurate dating methods on obstetric outcomes, particularly in identifying fetal growth restriction and its association with adverse pregnancy outcomes [31]. Furthermore, discrepancies between gestational age estimated by LMP and BPD were linked to an increased risk of fetal death and adverse pregnancy outcomes [32]. This underscores the critical nature of precise gestational age assessment in predicting fetal well-being.
The relevance of fetal growth trajectories in different ethnic groups was demonstrated by Sletner et al., who examined the impact of gestational diabetes on fetal growth trajectories in European and South Asian mothers [7]. This highlights the influence of ethnic diversity on fetal growth patterns and the necessity of considering ethnic-specific factors in fetal growth assessment. The use of ultrasound in assessing fetal growth was also supported by Endres & Cohen, who discussed the reliability and validity of three-dimensional fetal brain volumes, emphasizing the significance of advanced imaging techniques in evaluating fetal growth [33]. Additionally, the study background can incorporate the ethnomedicinal practices related to pregnancy and childbirth, particularly in the Minangkabau ethnic group, as cultural practices and beliefs may influence maternal and fetal health outcomes [34].
In the study conducted by Ferdous F. et al., fetal growth charts specific to the Bangladeshi population were developed. The results revealed that the biparietal diameter and abdominal circumference exhibited significantly smaller growth throughout pregnancy compared to the reference values (P ≤ 0.05). Growth restriction for all parameters began in the second trimester. Identifying the critical period of fetal growth restriction is crucial to enable appropriate nutritional interventions at the pre-pregnancy and early pregnancy stages. These findings contribute to assessing fetal size and growth and emphasize the importance of enhancing the health status of women of reproductive age in developing countries [4].
Fetal biometry was examined in the study conducted by Jacquemyn et al. on Belgians and Non-Belgians (from Turkey and Morocco). The findings revealed no statistically significant distinction in BPD across the three ethnic groups (p-value = 0.39). However, variations were observed in HC, AC, FL, and estimated fetal weight. Considering these findings, it is recommended to use adjusted charts for fetal size, specifically for pregnant women of Turkish or Moroccan origin [2, 11, 12]. Moreover, our study suggests that the BPD of Indonesians significantly impacts LMP, likely due to genetic variations between European and Mediterranean ethnicities compared to Indonesians. Therefore, it can be concluded that head circumference, abdominal circumference, and femur length of individuals from European and Mediterranean backgrounds have a greater influence on gestational age according to LMP, with femur length having the strongest effect compared to other variables. This can be attributed to the height-related genetic differences, which are significantly higher in Europeans and Mediterraneans compared to Indonesians.
A similar study involving ethnicity was conducted on the Sudanese population. The study also measured fetal growth biometrics and aimed to examine the accuracy of formulae used to estimate fetal weight, and statistically significant results were found [10, 13, 35]. The study also provided the correlation between fetal biometrics and last LMP on fetal growth.
According to the Hadlock study, there is greater variability in predicting menstrual age using abdominal circumference measurements compared to fetal biparietal diameter. However, in cases where obtaining the biparietal diameter measurement is technically challenging or not feasible due to unusual positioning, the abdominal circumference measurement can serve as a useful adjunct in predicting menstrual age. Furthermore, preliminary experience (unpublished data) suggests that employing a combination of growth parameters such as BPD, HC, AC, and FL provides greater accuracy in predicting menstrual age compared to relying on individual parameters alone, particularly in the third trimester of pregnancy [10, 13]. Finally, all the papers in this study confirm a significant association between each biometric variable (BPD, HC, AC, FL, and HL) and gestational age according to LMP. Whether the relationships are described individually, as found in several studies, or collectively to establish a significant relationship between all these variables and gestational age according to LMP, the evidence supports their interconnection. Moreover, this study highlights the impact of ethnic differences on fetal growth, along with other factors such as maternal weight, height, age, and parity. Therefore, it is crucial to develop fetal growth curves considering diverse maternal and fetal characteristics among different ethnicities.
While the study on fetal growth patterns among the Minangkabau ethnic group in Indonesia provides valuable insights into establishing reference standards for this specific population, certain limitations should be acknowledged. Firstly, the study's exclusion criteria, which involve factors such as maternal health conditions (high blood pressure, diabetes, etc.) and lifestyle choices (smoking, alcohol use), may inadvertently limit the generalizability of the findings, as these factors can also influence fetal growth. Additionally, the study's cross-sectional design and focus on a specific ethnic group within Indonesia might limit the extrapolation of results to the broader Indonesian population or other ethnic groups. Though sufficient for the study's objectives, the relatively small sample size of 520 pregnant women may not fully capture the diverse range of factors influencing fetal growth in a population of over 250 million individuals. Moreover, the study predominantly relies on ultrasound measurements. While ultrasound is a widely accepted method, it is not without inherent measurement errors, which could affect the precision of the fetal biometric data. Finally, the absence of established fetal weight percentiles in Indonesia may pose challenges in comparing and validating the study's findings against existing international standards. Despite these limitations, the study represents a commendable effort to address the dearth of population-specific growth charts in Indonesia, emphasizing the need for tailored approaches to fetal growth assessment in diverse populations.
CONCLUSION
Our study provides valuable insights into the fetal growth characteristics of 520 pregnant women in their third trimester check-ups within the Minangkabau ethnic group. The subject characteristics, including age, parity, education, and employment status, shed light on the demographic profile of the study population. The comprehensive analysis of normal percentiles for biometrics at different gestational ages offers a detailed understanding of fetal growth patterns. The correlation analysis demonstrates strong associations between various fetal growth biometrics and gestational age based on the LMP. The study emphasizes the significance of considering ethnic-specific factors in fetal growth assessment, as evidenced by variations in growth trajectories observed in different populations. The findings contribute to the ongoing efforts to establish standardized intrauterine fetal growth charts tailored to the Minangkabau ethnic group, thereby enhancing the precision of assessing fetal well-being in this population. Additionally, the study underscores the importance of accurate gestational age estimation and the potential impact of maternal characteristics on fetal growth. Overall, this research adds to the existing body of knowledge on fetal development, supporting the need for population-specific references to optimize maternal and fetal healthcare practices.
LIST OF ABBREVIATIONS
| LMP | = Last Menstrual Period |
| BPD | = Biparietal Diameter |
| HL | = Head Length |
| USG | = Using Ultrasonography |
| BMI | = Body Mass Index |
| SPSS | = Statistical Package for the Social Sciences |
| FGR | = Fetal Growth Restriction |
ETHICS APPROVAL AND CONSENT TO PARTICIPATE
The ethical considerations of this research have received approval by the local ethics committee (approved number: 333/KEPK/2021).
HUMAN AND ANIMAL RIGHTS
No animals were used in this research. All procedures performed in studies involving human participants were in accordance with the ethical standards of institutional and/or research committees and with the 1975 Declaration of Helsinki, as revised in 2013.

