All published articles of this journal are available on ScienceDirect.

Small Area Estimation of HIV/AIDS Prevalence in South Africa using a Neural Method
Authors Info & Affiliations
Abstract
Introduction/Background
Despite country-wide surveys and monitoring HIV/AIDS infections, the true prevalence can be hidden for areas with small population densities and lack of data, especially among vulnerable groups. Accurate estimation of HIV/AIDS prevalence is essential for tailoring effective interventions and resource allocation. Traditional survey-based methods for estimating disease prevalence often face limitations, particularly in small geographical areas where data may be sparse or unavailable.
Materials/Methods
This study applied a novel approach, leveraging a Neural method, an advanced machine learning technique for small area estimation (SAE), using the 2017 SABSSM and 2011 South Africa Census dataset. SAE was trained using both the “Neural method” and “Genetic method,” and the data was split randomly on a number of different iterations (70% training ― 30% training; 50% testing ― 50% testing; 80% training ― 20% testing) until the best and desirable output was achieved.
Results
The findings from the study highlight the feasibility of the model in obtaining reliable HIV/AIDS prevalence estimates in South Africa at the enumeration area across nine provinces, with an average correlation of 0.88 and R2 = 0.82. Overall, from all provinces, race was found to be significant in predicting HIV/ADS prevalence, followed by urban geographic location and sex.
Discussion
These results can help in identifying high HIV/AIDS prevalent areas to inform location-based or geotargeted interventions and policies to efficiently reduce the spread of HIV/AIDS in South Africa. The research contributes to the advancement of SAE techniques in the context of public health, showcasing the potential of artificial intelligence and machine learning to address pressing health challenges.
Conclusion
By providing granular and up-to-date estimates of HIV/AIDS prevalence, this approach assists in the ongoing efforts to combat HIV/AIDS in South Africa.
1. INTRODUCTION
The South African National HIV Prevalence, Incidence, Behaviour, and Communication Survey’s (SABSSM) core principle is to inform public health policies and programmes. In the past decade, SABSSM surveys have highlighted a slight increase of 1.8% in HIV/AIDS prevalence between 2012 (12.2%) and 2017 surveys (14.0%) [1]. These surveys have been instrumental in providing important insights into HIV statistics at the provincial level, guiding government policy in targeted interventions [2-4]. HIV epidemic has had profound social, as well as economic, consequences, affecting millions of people across South Africa. According to recent statistics, approximately 7.7 million people are living with HIV/AIDS in South Africa [5-7]. The burden of the disease continues to vary widely across different regions and population groups within the country. In urban areas, particularly informal settlements and peri-urban communities, HIV/AIDS prevalence tends to be higher due to poverty, unemployment, and limited access to healthcare services. Despite efforts to expand preventive initiatives, bolstering testing and treatment accessibility, socioeconomic inequalities linked with the epidemic persist, further exacerbating the disparities. It is of paramount importance to realize that the HIV/AIDS epidemic burden is heterogeneous across space, more specifically at lower geographical levels [2]. Nationwide surveys (traditional approaches) come short in the provision of sufficient, reliable and dependable local-level HIV/AIDS estimates [3]. These traditional survey approaches often use random sampling methods to select respondents, of which, at local level, the population may be small, leading to insufficient sample sizes, resulting in high variability and imprecise estimates. Additionally, traditional surveys struggle to achieve representative samples at the local level due to nonresponse bias, where certain groups would not participate in the survey. Therefore, extracting adequate subnational estimates from probability surveys, such as SABSSM in South Africa, would require a substantial increase in sample size [6]. Alternatively, models which utilise auxiliary data are crucial to obtain accurate subnational-level estimates without the need to significantly increase sample size [1, 4, 6, 8-15]. Small area estimation (SAE) plays a crucial role in addressing the complex spatial dynamics of HIV/AIDS in South Africa, leveraging available SABSSM data and auxiliary information. SAE techniques enable the estimation of HIV/AIDS prevalence at a granular level. Additionally, they offer a powerful tool for understanding the spatial dynamics of the epidemic and guiding evidence-based interventions to mitigate its impact.
SAE provides improved precision for small geographic areas by combining information from sample surveys and auxiliary data sources and they have been widely used in public health, providing desirable estimates [2-4, 6, 8-13]. SAE techniques produce estimates with greater precision than traditional direct estimation methods by incor- porating additional data sources, which allows for the reduction of variance of estimates for small areas. SAE accommodates various models, which includes linear mixed models, Bayesian models, and synthetic estimators, depending on the characteristics of the data as well as the underlying population. Moreover, SAE methods can account for complex survey designs (stratification, clustering, and unequal selection probabilities), ensuring that estimates are appropriately weighted and unbiased. On the other hand, SAE approaches assume homogeneity within small areas, thus implying that the relationship between the target variable and auxiliary information remains consistent across the entire area. However, this assumption may not hold in practice.
Utilising simple binominal SAE, Kondlo and Manda [2] modelled HIV prevalence in South Africa using SABSSM 2005 data combined with Census 2001 data and 2006 community surveys. Results of the study showed a higher HIV prevalence amongst black neighbourhoods. The utilized approach assumed spatial independence in the dataset, disregarding the strength of covariates from neighbourhood samples, to obtain estimates for areas that may have inadequate samples. Exploiting a model that assume ample relationship between auxiliary datasets and the parameter of interest, Gutreuter et al. [5] estimated South Africa district level HIV prevalence using SABSSM 2012, district-level HIV prevalence estimates obtained from pregnant women HIV tests data, and 2012 demographic data. The study revealed the strength of antenatal care clinics' prevalence data in predicting HIV estimates. Mweemba et al. [14] predicted district-level HIV/AIDS prevalence in Zambia using the Fay–Herriot SAE approach. The provision of efficient estimates using Fay–Herriot SAE approaches can be attributed to its capacity of incorporating a linear synergy of direct and synthetic estimators that reduces estimation variance when using underrepresented samples [16-21]. Eaton et al. [13] applied Bayesian SAE to estimate HIV prevalence in Malawi. Sub-national household survey data on routine antenatal service delivery, HIV prevalence, antiretroviral treatment among pregnant women, and service delivery data on persons receiving antiretroviral treatment were used for analysis. Results from the study showed that HIV prevalence ranged between 3.2% and 17.1% across districts in Malawi.
To improve SAE estimates, more robust machine learning algorithms that offer hyperparameters tuning capabilities in modelling complex datasets efficiently have been used [12, 22]. For example, Mutai et al. [11] applied six machine learning algorithms (Elastic Net, k-Nearest Neighbours, RandomForest, Support Vector Machine (SVM), XGBoost and Light Gradient Boosting) to build models using population-based HIV Impact Assessment data from four countries in sub-Saharan region. XGBoost algorithm provided the best mean f1 score (91% average for both male and female), thus subsequently trained on the most predictive variables (age, relationship with family head, highest level of education, highest grade at school, work for payment, avoiding pregnancy, age at the first experience of sex, and wealth quintile). Betechuoh et al. [23] proposed an Inverse Neural method to estimate HIV prevalence using race, region, age of the mother, age of the father, education level of the mother, gravidity and parity as predictors, and achieved 88% accuracy. Chingombe et al. [15] predicted HIV status among men who sleep with men using Health and Child Care data and machine learning algorithms; Recurrent Neural Networks (RNN), Bagging Classifier (BC), Gradient Boosting Classifier (GBC), Naïve Bayes Classifier (NBC) and SVM. Results from the study exhibited better performance from RNN (0.98 accuracy) compared to other models. Although machine learning algorithms provide desirable accuracy, prediction of HIV prevalence is still a major research challenge, as demographic and associated predictors differ in every country. [1] presented key findings of SABSSM 2017 survey, and their study is short of granular estimates. In light of this and to the best of our knowledge, this study is the first to use the SABSSM 2017 dataset, and a Neural method, which has a strong non-linear mapping ability to produce localised HIV/AIDS estimates. Therefore, the aim of this study is to leverage a Neural Network method, for SAE of localised HIV/AIDS estimates (2017 SABSSM and 2011 census) in South Africa. Most importantly, Neural Network methods excel in capturing complex relationships and patterns within data. In the case of HIV/AIDS estimation, where the prevalence rates are influenced by a multitude of socio-demographic factors, traditional methods may struggle to adequately model these intricate relationships. Furthermore, Neural Network approach offers a superior capacity to capture non-linear interactions and dependencies among various predictors, resulting in more accurate estimates of HIV/AIDS prevalence at the local level. Output from this study is expected to showcase the strength of Neural method for SAE, enhancing the level of granularity in estimates without collecting additional data through costly field data exercises.
2. MATERIALS AND METHODS
2.1. Dataset
This study utilised the SABSSM V dataset of 2017 which is part of the nationwide HIV/AIDS prevalence surveys conducted every three to five years, using a complex multistage-stratified sample. Randomly selected households for the survey, were selected from 1, 457 small area layers designed by Statistics South Africa in 2011. The small area layers were stratified per province using urban informal, urban formal, rural formal, and rural informal settlements classes. In addition to that, a systematic random sample of 15 households was selected from each sampled small area layer [1]. It should be noted that people of all age groups were represented in the sample on selected households and the survey response was recorded at 82% with participants providing blood specimens for HIV/AIDS testing as well. The outcome variable in this study was HIV/AIDS positive status and the covariates were extracted from the South Africa Census 2011 data and it comprised of 24 variables (Table 1).
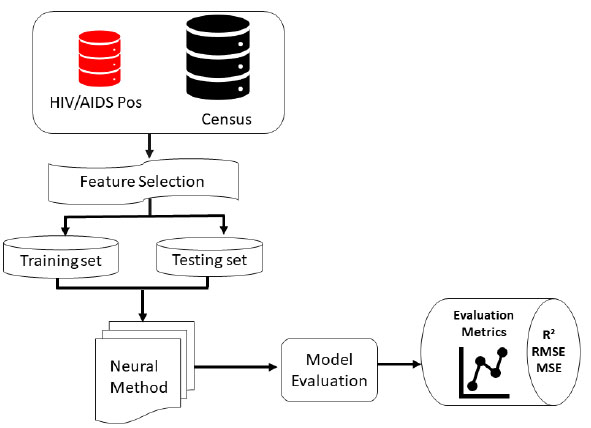
The proposed HIV/AIDS status predictive Neural method consists of input variables from the HIV dataset and Census data, feature selection, the machine learning model and finally, the performance evaluation as well as metrics of measurement (Fig. 1).
| Feature Name | Feature Description |
|---|---|
| HIV_Pos | HIV/AIDS Positive individuals |
| BLACK | Black population |
| COLOURED | Coloured population |
| INDIAN | Indian population |
| WHITE | White population |
| MALE | Male |
| FEMALE | Female |
| A0_4 | 0 - 4 age group |
| A5_9 | 5 - 9 age group |
| A10_14 | 10 - 14 age group |
| A15_19 | 15 - 19 age group |
| A20_24 | 20 - 24 age group |
| A25_29 | 25 - 29 age group |
| A30_34 | 30 - 34 age group |
| A35_39 | 35 - 39 age group |
| A40_44 | 40 - 44 age group |
| A45_49 | 45 - 49 age group |
| A50_54 | 50 - 54 age group |
| A55_59 | 55 - 59 age group |
| A60PLUS | Above 60 years age group |
| GEO_URBN | Urban area geography classification |
| GEO_TRIB | Tribal land geography classification |
| GEO_FARM | Farm land geography classification |
2.2. Small Area Estimation
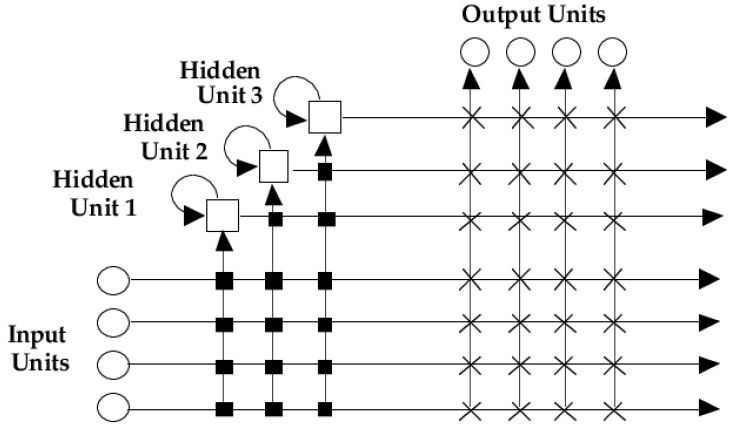
Small Area Estimation is a statistical approach utilised to obtain reliable and dependable estimates for specific small geographic areas when direct survey estimates are inadequate to provide reliable estimates [3, 6, 14, 19]. Primarily, SAE statistical approaches are designed to borrow strength from both the sample data and supplementary auxiliary data that will be available at a much higher level, (i.e., national level) to improve the estimates at the local scale [8]. The application of a machine learning approach in this study for small area estimation was motivated by [15] who reported better accuracy of Neural networks to small area estimation of HIV prediction in men who sleep with men in Zimbabwe. This study utilised NeuroShell® Predictor Software, that implements advanced “Neural network” and “Genetic algorithm” training approaches to solve prediction problems. The Neural method structure (Fig. 2) includes the input layer which consists of nodes representing the input features or variables. Each node corresponds to a single feature in the dataset. The number of nodes in the input layer is determined by the dimensionality of the input data. The hidden layers are intermediary layers between the input and output layers. Each hidden layer consists of nodes (neurons) that perform computations on the input data. The number of hidden layers and nodes per layer can vary based on the complexity of the problem and the desired model capacity. The output layer produces the final predictions or estimates generated by the neural network. Each node in a layer is connected to every node in the subsequent layer, forming a fully connected (dense) architecture [24-26]. During training, these weights are adjusted iteratively using optimization algorithms (e.g., gradient descent) to minimize prediction errors. The activation functions introduce non-linearities into the network, enabling it to learn and model complex relationships in the data as is in the SABSSM and census data.
The “Neural method” is based on an algorithm called Turboprop2, a variant of Cascade Correlation algorithm [27]. The Genetic method utilises genetic algorithms to optimize network architecture and weights. Genetic algorithms mimic natural selection, iteratively refining a population of solutions through a process of selection, crossover, and mutation [27]. By applying genetic algorithms to neural network training, NeuroShell® Predictor identifies optimal network architectures, connection weights, and learning parameters, leading to improved prediction accuracy. Notably, HIV/AIDS positive status statistics derived from SABSSM 2017 dataset and Census data for SAE was trained using both the “Neural method” and “Genetic method” and the data was split randomly on a number of different iterations (70% training ― 30% training; 50% testing ― 50% testing; 80% training ― 20% testing), until the best result and desirable output was achieved. Training the national dataset, using “Genetic method” took at least 1 hr 30 mins and resulted in R2 = 0.28, while the “Neural method” took only 1 min 7 sec achieving the best possible output (R2 = 0.30). Since there was no significant improvement from the “Genetic method” results based on R2 we discarded the Genetic method and continued further training for all provinces using the “Neural method”. Notably, TurboProp2 “Neural method” dynamically grows hidden neurons and trains very fast (Fig. 2). The approach has a dynamic architecture, which means that they start with only one input and one output node. The network's architecture grows as training progresses. The Neural method architecture (Fig. 2) used in this study, included an input layer, hidden neurons and an output layer. Every input in the model is connected to every output unit by a connection with an adjustable weight. Furthermore, the output units may produce a linear sum of their weighted inputs, and may also employ some non-linear activation function [27].
During training the Neural method learns by storing the training patterns as prototypes along with their associated target values. The network begins by finding linear relationships between the inputs and the output. Weight values are assigned to the links between the input and output neurons. Neurons are added to the hidden neurons so that nonlinear relationships can be found. Input values in the first layer are multiplied by the weights and passed to the second layer. The hidden layer passes values to the output layer in the same fashion, and the output layer produces the predictions. For this study, the number of hidden neurons was set as 80, and this was guided by the computed exploratory model, which indicated the optimum number of neurons. Data for some provinces, however, stopped training before 80 neurons. Most importantly, using the Neural method, neurons receive input signals, and perform mathematical computations on those inputs to produce an output signal. In most cases, a higher number of neurons allows the model to extract more complex relationships, achieving a better predictive model. With NeuroShell® Predictor Software, we noted that the number may be set as high as 150. However, going higher than 80, presented a risk of over-training or overfitting the model. Furthermore, during testing, Eastern Cape, Gauteng, KwaZulu-Natal, Limpopo, Mpumalanga and Western Cape used 80 neurons each suggesting complex data patterns. Contrary to that, Northern Cape and North West had 52 and 66 neurons, showing moderate complexity. Free State had the lowest number of neurons (48), which suggests a relatively simpler data pattern. Training time is also a very important metric in machine learning because it reflects the computational resources required to train a neural network model effectively. The lowest training time in seconds was for Gauteng, with 8 seconds. This suggests that the neural network trained in Gauteng required the least computational resources. The highest training time was for the Free State (112 seconds). This indicates that training the neural network in the Free State was the most computationally intensive and time-consuming. There was significant variability in training times across, for instance, Limpopo and Northern Cape had training times of 103 and 52 seconds, respectively, which are considerably longer than for example Gauteng and Western Cape (Table 2). To some extent, training times were also influenced by the N value, and provinces which had a higher N value required more training time.
| Provinces | EC | FS | GT | KZN | LIM | MP | NC | NW | WC | NT |
|---|---|---|---|---|---|---|---|---|---|---|
| Number of neurons | 80 | 48 | 80 | 80 | 78 | 80 | 52 | 66 | 80 | 80 |
| Training Times in seconds | 11 | 112 | 8 | 8 | 103 | 7 | 52 | 75 | 11 | 67 |
2.3. Statistical Analysis
The Neural method was assessed using the Coefficient of determination (R2), Mean Squared Error (MSE) and Root Mean Squared Error (RMSE). The R2 measure was specifically used to assess the goodness-of-fit of the model. It measures the proportion of the variance in the dependent variable that can be explained by the independent variables in the model. In addition to R2, the MSE, which measures the average squared difference between the predicted values from the model and the actual observed values of the dependent variable, was also utilised. Mean Squared Error shows how well the model's predictions align with the actual observed values with zero indicating a perfect fit of the model [28]. Root Mean Squared Error was also used to evaluate the performance of a regression model. A lower RMSE indicates that the model's predictions are, on average, closer to the actual observed values [29]. Therefore, a smaller RMSE value generally suggests a better-fitting model with more accurate predictions.
3. RESULTS
3.1. Correlation of HIV/AIDS Prevalence and Predictor Variables
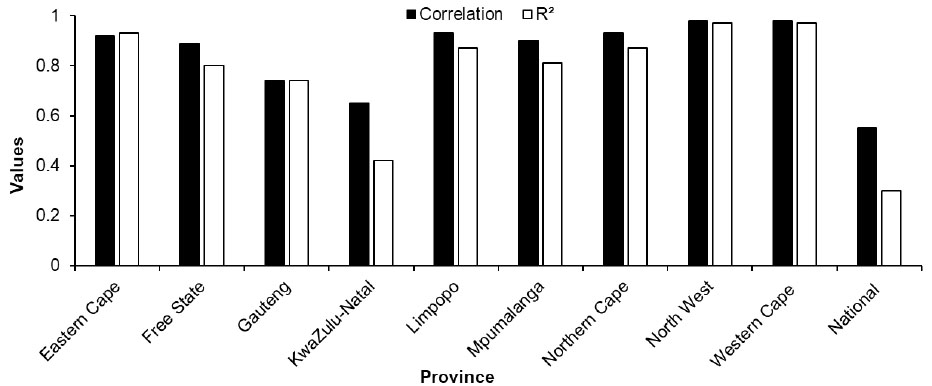
The national scale dataset yielded a less desirable coefficient of determination at R2 = 0.30, suggesting weak performance in explaining HIV/AIDS prevalence in comparison to the provincial scale analysis. The provincial level coefficient of determination (R2) showed that Limpopo, Northern Cape, North West and Western Cape recorded high R2 values ranging above 0.87, averaging at 0.94, indicating a strong relationship between HIV/AIDS positive status and the explanatory variables (demographics: i.e., age, gender, race as well as geographic location type (urban and rural) (Fig. 3). Amongst these provinces, North West and Western Cape achieved the highest R2 values of 0.97. This suggests that the model successfully captured the underlying patterns and factors influencing HIV/AIDS prevalence in these provinces. Eastern Cape, Mpumalanga, and Free State had moderately high R2 values ranging from 0.80 to 0.86. These results show that the model provides reasonably good estimations of HIV/AIDS prevalence, but there may be some unexplained variation that the model is unable to capture in the provinces. Gauteng and KwaZulu-Natal had lower R2 values, suggesting a weaker relationship, with R2 values of 0.56 and 0.42, respectively. This indicates that the model does not fit the data well in these provinces, and there may be various factors leading to a less accurate estimation of HIV/AIDS prevalence.
| Provinces | EC | FS | GT | KZN | LIM | MP | NC | NW | WC | NT |
|---|---|---|---|---|---|---|---|---|---|---|
| RMSE | 1.17 | 1.04 | 2.13 | 4.65 | 1.20 | 2.19 | 0.93 | 0.49 | 0.98 | 3.81 |
| MSE | 1.38 | 1.09 | 4.56 | 21.71 | 1.45 | 4.83 | 1.65 | 0.24 | 0.27 | 14.58 |
| Number of Neurons | 80 | 48 | 80 | 80 | 78 | 80 | 52 | 66 | 80 | 88 |
| % in same range | 83.10 | 58.10 | 68.60 | 88.40 | 70.20 | 85.70 | 79.50 | 69.60 | 77.20 | 78 |
Furthermore, correlation coefficients for most provinces were generally high, ranging from 0.65 to 0.98 (Fig. 3). This indicates a strong positive relationship between the provinces and the estimated HIV/AIDS prevalence. The higher the correlation coefficient, the closer the estimated HIV/AIDS prevalence in a province aligns with the overall pattern of HIV/AIDS prevalence. Notably, Limpopo, Northern Cape, and Western Cape provinces recorded high correlation values (> 0.93). On the contrary, Gauteng and KwaZulu-Natal had slightly lower correlation coefficients of 0.74 and 0.65, respectively. These results imply that the estimated HIV/AIDS prevalence may deviate slightly from the overall pattern observed in those provinces. It is imperative to note that correlation coefficients below 1 do not necessarily imply inaccuracies in the model, but rather might be indicative of some variation in the estimated HIV/AIDS prevalence compared to the overall pattern in the provinces across South Africa.
Table 3 shows the RMSE values for the estimation of HIV/AIDS prevalence across South Africa in different provinces using the Neural method. Eastern Cape and Limpopo recorded RMSE = 1.17 and 1.20, suggesting that the model's predictions for HIV/AIDS prevalence have an average difference of 1.17 and 1.20 percentage points respectively, from the actual prevalence values. Free State recorded an RMSE of 1.04, indicating better performance of the model in estimating the prevalence of HIV/AIDS in the province. Gauteng, recorded a RMSE value of 2.13 and Mpumalanga a RMSE = 2.19, implying that the SAE model's predictions for HIV/AIDS prevalence have an average difference of 2.13 and 2.19 percentage points accordingly. The output suggests that the model's performance is not as accurate in estimating prevalence in Gauteng and Mpumalanga compared to other provinces. KwaZulu-Natal recorded a significantly high RMSE score of 4.65 showing that the model predictions for HIV/AIDS prevalence have a higher level of inaccuracy compared to other provinces. Low RMSE values of less than 1, were recorded in the Northern Cape (RMSE = 0.93), North West (RMSE = 0.49) and Western Cape (RMSE = 0.98) showing that the model was highly capable of predicting HIV/AIDS prevalence in the three provinces, compared to the other provinces (Table 3).
The model achieved a relatively low MSE of 1.38 for the Eastern Cape and 83.10% of the estimated values fell within the same range as the observed values (Table 3). This suggests that the model performed reasonably well in predicting HIV/AIDS prevalence. The MSE value decreased to 1.09, for Free State indicating a better fit of the model to the observed data compared to the Eastern Cape. However, only 58.10% of the estimates fell within the same range as the observed values, suggesting that the model's accuracy was relatively lower in this province. A relatively higher MSE of 4.56 for Gauteng, represents a larger discrepancy between the predicted and observed values. Furthermore, it was noted that the percentage of estimates falling within the same range as the observed values was 68.60%, suggesting moderate accuracy of the model. KwaZulu-Natal showed a significantly higher MSE = 21.71, suggesting a poorer fit of the model to the observed data. However, the percentage of estimates within the same range was relatively high at 88.40%, despite the higher MSE. Western Cape recorded a low MSE of 0.27, showing better performance of the model and 77.20% of the estimated values were in the same range. Overall, the model's performance varied, with provinces such as Eastern Cape, Northern Cape, North West, and Western Cape achieving low MSE values and higher percentages of estimates falling within the same range as the observed values. Free State, Gauteng, KwaZulu-Natal, Limpopo, and Mpumalanga had higher MSE values and varied percentages of accurate estimates.
3.2. Variable Importance
Variable importance was utilised to analyse the predicting power of covariates in the estimation of HIV/AIDS prevalence across provinces in South Africa, providing a synoptic view of factors that have either a stronger or weak predicting power for HIV/AIDS prevalence. Table 4 shows that covariates related to race or ethnicity, gender, age groups, and geographic factors were consistent across the country. For example, the most important variables in the Eastern Cape were race and urban geography types. Similarly, in Free State, race and gender, appear to be important as well as the 60 plus age group. In Gauteng, variables including gender, age groups, and urban/farm classes were most significant in the model. In KwaZulu-Natal, gender, tribal association, urban classification, as well as the 20 – 24 age group seem to be important variables. Geographic location classifications (urban, tribal and farm) performed considerably well in explaining HIV/AIDS in Limpopo. The age category between 25 – 29 years was equally important, recording the second-best predicting variable. In Mpumalanga, black (race) was the most dominant variable followed by geographic classification of urban, tribal and farm accordingly. Furthermore, the white race appears to be significant, followed by gender (male) as influential variables. The top three variables for Northern Cape were geographic types (urban, farm and tribal). Male, the 20 – 24 age group, as well as black (race), also contributed significantly to the model in estimating HIV/AIDS prevalence in the province. North West and Western Cape recorded race and gender as the most dominant variables. At national level, urban areas, farms, tribal communities, Indian ethnicity, and gender (specifically females) have notable influences on explaining HIV prevalence. Urban geographic area has the highest contribution, while white had the lowest importance, suggesting that the white population, (ethnicity), has the least influence on explaining HIV prevalence at national scale (Table 4).
| Provinces | 1 | 2 | 3 | 4 | 5 | 6 |
|---|---|---|---|---|---|---|
| Eastern Cape | Black | Coloured | White | Male | Indian | Urban |
| Free State | Coloured | Black | Female | White | Male | 60 plus Age group |
| Gauteng | Male | Female | 5-9 Age group | 30-34 Age group | Urban | Farm |
| KwaZulu-Natal | Female | Male | Tribal | 20-24 Age group | Urban | Indian |
| Limpopo | Urban | 25-29 Age group | Tribal | Farm | Male | Black |
| Mpumalanga | Black | Urban | Tribal | Farm | White | Male |
| Northern Cape | Urban | Farm | Tribal | Male | 20-24 Age group | Black |
| North West | Black | Male | White | Female | Coloured | Farm |
| Western Cape | Black | White | Male | Female | Coloured | 60 plus Age group |
| National | Urban | Farm | Tribal | Indian | Female | White |
3.3. Spatial Profile of Predicted HIV/AIDS Prevalence
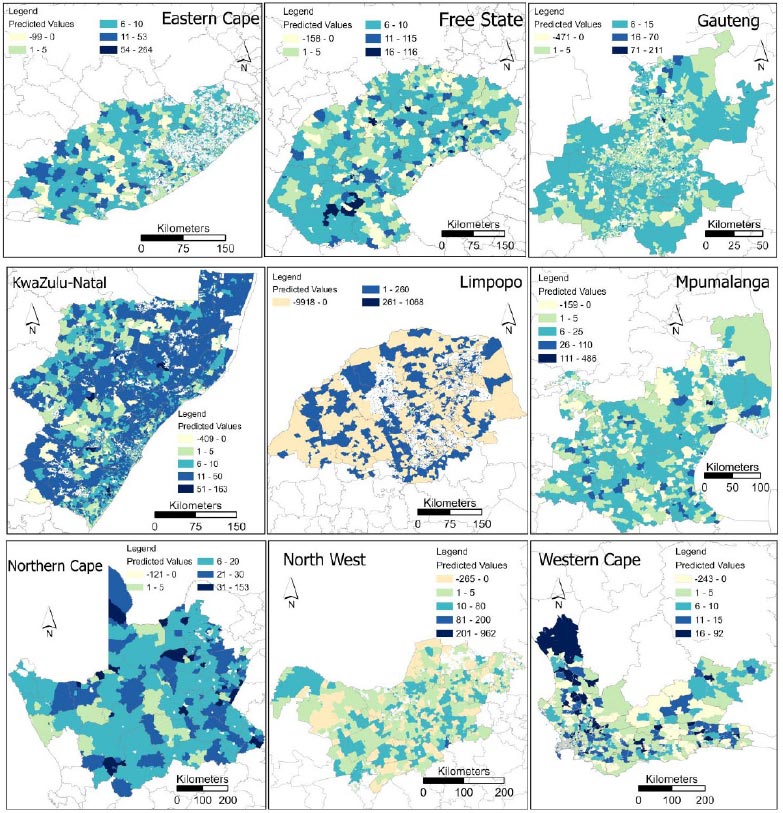
Predicted HIV/AIDS prevalences using the Neural method for small area estimation technique across different provinces in South Africa showed heterogeneous spatial representation (Fig. 4). It should be noted that the mapping of predicted values was implemented in ArcGIS Pro 3.0.2 (ESRI, Redlands, CA, USA) using the natural breaks (Jenks) method with manual modification for easy interpretation of class categories. Furthermore, spatial profiling of different provinces also exhibits the model limitations in accurately capturing the complex patterns in the data producing unreliable predictions in the form of negative values. Eastern Cape recorded diverse distribution of predicted HIV/AIDS estimates across the province. The majority of estimations ranged between 1 – 5, and 6 – 10, with high values most prevalent in the southwestern part. Free State also showcased a heterogenous pattern, and most estimates ranged between 6 – 10 followed by 1 to 5 range of predicted values. In comparison to Eastern Cape, the Free State, Northern Cape, and KwaZulu-Natal recorded the highest values of 116, 153 and 163 respectively. Furthermore, most estimates for Northern Cape ranged between 6 – 12. In KwaZulu-Natal most of the estimates fell between the 11 – 50 range, almost covering the whole province. Equally important, Gauteng presented most estimates between 6 and 15, almost covering the whole province, with the 1 – 5 range distributed in the middle of the province. The spatial distribution of predicted values for Mpumalanga depicted a high prevalence of estimates in the range between 6 to 25, mostly distributed in the middle of the province. Western Cape also exhibited a heterogenous pattern with most predicted values ranging between 1 to 5 and 6 to 10. High values ranging between 16 – 92 were distributed in the northeastern part of the province. In contrast to other provinces, North West showed a high distribution of estimated negative values. Most of the estimated values ranged between 10 and 80. In addition, estimates for Limpopo illustrated the limitation of the model, with a high frequency of negative values across the province, and the highest estimated value ranged between 261 and 1068.
4. DISCUSSION
This study utilised auxiliary data from the Census 2011 and SABSSM 2017 at the small area level and the Neural method SAE model, which has a strong non-linear mapping ability and learning speed to produce localised HIV/AIDS estimates. The findings from the study highlight the feasibility of the model to obtain reliable HIV/AIDS prevalence estimates in South Africa at small area level across nine provinces with an average correlation of 0.88 and R2 = 0.82 (Fig. 1). These metrics are representative of a strong positive relationship between the predicted HIV/AIDS prevalence estimates generated by the SAE model in different provinces and the actual prevalence data (2017 SABSSM). The results also adds in filling gaps of the missing data points at a granular geographic level. Accurate HIV/AIDS prevalence estimates at the local scale are essential for public health planning, resource allocation as well as the structuring and development of effective location-based HIV/AIDS interventions [2, 14, 30, 31].
Fig. (3) showed a higher R2 = 0.97 for both North West and Western Cape compared to other provinces. This could be attributed to more consistent and predictable patterns in the two provinces which enabled the model to accurately capture the relationship between different predictors and prevalence rates specific to these provinces. Moreover, the variation in HIV/AIDS prevalence across different provinces affects the performance of the model. Thus, the low performance recorded in KwaZulu-Natal (R2 = 0.42) could be due to higher variability in HIV/ADS prevalence within its small area layers, limiting the efficacy of the model to capture the complexities of the data. While the model performs well at the provincial level with an average R2 = 0.8 (Fig. 1), its performance decreased significantly when the data is analysed at national scale, yielding R2 of 0.30. This poor performance at a national level could be due to the reduced correlation between variables. The distinct characteristics of each province clearly has a stronger influence in predicting HIV/AIDS prevalence more accurately. Equally important, the selected auxiliary predictor variables might have different effects at different levels i.e., provincial and national scales [32, 33]. It is possible that the predictor variables have a stronger influence on the provincial-level estimates, but their effects become less significant or inconsistent when applied to the national scale. Overall, different patterns could also be due to diverse population demographics, socio-economic factors, as well as access to healthcare services.
Provincial level analysis exhibited better RMSE scores in comparison to national level analysis, which could be attributed to the presence of strong spatial autocorrelation in HIV/AIDS prevalence at the provincial level. Spatial autocorrelation signifies the occurrences of areas that are close together and have similar values [34]. On the contrary, when the analysis was performed at national scale, the spatial autocorrelation patterns seemingly depreciated, resulting in a weaker relationship between the predictor variables and the HIV/AIDS prevalence. The efficacy and reliability of the Neural method is illustrated in the fact that over 70% of the estimates were in the same range for most provinces, except for Free State, Gauteng and North West. Some of the low values could be caused by the presence of outliers in the data. Thus, if the estimated values are clustered within a particular range, the observed values could include extreme values outside that range. The reduced efficacy of the model in the Limpopo province could be attributed to the presence of outliers in the samples. When one increases the number of neurons in the network, one essentially increases the complexity and representational capacity of the model. This increased complexity allows the network to capture more intricate and fine-grained relationships within the data. However, introducing too many neurons can over-train or over-fit the model.
The relative importance of auxiliary data/predictor variables may vary depending on the specific training data as well as the model's learned patterns. Eastern Cape results showed the strength of different racial groups in predicting HIV/AIDS estimates. Most importantly, as reported [35-37], ethnicity can play a significant and important role in HIV/AIDS prevalence due to cultural values. Cultural and traditional practices in tribal communities can affect HIV/AIDS prevalence. In all provinces, race was significant in predicting HIV/ADS prevalence. Previous studies have also found race as one of the significant factors for predicting HIV/AIDS [2, 22]. It is worth highlighting that for the two provinces (Gauteng and KwaZulu-Natal) with lower correlation coefficients and R2, as well as high RMSE, race was not a key predictor of HIV/AIDS. In South Africa, race has been associated with unequal access to healthcare services, including HIV/AIDS prevention and testing [36, 38]. Systemic factors in different provinces have led to racial disparities in healthcare infrastructure, resources, and quality of care. These disparities contribute to variations in HIV/AIDS prevalence across different racial groups. Understanding the impact of race or ethnicity is important for HIV/AIDS estimation. Gender was also noted to be among the predictors of HIV/AIDS in all provinces, with it being stronger in Gauteng and KwaZulu-Natal. Gender is an important variable as HIV/AIDS prevalence often differs between males and females due to differences in behavior patterns.
Location type or geo type, being urban, rural, tribal or farm, also played a significant role in predicting in eight of the nine provinces. Betechuoh et al. [23] also found that region or location was one of the factors important for predicting HIV/AIDS. The model presented here indicated the importance of urban geotypes as important, especially in the Northern Cape and Mpumalanga. In the first instance, the population is largely found in urban areas due to the vast expanse of the province. On the contrary, tribal geo type was the third important predictors in provinces like KwaZulu-Natal, Limpopo, Mpumalanga and Northern Cape.
The study also found that age was a key variable in predicting HIV/AIDS in South Africa. This is supported by findings from Mutai et al. [11] and to some extent, by Betechuoh et al. [22] who reported that age of mother and age of father were among the predictors of HIV/AIDS in South Africa. Different age groups can have varying levels of HIV/AIDS prevalence due to differences in sexual activity, exposure to risk factors, and access to prevention methods such as the use of condoms [39]. The strength of age group was heterogeneous across all provinces, with the 20 years to 30 years age group showing greater influence. Furthermore, geographic location and living conditions can impact HIV/AIDS prevalence rates. While the spatial representation of HIV/AIDS prevalence (Fig. 3) showed the heterogenous distribution of predicted HIV/AIDS prevalence in all provinces, the output provides a universal spatial location of where targeted provision of HIV testing services as well as awareness creation should be.
Fig. (4) shows the observed diverse distribution of predicted HIV/AIDS estimates across South Africa provinces, reflecting complex spatial dynamics of the epidemic at a small area level. Provinces with high population density and urbanisation, such as Gauteng and KwaZulu-Natal, tend to exhibit higher HIV/AIDS prevalence due to increased mobility, higher rates of risky behaviour. Healthcare policies in these provinces should prioritize interventions tailored to urban populations, including targeted HIV/AIDS education and prevention programs. Provinces with lower socio-economic status, such as Eastern Cape and Limpopo, may experience higher HIV/AIDS prevalence rates due to limited access to healthcare, poverty, and unemployment. Healthcare policies should focus on addressing socio-economic disparities, improving access to healthcare, and implementing socio-economic empowerment programs. Regions with high rates of migration and mobility, such as the Western Cape and Mpumalanga, may experience fluctuations in HIV/AIDS prevalence due to population movement. Responsible authorities should consider the transient nature of populations and prioritise mobile health services, and outreach programs, as well as interventions targeting migrant communities to ensure continuity of care and prevention efforts. Variations in healthcare infrastructure, resources, and capacity across South African provinces may influence HIV/AIDS prevalence rates and the effectiveness of prevention and treatment programs [40]. Provinces with limited healthcare resources, such as Northern Cape and North West, may face challenges in providing comprehensive HIV/AIDS services. Thus, healthcare policies should prioritise resource allocation, capacity building, and strengthening of healthcare systems. Provinces with a longer history of HIV/AIDS and established epidemics, such as KwaZulu-Natal, may have higher prevalence rates compared to provinces with more recent epidemics or lower historical burden. Policies should take into account the historical context of HIV/AIDS and tailor make interventions based on the stage of the epidemic, including scaling up testing, treatment, and prevention strategies. Understanding the epidemiological context and learning from past interventions can inform the design and implementation of targeted public health strategies [1].
This study is not without limitations, it should be noted that the data used were collected in 2017 (SABSSM) and 2011 (Census). Hence, our estimates are likely outdated, considering how HIV/AIDS epidemic variables change over time, especially after COVID-19. Furthermore, the model's performance ought to be validated and compared against other established methods for HIV/AIDS SAE prevalence estimation to assess its relative reliability. The Neural Nets method was built with variables collected from the Census data and might not offer enough variability. It is possible that other HIV/AIDS related covariates (i.e., sexual behaviour patterns, education level, years out of school, gender of household head, household size) could have improved the model accuracy. However, there was limited overlap between the variables available from SABSSM and the Census. Another potential limitation of our model is the bias in representation within the training data, which may impact its predictive ability for specific demographic groups such as gender and age. If certain demographic groups are underrepresented or overrepresented in the training data, the model may not adequately capture the diversity of experiences and risk factors within these populations, leading to biased predictions. Addressing this limitation requires careful consideration of sample selection methods and efforts to ensure diversity and representativeness in the training dataset. While our model offers valuable insights into HIV/AIDS prevalence at the population level, it is essential to acknowledge and address its potential limitations, particularly biases in predictive ability for specific populations such as gender and age groups.
CONCLUSION
Neural Network method for SAE showed its capacity to handle complex relationships between HIV/AIDS prevalence and various socio-demographic variables available in the census dataset. The Neural Network SAE model obtained reliable HIV/AIDS prevalence estimates with an average correlation of 0.88 and R2 = 0.82. While some provinces exhibited concentrated clusters of low to moderate prevalence estimates, others displayed pockets of high prevalence values. Provinces like Northern Cape, KwaZulu-Natal, and Gauteng stand out with notably higher predicted prevalence values, reflecting the complex interplay of demographic, socio-economic, and epidemio- logical factors within these areas. Furthermore, our analysis revealed a strong positive relationship between estimated HIV prevalence as indicated by high correlation coefficients ranging from 0.65 to 0.98. However, slight variations exist, with Limpopo, Northern Cape, and Western Cape demonstrating particularly high correlation values, while Gauteng and KwaZulu-Natal exhibit slightly lower coefficients. Additional evaluation through RMSE values further highlights varying performance across Eastern Cape, Free State, displaying relatively low discrepancies between predicted and actual prevalence. Gauteng, Mpumalanga, and notably, KwaZulu-Natal, show higher levels of inaccuracy in prediction. These findings underscore the importance of recognizing regional disparities and refining modeling approaches to enhance accuracy, particularly in provinces where deviations are more pronounced.
The study also revealed consistent patterns across South Africa with race, gender, age groups, and geographic classifications playing significant roles in predicting HIV/AIDS prevalence. Urban areas consistently demonstrate high importance, while certain demographic variables like gender and age groups vary in their influence, emphasising the need for carefully planned, region-specific interventions tailored to these varying dynamics.
By providing localised estimates of HIV/AIDS prevalence, our approach enables policymakers and healthcare practitioners to identify high-risk areas, target interventions effectively, and allocate resources where they are most needed to combat the HIV/AIDS epidemic across South Africa. Furthermore, localised precise estimates can reduce the cost and effort associated with collecting and analysing data. This is especially important in resource-constrained developing nations. The presence of negative estimated values in North West and Limpopo underscores the limitations of the model in accurately capturing the HIV/AIDS epidemic dynamics, highlighting the need for further refinement and validation. This study underscores the importance of utilising advanced machine learning techniques to overcome the limitations of traditional SAE methods, especially in situations where the sample size is limited at the local level.
It is recommended that future studies should expand on the number of predictor variables. Ideally, household surveys should collect demographic data like years out of school, gender of household head and household size to contribute to greater accuracy in predictions since they influence human behaviour. This research also underlines the fact that geographical variation cannot be ignored in the HIV/AIDS landscape. Provinces illustrated unique tendencies in the predictor variables and accuracies. Furthermore, the results of the national model did not yield satisfactory results, which is to some extent influenced by the uneven distribution of sample areas across the provinces.
LIST OF ABBREVIATIONS
| RNN | = Recurrent Neural Networks |
| BC | = Bagging Classifier |
| SVM | = Support Vector Machine |
| GBC | = Gradient Boosting Classifier |
| HIV/AIDS | = Human Immunodeficiency Virus/Acquired Immunodeficiency Syndrome |
| SBSSM | = South African National HIV Prevalence, Incidence, Behaviour and Communication Survey |
| SAE | = Small Area Estimation |
ETHICS APPROVAL AND CONSENT TO PARTICIPATE
The study was approved by the Institutional Review Board of Human Science Research Council with protocol approval numberREC:4/18/11/15). Approval was also granted by the Associate Director for Science, Center for Global Health (CGH), Centers for Disease Control and Prevention (CDC).
AVAILABILITY OF DATA AND MATERIALS
Data used in this analysis are available from HSRC’s public data repository (data set). SABSSM 2017 Combined. Version 1.0. Pretoria South Africa: Human Sciences Research Council (producer) 2017, Human Sciences Research Council (distributor) 2020. https://doi.org/10.14749/1585345902 (accessed on 10 September 2022). Archive number: SABSSM 2017 Combined,doi:10.14749/1585345902.

