All published articles of this journal are available on ScienceDirect.

The Overweight Prediction Model in the Risk Factor-based Adolescents using a Web-based Online Application
Abstract
Background
The overweight prevalence rate in Indonesian adolescents has kept increasing. Basic Health Research in Indonesia recorded the overweight prevalence and obese nutritional status (BMI/Age) in adolescents at 18.1%. The overweight nutritional status (BMI/Age) in 2010-2013 among adolescents at the age of 16-18 was 1.4% in 2010 and increased to 7.3% in 2013.
Objective
This study aims to establish a prediction model for overweight adolescents based on their risk factors to prevent an early overweight.
Methods
The samples were 300 students from 5 high schools in Padang City, Indonesia. This study applied mixed methods and used a logistic regression test to comprehend the determinant variables in establishing the prediction model and conducting the application tests.
Results
The research shows the result that these adolescents had the risk factors, namely excessive consumption of carbohydrates and fats, the amount of vegetable consumption was <3 portions/day, physical activity time was <15 minutes/day, and a low level of health knowledge. It was predicted that the odds of being overweight were 82.31%, with accuracy at 95.0%, sensitivity at 93.33%, and specificity at 95.71%. The result showed application design validation by experts at 0.96 and validation of application construction and content by experts at 0.84. The teachers’ response practicality was 92.22%, adolescents’ response practicality was 85.45%, and adolescents’ response effectiveness was 85.05.
Conclusion
The most dominant risk factors are fat consumption, carbohydrate consumption, amount of vegetable consumption, duration of physical activities, and level of health knowledge that can be considered to prevent overweight in adolescents.
1. INTRODUCTION
Overweight is one of the nutritional problems whose prevalence continues to increase worldwide [1]. WHO data in 2016 showed that the prevalence of overweight in adolescents at the age of 10-19 worldwide was 32.5%. Meanwhile, the overweight prevalence of adolescents in Southeast Asian countries in 2015 was 13.35% and increased to 14.0% in 2016. Furthermore, the overweight prevalence in Indonesian adolescents was above that of other Southeast Asian countries [2].
One-fifth of the world's population were adolescents at the age 10-19, while around 900 million of them lived in developing countries. In Indonesia, the adolescent population was approximately 63 million or 27.0% of total population [3]. Basic health research showed the data that overweight and obesity in the age group ≥ 15 years was 18.8% in 2007, and this number increased to 26.6% in 2013 and 31.0% in 2018 [4].
The overweight rate in the adolescent age group was described in detail in the 2013 data from the Basic Health Research. It was recorded that the overweight prevalence and obese nutritional status (based on BMI/Age) of adolescents was 18.1%. Adolescents at the age of 13-15 were overweight at 8.3% and obesity was at 2.5%, while those at the age of 16-18 were overweight at 5.7% and obesity at 1.6%. In 2010-2013, the trend of overweight nutritional status (based on BMI/Age) in adolescents at the age of 16-18 was 1.4% in 2010, followed by an increase to 7.3% in 2013 [5]. The overweight prevalence in West Sumatra Province was above the national average [4].
Being overweight in adolescents can lead to the occurrence of various diseases and even death. These diseases include metabolic disorders, cardiovascular diseases, cancer, mechanical disorders, social anxiety disorders, and so forth. Metabolic diseases include insulin resistance, impaired glucose tolerance, type 2 diabetes, dyslipidaemia, gallstones, polycystic ovary syndrome/ infertility in women, and gout. Cardiovascular diseases include hypertension, coronary heart disease, varicose veins, and peripheral edema [6].
Many factors contributing to being overweight include excessive calorie consumption, heredity/genetics factors, family income, breakfast-skipping habits, fast food, and snack-eating habits, soft drink consumption, the lack of physical activities, playing games, and watching television, which leads to the lack of physical activities, the lack of vegetable and fruit consumption, the lack of knowledge about nutrition, the lack of attitude in a healthy living behaviour, the lack of sleep, and so forth.
Adolescents need to maintain their nutritional status after identifying the risk factors, as the most dominant effect on being overweight. Furthermore, a prediction model of the overweight using a logistic regression equation needs to be established.
The study aims to determine the most dominant risk factors of the overweight and to establish a prediction model for overweight adolescents based on their risk factors.
2. MATERIALS AND METHODS
2.1. Study Design and Duration
The study implemented a mixed methodology (qualitative and quantitative research) and was conducted from May to November 2022.
2.2. Population and Sample
The population in this study covered 43,871 high school students in Padang City, while the samples participating in this study were all students from grades X to XII in the selected high schools of Padang City with an age range of 16-18, using the inclusion criteria of overweight adolescents (≤+2SD) based on their Body Mass Index (BMI) and willingness to be the respondents (an informed consent). The exclusion Criteria were the students who were absent during the study period up to 3 times and those with obese BMI (BMI> + 2 SD).
2.3. Sample Size Consideration
The sample size in this study was calculated using the known proportion testing formula [7]:
 |
 |
n = 138.29
Description:
n = number of the samples required
 = the standard deviation of alpha at a 95% confidence level was 1.96.
P = the proportion in the researcher judgment group was 0.1 Q = 1-p
d2 = research precision (0.05)
Furthermore, using the Lemeshow formula, the minimum sample size obtained was 138 respondents. Larger samples taken in the study meant a closer normal distribution. Thus, the number of samples taken was planned to be 300 people from 5 selected schools.
2.4. The Sampling Technique
The sampling technique was implemented by a multi-stage random sampling. First, the working area covered by the Community Health Centre, with the lowest to the highest overweight rate among high school students, was determined based on the data from the Padang City Health Office. Furthermore, from certain working areas under the selected Community Health Centres, 5 (five) high schools were randomly selected, including 3 (three) schools from the working area of the Community Health Centre with the highest overweight rate and 2 (two) other schools from another area with a low overweight rate. From these 5 (five) selected schools, 60 students from classes X-XII were randomly selected.
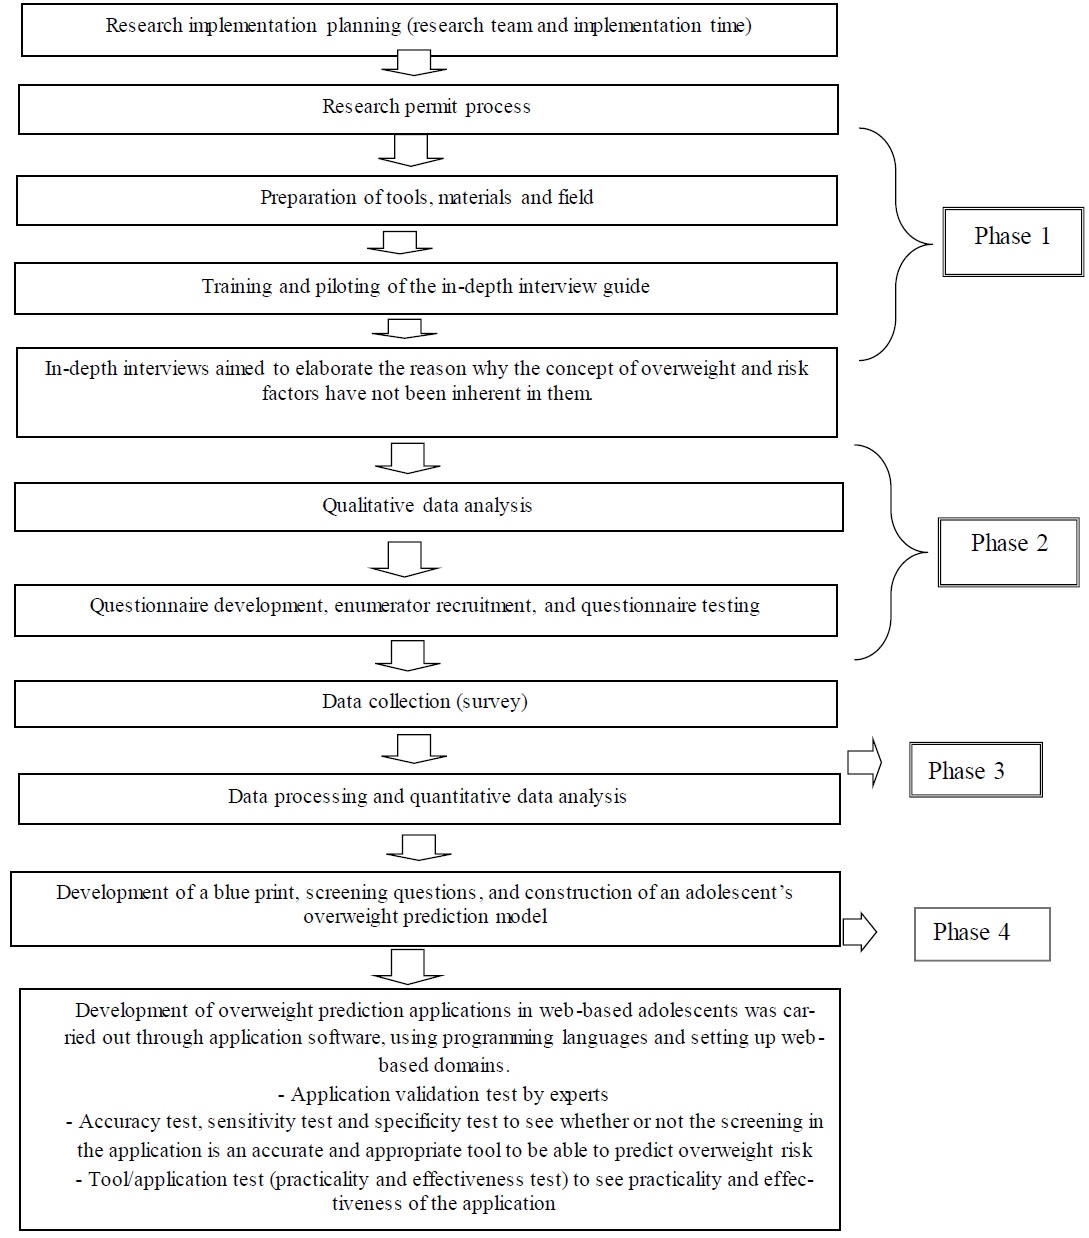
Research flow.
2.5. Research Phase
2.5.1. Phase 1 and 2 Qualitative and Quantitative Research
Qualitative research was conducted with in-depth interviews involving 19 informants, including 3 overweight adolescents, 3 adolescents with normal nutritional status, 6 parents, 2 teachers, and 2 health workers from Community Health Centre. The research was followed with an in-depth exploration of the concept, meaning, significance, and value of overweight, and the application design as needed. The results of qualitative research became the basis of variable preparation in the quantitative phase. In this quantitative research, anthropometric measurements were carried out on the students’ height and weight, according to a standard for calculating age-based BMI. The intake data used a semi-quantitative food frequency (SQ FFQ) form [8]. Data on other variables were utilized in the questionnaires. The independent variables were age, gender, parent’s education level, parent’s occupation, socioeconomic status, level of nutrition knowledge, attitude, energy intake, carbohydrate consumption, protein consumption, fat consumption, breakfast habit, snacking habit, vegetable/fruit consumption habit, fast food-eating habits, soft drink consumption habit, healthy eating index, physical activities, duration of physical activities, habits of playing games and watching TV or duration of the screen time, and the duration of sleep. The dependent variable was the nutritional status with the categorization of overweight (+1 SD to +2 SD) and normal (-2 to <+1SD) according to the standard of the World Health Organization.
The statistical analysis was obtained using the SPSS program, consisting of univariate, bivariate (chi-square test), and multivariate (logistic regression) with CI 95% and a p-value of 0.05 considered as a cut-off for statistical significance.
2.5.2. Phase 3 Drafting Application Blueprints and Screening Questions
In this phase, the blueprint of the web-based application model for adolescents’ overweight prediction, multivariate analysis-based screening question design, system analysis design, and application design were made.
2.5.3. Phase 3 Application Development
This stage established a web-based overweight prediction application through the software development, using a programming language and setting up a web-based domain that can be accessed via the internet. Application design validation tests were conducted by 2 experts, while construction and content validation tests were conducted by 2 experts. Teacher response practicality tests were applied to 2 teachers in charge of school health effort programs, while practicality and effectiveness tests were carried out on 40 adolescent students (Fig. 1).
3. RESULTS
3.1. Research Phase
3.1.1. Phase 1 Qualitative and Quantitative Research
The results of the in-depth interviews involving 19 respondents, namely 3 overweight adolescents, 3 adoles- cents with normal nutritional status, 6 parents, 2 teachers, and 2 health workers from the health centre, showed that:
3.1.1.1. Thema 1: The Meaning of Overweight
Three overweight adolescents stated that being overweight is not a serious problem and is something they consider normal. On the contrary, 3 adolescents with normal nutritional status stated that being overweight can lead to various diseases. Opinions stated by 6 adolescents conveyed that being overweight was an issue. Their statements are as follows:
“…If you are slightly fat, it is normal, the important thing is to be confident. I once found out about this obesity from the internet…” (Adolescent 01)
“...Fat is normal, only your physical appearance gets less attractive, sometimes you feel less confident, so it is also necessary to lose weight. I have read about this obesity on Google...” (Adolescent 02)
“...Fat is not too much of a problem even though it will lead to many diseases in the future, such as diabetes. Fat is caused by difficulty in exercising; I occasionally jog my legs like riding a calf...” (Adolescent 03)
“...Overweight is a serious thing, being fat is dangerous because it causes diabetes. Being overweight is the same as gaining weight. I have heard about this at school, and someone has also said it. It occurs when you eat too much. Body weight affects health. If you are fat, you can get diabetes...” (Adolescent 04)
“...If you are too fat, there will be disease. Overweight is a result of excessive and irregular eating patterns, maybe eating too much...” (Adolescent 05)
“...Overweight is detrimental to health; it affects muscles, high cholesterol, and causes diabetes. “Overweight in teenagers is caused by a lot of fat in the body, irregular eating patterns which can cause weight gain, the lack of exercise...” (Adolescent 06)
Parents confirmed the same idea that being overweight is not good. Their statements are as follows:
“...Overweight is not good because it is the root of disease, it can cause diabetes and heart disease. Obesity will interfere with activities for adolescents...” (Parent 01)
“...I think being overweight is not good because it can cause disease...” (Parent 02)
“...Overweight is not good, you can get diabetes and heart disease...” (Parent 03)
“...Excess weight can cause diseases, such as diabetes and heart disease. Teenagers should not be fat; the important thing is to be healthy...” (Parent 04)
“...Overweight is unhealthy, it can increase cholesterol and various diseases...” (Parent 05)
“...Overweight is not good, it can cause many diseases, the body feels difficult to move...” (Parent 06)
3.1.1.2. Thema 2: Causes of Overweight in Adolescents
Three overweight adolescents stated the causes of overweight. Their statements are as follows:
“...The causes of being overweight are the lack of sleep, careless eating habits, the lack of exercise, the irregular eating patterns, especially in this internet age, and the irregular eating habits. When you are having periods, you are usually in the mood to eat snacks a lot...” (Adolescent 01)
“...I have been obese since I was in the 3rd grade after tonsillectomy, my weight has increased, I do not know why. Maybe it is hereditary because daddy is also fat...” (Adolescent 02)
“...Irregular eating patterns, frequent snacking, the lack of exercise, a bad habit to immediately go to sleep after eating...” (Adolescent 03)
Parents also confirmed the causes of overweight. Their statements are as follows:
“...heredity, diet, the lack of activities, playing on cell phone too much, snacking a lot, eating junk food, eating a lot of fatty foods, the lack of exercise...” (Parent 01)
“...The cause of fat is inadequate exercise, snacking a lot, especially at night, not eating enough vegetables...” (Parent 02)
“...The cause of being fat is inadequate exercise, snacking a lot, especially at night, and not eating enough vegetables...” (Parent 03)
3.1.1.3. Thema 3: Overweight Prevention Program in Schools
Three adolescents said that there were still few overweight prevention programs in schools. Their statements are as follows:
“...There have been no programs from school health efforts for healthy lifestyles, perhaps because of the pandemic...” (Adolescent 01)
“...Weight and height measurements have never been carried out at school because of the online learning. There is also no counselling about healthy food and healthy lifestyles from schools...” (Adolescent 02)
“...I received brief information from the school about eating nutritious food and we were told to jog...” (Adolescent 03).
Five teachers also confirmed that adolescent’s statements about health programs in schools. The statements are as follows:
“...Because of the pandemic, the school health program in collaboration with the community health centre has not been implemented. I have been appointed as a school health coach starting in January 2020, while we had a pandemic in March 2020. Previously, there were some activities, but they were handled by previous health coach...” (Teacher 01)
“...The program on nutrition issues in schools for the past 2 years may not be implemented due to the pandemic, but we have planned collaborative outreach with the officials from Community Health Centre to hold education or seminars on nutrition...” (Teacher 02)
“...The program on nutritional issues in schools for the past 2 years may not be implemented, but we have planned...” (Teacher 03)
“...The activity is just the delivery of information to students about what should be served on their plates, what foods they should eat...” (Teacher 04)
“...Because of the pandemic conditions for the past 2 years, the health program has not been implemented. Maybe, next year we will start again...” (Teacher 05)
Two health workers at the community health centre gave the same statement about health activities in schools. Their statements are as follows:
“... School health activities, like my health report book, were not carried out because we do not have enough funds for these. “The existing program is a youth care health program for now, but it is not yet carried out because of COVID, it was implemented last year...” (Health worker 01).
“...Because there have been no activities for 2 years, thanks to COVID. New plans will be carried out again this year...” (Health worker 02)
3.1.1.4. Univariate Analysis
Based on the results of adolescent respondents’ characteristics, the highest age range of adolescents was 16-17 years (48.3%). The gender of the adolescent respondents was dominated by females (58.0%). The father's education level was high (77.7%), and so was the mother's (75.3%). Students’ fathers worked in the private sector/trade or were self-employed (43.0%), while mothers did not work (56.0%). The result also showed high socioeconomic status (88.0%), nutrition knowledge level (57.7%), good attitude (55.7%), high-calorie consumption (67.3%), moderate carbo- hydrate consumption (81.0%), high protein consumption (75.7%), good healthy eating index (72.0%), breakfast skipping (52.7%), habit of eating richer food <4 days/week (54, 0%), vegetable consumption habit <5 times/week (68.0%), total vegetable consumption <3 servings/day (68.3%), fruit consumption habit ≤4 times/week (62.0%), total fruit consumption <3 servings/day (63.3%), fast food eating habit <4 times/week (63.7%), soft drink consumption habit <4 days/week (56.7%), physical activities <6 times/week (76.0%), duration of physical activities <15 minutes/day (51.4%), habit of playing games and watching television >2 hours/day (66.7%), and duration of sleep <8 hours/day or ≥9 hours/day (61.3%). The results of the nutritional status analysis showed that 19.7% of adolescents were overweight based on their body mass index and age.
3.1.1.5. Bivariate Analysis
The results of bivariate analysis using the chi-square test showed that the variables significantly associated with overweight (p<0.05) were nutritional knowledge, eating attitude, calorie consumption, fat consumption, carbohydrate consumption, vegetable/fruit consumption habits, soft drink consumption habits, and duration of physical activities (Table 1).
| Nutritional Status | Total | % |
|---|---|---|
| Overweight | 59 | 19.7 |
| Normal | 241 | 80.3 |
| Total | 300 | 100.0 |
3.1.1.6. Multivariate Analysis
Multivariate analysis using the logistic regression test of the enter method was conducted by including all candidate variables of p-value <0.25 [9]. The equation obtained was as follows:
y = Constant+β1X1+β2X2+...+βiXi
y = -7.702 + (2.657*carbohydrate consumption) + (2.798*fat consumption) + (1.826*amount of vegetable consumption) + (0.884*length of physical activities) + (1.085*level of knowledge) (Tables 2 and 3).
The equation aimed to predict the probability of an adolescent being overweight using the formula:
 |
Description
p = the probability of the occurrence of an event e = natural numbers = 2,7
y = constant + a1x1 + a2x2 +……..+aixi
a = coefficient value of each variable x = independent variable value
Adolescents had the risk factors of excessive carbohydrate and fat consumption, vegetable consumption <3 servings/day, physical activity duration <15 minutes/ day, and low knowledge level, while the predicted probability of being overweight was 82.31%.
| Risk Factors | - | Nutritional Status |
OR 95% CI |
P value1 | ||||
|---|---|---|---|---|---|---|---|---|
| Total | Overweight | - | Normal | - | ||||
| n | % | n | % | n | % | |||
| Age | - | - | - | - | - | - | - | - |
| <16 years old | 124 | 100.0 | 30 | 24.2 | 94 | 75.8 | - | 0.230 |
| 16-17 years old | 145 | 100.0 | 23 | 59.9 | 122 | 84.1 | - | - |
| >17 years old | 31 | 100.0 | 6 | 19.4 | 25 | 80.6 | - | - |
| Gender | - | - | - | - | - | - | - | - |
| Male | 126 | 100.0 | 23 | 18.3 | 103 | 81.7 | 0.86 0.48-1.53 |
0.706 |
| Female | 174 | 100.0 | 36 | 20.7 | 138 | 79.3 | - | - |
| Father's Education | - | - | - | - | - | - | - | - |
| Low | 67 | 100.0 | 12 | 17.9 | 55 | 82.1 | 0.863 0.428-1.742 |
0.813 |
| High | 233 | 100.0 | 47 | 20.2 | 186 | 79.8 | - | - |
| Mother’s Education | - | - | - | - | - | - | - | - |
| Low | 74 | 100.0 | 13 | 17.6 | 61 | 82.4 | 0.834 0.422-1.647 |
0.723 |
| High | 226 | 100.0 | 46 | 20.4 | 180 | 79.6 | - | - |
| Father's Occupation | - | - | - | - | - | - | - | - |
| Civil Servants/State-Owned Enterprise/Pensioner/Indonesian National Army | 57 | 100.0 | 14 | 24.6 | 43 | 75.4 | - | 0.465 |
| Private/Self-employed/Merchant | 129 | 100.0 | 26 | 20.2 | 103 | 79.8 | - | - |
| Farmer / Fisherman / Driver / Labourer / Tradesman | 114 | 100.0 | 19 | 16.7 | 95 | 83.3 | - | - |
| Mother’s Occupation | - | - | - | - | - | - | - | - |
| Not working | 168 | 100.0 | 26 | 15.5 | 142 | 84.5 | 0.55 0.31-0.98 |
0.056 |
| Work | 132 | 100.0 | 33 | 25.0 | 99 | 75.0 | - | - |
| Family Per Capita Income Level | - | - | - | - | - | - | - | - |
| Low | 36 | 100.0 | 5 | 13.9 | 31 | 86.1 | 0.63 0.23-1.69 |
0.480 |
| High | 264 | 100.0 | 54 | 20.5 | 210 | 79.5 | - | - |
| Knowledge Level | - | - | - | - | - | - | - | - |
| Less | 127 | 100.0 | 37 | 29.1 | 90 | 70.9 | 2.82 1.57-5.08 |
0.001* |
| Decent | 173 | 100.0 | 22 | 12.7 | 151 | 87.3 | - | - |
| Attitude | - | - | - | - | - | - | - | - |
| Less | 133 | 100.0 | 38 | 28.6 | 95 | 71.4 | 2.78 1.53-5.03 |
0.001* |
| Decent | 167 | 100.0 | 21 | 12.6 | 146 | 87.4 | - | - |
| Calorie Consumption | - | - | - | - | - | - | - | - |
| Higher | 124 | 100.0 | 53 | 26.2 | 149 | 73.8 | 5.45 2.26-13.19 |
0.000* |
| Intermediate | 176 | 100.0 | 6 | 6.1 | 92 | 93.9 | - | - |
| Protein Consumption | - | - | - | - | - | - | - | - |
| Higher | 274 | 100.0 | 50 | 18.2 | 224 | 81.8 | 0.42 0.18-1.00 |
0.080 |
| Intermediate | 26 | 100.0 | 9 | 34.6 | 17 | 65.4 | - | - |
| Fat Consumption | - | - | - | - | - | - | - | - |
| Higher | 227 | 100.0 | 56 | 24.7 | 171 | 75.3 | 7.64 2.32-25.23 |
0.000* |
| Intermediate | 73 | 100.0 | 3 | 4.1 | 70 | 95.9 | - | - |
| Carbohydrate Consumption | - | - | - | - | - | - | - | - |
| Higher | 57 | 100.0 | 30 | 52.6 | 27 | 47.4 | 8.19 4.29-15.69 |
0.000* |
| Intermediate | 243 | 100.0 | 29 | 11.9 | 214 | 88.1 | - | - |
| Healthy Eating Index | - | - | - | - | - | - | - | - |
| Less | 84 | 100.0 | 21 | 25.0 | 63 | 75.0 | 1.56 0.85-2.86 |
0.198 |
| Decent | 216 | 100.0 | 38 | 17.6 | 178 | 82.4 | - | - |
| Breakfast Habits | - | - | - | - | - | - | - | - |
| Skipping Breakfast | 158 | 100.0 | 37 | 23.4 | 121 | 76.6 | 1.67 0.92-2.99 |
0.114 |
| Having Breakfast | 142 | 100.0 | 22 | 15.5 | 120 | 84.5 | - | - |
| The Habit of Eating Snacks | - | - | - | - | - | - | - | - |
| ≥4days/week | 138 | 100.0 | 30 | 21.7 | 108 | 78.3 | 1.27 0.72-2.25 |
0.492 |
| <4 days/week | 162 | 100.0 | 29 | 17.9 | 133 | 82.1 | - | - |
| Vegetable Consumption Habits | - | - | - | - | - | - | - | - |
| <5times/week | 174 | 100.0 | 43 | 24.7 | 131 | 75.3 | 2.23 1.21-4.23 |
0.015* |
| ≥5times/week | 126 | 100.0 | 16 | 12.7 | 110 | 87.3 | - | - |
| Total Vegetable Consumption | - | - | - | - | - | - | - | - |
| <3 servings/day | 205 | 100.0 | 54 | 26.3 | 151 | 73.7 | 6.4 2.48-16.68 |
0.000* |
| ≥3 servings/day | 95 | 100.0 | 5 | 5.3 | 90 | 94.7 | - | - |
| Fruit Consumption Habits | - | - | - | - | - | - | - | - |
| ≤4 times/week | 186 | 100.0 | 44 | 23.7 | 142 | 76.3 | 2.04 1.07-3.87 |
0.038* |
| >4 times/week | 114 | 100.0 | 15 | 13.2 | 99 | 86.8 | - | - |
| Total Fruit Consumption | - | - | - | - | - | - | - | - |
| <3 servings/day | 190 | 100.0 | 47 | 24.7 | 134 | 75.3 | 2.68 1.3-5.3 |
0.006* |
| ≥3 servings/day | 110 | 100.0 | 12 | 10.9 | 98 | 89.1 | - | - |
| The Habit of Eating Fast Food | - | - | - | - | - | - | - | - |
| ≥4 days/week | 109 | 100.0 | 22 | 20.2 | 87 | 79.8 | 1.05 0.58-1.89 |
0.985 |
| <4 days/week | 191 | 100.0 | 37 | 19.4 | 154 | 80.6 | - | - |
| Soft Drink Habit | - | - | - | - | - | - | - | - |
| ≥4 days/week | 130 | 100.0 | 35 | 26.9 | 95 | 73.1 | 2.24 1.26-4.00 |
0.009* |
| <4 days/week | 170 | 85.9 | 24 | 14.1 | 146 | 85.9 | - | - |
| Physical Activity | - | - | - | - | - | - | - | - |
| <6 times/week | 228 | 100.0 | 50 | 21.9 | 178 | 78.1 | 1.96 0.91-4.23 |
0.113 |
| ≥6 times/week | 72 | 100.0 | 9 | 12.5 | 63 | 87.5 | - | - |
| - | - | - | - | - | - | - | - | - |
| Length of Physical Activity | - | - | - | - | - | - | - | - |
| <15 minutes/day | 154 | 100.0 | 43 | 27.9 | 111 | 72.1 | 3.15 1.68-5.89 |
0.000* |
| ≥15 minutes/day | 146 | 100.0 | 16 | 11.0 | 130 | 89.0 | - | - |
| Gaming and TV-watching Habits | - | - | - | - | - | - | - | - |
| >2 hours/day | 200 | 100.0 | 46 | 23.0 | 154 | 77.0 | 1.99 1.02-3.90 |
0.057 |
| ≤2 hours/day | 100 | 100.0 | 13 | 13.0 | 87 | 87.0 | - | - |
| Sleep Duration | - | - | - | - | - | - | - | - |
| <8 hours/day or ≥9 hours/day |
184 | 100.0 | 36 | 19.6 | 148 | 80.4 | 0.94 0.5-1.7 |
1.000 |
| 8-9 hours/day | 116 | 100.0 | 23 | 19.8 | 93 | 80.2 | - | - |
| Variables | B | Wald | p-value 1 | OR2 | 95%CI | |
|---|---|---|---|---|---|---|
| Lower | Upper | |||||
| Carbohydrate consumption | 2.657 | 33.677 | 0.000 | 14.252 | 5.810 | 34.961 |
| Fat consumption | 2.798 | 15.694 | 0.000 | 16.417 | 4.112 | 65.544 |
| Total vegetable consumption | 1.826 | 11.236 | 0.001 | 6.210 | 2.135 | 18.063 |
| Length of physical activity | 0.884 | 5.256 | 0.022 | 2.420 | 1.137 | 5.152 |
| Knowledge level | 1.085 | 8.547 | 0.003 | 2.961 | 1.430 | 6.130 |
| Constant | -7.702 | 32.423 | 0.000 | 0.00 | - | - |
2Adjusted odds ratio (95% confidence interval) calculated by exclusion variables for which p≥0.05.
3.1.2. Phase 2 Drafting Application Blueprints and Screening Questions
The prototype design of the overweight prediction application in adolescents based on risk factors was in the form of an application display design for the overweight prediction, which included the opening section (intro), the core section (content) and the closing section. The framework in this overweight prediction application for adolescents included a home view, profile, contact, list, and login page.
3.1.3. Phase 3 Application Development
The data testing on 100 students and adolescents showed accuracy at 95.0%, sensitivity at 93.33%, and specificity at 95.71%. The result of application design validation by 2 experts was 0.96 (valid), while the validation of application construction and content by experts was 0.84 (valid). The teacher response practicality was 92.22% (very practical), while the adolescent response practicality was 85.45% (very practical), in which adolescent response effectiveness was 85.05 (very good).
4. DISCUSSION
A nutritional status analysis showed the result that 19.7% of adolescents in Padang City were overweight, and the percentage was calculated based on their body mass index and age. Being overweight is a chronic medical disease, a recurrent, progressive condition, and a social problem that is difficult to solve. It is biologically described as the result of energy surplus due to some individual factors, such as diet habits, physical activities, and genetic predisposition. However, individual-level factors are mostly driven by obesogenic environments and systemic forces, namely economic, social, and political factors [10].
The establishment of a socioecological model for healthy lifestyle promotion and a framework of overweight determinants is a solution for overweight prevention. A three-layer framework with key components of interaction is used for the development of overweight in China. Individual-level risk factors are the main target to address obesity in a clinical practice or on a small scale. However, the lifestyle of average Chinese people, such as diet and physical activities, has changed, along with the rapid socioeconomic development in recent decades [8].
Overweight is caused by multiple factors, including daily snack consumption, parents' nutritional status [11], gender [12], age, parents’ education level, parents' occupation, place of residence, number of family members [13], school type, economic status, television viewing time, fruit consumption per week [14], vegetable and fruit consumption per day, physical activities, sedentary habits [15, 16].
Variables significantly associated with overweight were level of nutrition knowledge (p=0.001), attitude (p=0.001), calorie consumption (p=0.000), fat consump- tion (p=0.000), carbohydrate consumption (p=0.000), vegetable consumption habits (p=0.015), vegetable consumption (p=0.000), fruit consumption habits (p=0.038), fruit consumption (p=0.006), drinking habits (p=0.009), duration of physical activities (p=0.000).
Inadequate nutrition knowledge can obstruct the adoption of healthy behaviours to maintain an ideal weight. Nutrition knowledge includes declarative knowledge regarding facts and processes, as well as procedural knowledge on how to perform certain tasks. Both are needed in making healthy choices [17].
Although not all studies proved relevance between nutrition knowledge and behaviour, there is a known positive relation between nutrition knowledge and fruit/vegetable consumption [18], more frequent use of nutrition facts labels [19], an increased likelihood of minimizing salt intake and choosing foods high in fibre [20]. Nutrition knowledge was also reported to mediate the relationship between socioeconomic status and diet quality [21].
The results of a study by Hossain et al. (2019) found that maternal attitudes were significantly associated with children's weight status [22]. According to Arunachalam and Kandasami (2019), obesity prevention requires effective interventions, in which mothers and children must have good attitudes towards overweight and its prevention to perform the intervention [23]. Women have higher attitudes towards being overweight compared to men [24].
Studies in Malaysia showed the energy intake of several ethnic groups and genders. In normally healthy subjects, the energy intake of Indians was significantly lower than that of other ethnic groups, whereas Malaysian women showed significantly higher energy intake. Men in urban areas consumed significantly more energy compared with those in rural areas [25]. Other studies have shown that calorie intake after 8 p.m. may increase the risk of obesity [26].
According to R.I & Wirawanni (2014), carbohydrates belong to the energy sources. The percentage of carbohydrates accounts for half of the total energy or higher. Carbohydrates are contained mostly in staple foods that are primarily consumed or have been a part of the eating culture of various ethnic groups in Indonesia for a long time. Examples of carbohydrate-containing foods are rice, corn, cassava, yam, taro, arrowroot, sorghum, barley, sago, and their processed products. Indonesia is rich in a variety of carbohydrate foods [27].
Body weight is affected by energy expenditure, which is related to energy intake from carbohydrates and fats. Excess weight in adolescents can be solved with a good diet. The results showed that the odds of obesity were 1.6 times higher in people consuming more carbohydrates [28].
According to their fatty acid content, fats are divided into two groups, namely unsaturated and saturated fats. High consumption of saturated fatty acids is considered a risk factor for obesity and cardiovascular disease. The consumption of saturated fat should be less than 10% of total energy intake. In contrast, unsaturated fats have a favourable impact on health. Research in rats showed that diets high in unsaturated fat and low in saturated fat favourably affected heart function [29].
The World Health Organization (WHO) and the Balanced Nutrition Guidelines generally recommend the daily consumption of vegetables and fruits for a healthy life at 400 gram per person, including 250 gram of vegetables (equivalent to 2 ½ servings or 2 ½ cups of vegetables after cooking and draining) and 150 gram of fruit, (equivalent to 3 medium Ambon bananas or 1 ½ pieces of medium papaya or 3 medium oranges) [30].
Based on the data of Basic Health Research in 2013, 93.5% of the total Indonesian population, at an age over 10, still consumed vegetables and fruits below the daily recommendation, which should be at least 5 servings of vegetables and fruits. In other words, many people are still reluctant to consume enough vegetables and fruits, though vegetables and fruits contain vitamins and minerals required by their bodies [5].
Vegetables and fruits are high in fibre, which is needed to bind cholesterol from fast food to prevent it from flowing through the blood vessels. A person rarely has obesity when consuming fibre-containing foods as needed. Overweight teenagers need more fibre-containing foods, vegetables in particular. Fibre can provide a longer satiety effect that prevents the body from quickly feeling hunger [31].
Another major factor that has been shown to correlate with the overweight is an increased consumption of soft drinks or carbonated beverages (CB). CBs were first introduced in Europe in the 17th century as an attempt at therapeutic use. Additional components were later incorporated into the drinks that allowed them to penetrate the commercial market. CBs have been improved and widely advertised, with children as their target market [32].
Most CBs contain sugar as their key ingredient, while an alternative to sugar is the use of artificial sweeteners, such as aspartame. Carbon dioxide is introduced into the drink as a response to the demand to add acidity and strengthen the drink’s flavour. The amount of carbonic acid produced in CB from carbon dioxide depends on the pressure used to introduce the gas in the beverage. The gas also serves as a preservative that keeps the beverage for a longer period of time [30].
Regular physical activity is beneficial for regulating body weight and strengthening blood vessels and the heart system [26]. Physical activities can facilitate the metabolic system in the body, including nutrient metabolism. Activities that can be carried out by school-age children include regular exercise and extracurricular activities at school and other places, to help them balance energy expenditure [33]. A research conducted by Saad et al. (2021) showed the result that the average daily step count increased by 3,571.59, with a decrease in body weight (-2.20 kg) and BMI (-0.94 kg/m2) [34]. Excess weight increased at a much greater rate among the non-exercising group (a predicted probability [PP] from 0.23 to 0.32) and high-calorie group (PP from 0.18 to 0.37) compared to the active and low-calorie groups [35].
The initial treatment for overweight children aims to assess the amount of physical activities carried out. Children who spend a lot of time in low-energy activities (e.g., watching television or playing video games) are recommended to have more physical activities. The U.S. government and health experts recommend 60 minutes of physical activity or longer to help children reach and maintain their ideal weight in the future [31].
Furthermore, based on multivariate analysis using a logistic regression test by including all candidate variables of p-value <0.25. The variables that collectively affected obesity were carbohydrate consumption, fat consumption, vegetable consumption, duration of physical activities, and level of knowledge.
The following equation was obtained:
y = -7.702 + (2.657*carbohydrate consumption) + (2.798*fat consumption) + (1.826*amount of vegetable consumption) + (0.884*duration of physical activities) + (1.085*level of knowledge).
The equation obtained aims to predict the probability of an adolescent experiencing overweight using the formula as follows:
p = 1/(1+eˉʸ)
The equation above can predict the odds of an adolescent being overweight. Furthermore, adolescents had risk factors, namely excessive carbohydrate and fat consumption, vegetable consumption <3 servings/day, physical activities time <15 minutes/day, and low knowledge level. Thus, it can be predicted that the probability of being overweight was 82.31%. The result of application design validation by 2 experts was 0.96 (valid), while the assessment points included integration, user feedback, question evaluation, balance, form, and language. Validation of application construction and content by experts was 0.84 (valid). The assessment points included the accuracy of the system's work, the suitability of the system to needs, the quality of the system's work, and the quality of display. The result of the teachers’ response practicality was 92.22% (very practical), while the assessment points included the quality of content and objectives, technical quality, learning, and instructional quality. The result of the adolescent response practicality was 85.45% (very practical), in which the assessment points included the quality of content and objectives, technical quality, learning, and instructional quality. The adolescent response effectiveness result was 85.05 (very good), in which the assessment included performance, information, economy, control, efficiency, and service. Efforts to prevent being overweight from an early age can be made by paying attention to the tendency of variables that are the most influential to being overweight.
CONCLUSION
In conclusion, we found that the most dominant risk factors affecting the incidence of overweight in adolescents in Padang City were carbohydrate consumption, fat consumption, amount of vegetable consumption, duration of physical activities, and level of knowledge.
The model was constructed using the equation. An increase in the five variable values contributed to the odds of being overweight in adolescents at 82.31% using the logistic regression test. Thus, adolescents should pay attention to these variables to prevent becoming overweight.
AUTHORS' CONTRIBUTION
It is hereby acknowledged that all authors have accepted responsibility for the manuscript's content and consented to its submission. They have meticulously reviewed all results and unanimously approved the final version of the manuscript.
LIST OF ABBREVIATIONS
| BMI | = Body Mass Index |
| SQ FFQ | = Semi-Quantitative Food Frequency |
| HEI | = Healthy Eating Index |
| CB | = Carbonated Beverages |
ETHICS APPROVAL AND CONSENT TO PARTICIPATE
Ethical approval for this research was granted by the Research Ethics Committee, Faculty of Medicine, Andalas University, Padang, Indonesia (Approval number: 671/UN. 16.2/KEP-FK/2022, dated 30th of March, 2022), West Sumatra Provincial Education Department, with a permit number: 070/1434/PSMA-2022, dated 11th of March, 2022, The Health Department of Padang City, with permit number: 891/2348/DKK/2022, dated 28th of March, 2022.
HUMAN AND ANIMAL RIGHTS
All human research procedures were under the ethical standards of the committee responsible for human experimentation (institutional and national) and with the Helsinki Declaration of 1975, as revised in 2013.
CONSENT FOR PUBLICATION
Informed consent was obtained from all respondents participating in the study.
AVAILABILITY OF DATA AND MATERIALS
The Suplementary material’s supporting of this article is available in Zenodo repository with more detail please visit the link : https://zenodo.org/records/12583641.
FUNDING
This study was Funded by Indonesian Ministry of Health, with grant number HK.02.02/H.5/258/2017.
CONFLICT OF INTEREST
The authors declare no conflict of interest. The authors of the paper do not have any financial or personal relationships that might act as a source of bias or impact the findings and conclusions that are given in the paper. The study was carried out in a fair and unbiased manner, free from any external influences or competing interests, and without any academic bias.

