All published articles of this journal are available on ScienceDirect.

COVID-19 Mental Health Impact Analysis using Ensemble-based Classifier
Authors Info & Affiliations
Abstract
Introduction
In the 21st century, human community witnessed a range of biological crises resulting in long-term consequences like loss of life, economic decline, trauma and social disruptions. COVID -19, named the SARs-CoV-2 virus by United Nations, was a similar outbreak in China in the year 2019, which later spread across the world. During the pandemic, as part of preventive measures, the government authorities introduced SOP (standard operating procedures) measures such as social distancing, lockdown, quarantining and closure of educational institutions imposing a great impact on mental health and well-being of humans, especially among the youth.
Materials and Methods
A study was performed on a public dataset containing survey records collected from 1182 students of different educational institutions. The survey data was based on age, region of residence, time spent online and health fitness. The method used in the proposed work is a classifier model based on an ensemble of decision trees called random forest to predict the consequences of online learning on student’s health. The optimum and promising features are selected by using Recursive feature elimination (RFE) method.
Results
Our findings reveal a notable enhancement in predicting human health during a pandemic, as indicated by a significant increase in validation accuracy based on confusion for various classifiers. Experimental validation of the developed classifier model is done through the confusion matrix and receiver operating characteristic (ROC) curve. Further, performance metrics such as accuracy, precision, recall, F1-score, specificity, and error rate were employed. The experimental results established the superiority of the proposed ensemble subspace discriminant classifier compared to traditional classifiers.
Discussions
The RFE feature selection method used in the proposed work helps to select the optimum features as well as more informative features. Moreover, the method employed hyper parameter tuning method to enhance the performance of the classifier model.
Conclusion
This study highlights the importance of taking care of the emotional and physical health of humans during any pandemic. Furthermore, our approach possesses the capacity to significantly influence the field of predicting health, facilitating the development of more effective and advanced prediction strategies in the future.
1. INTRODUCTION
Throughout human history, the outbreak of several fatal infectious diseases normally increases the mortality rate, which in turn disturbs the economic, emotional, and political aspects of the society. The spread of COVID-19 is one of those instances that has brought about a life-threatening situation for humanity. During the pandemic, a significant number of individuals were in adverse situations, with many experiencing loss of income, employment, livelihoods, and businesses. Infected individuals were quarantined, while others were mandated to stay at home. Every sector of society was directly or indirectly impacted by the restrictions imposed to minimize the spread of COVID-19 disease [1, 2]. The worst affected were the students whose studies and daily lives were centered on online platforms. Moreover, the imparted COVID-19 protocol with quarantine and lockdowns implanted the fear of losing lives and the stability of life, causing a crack in the foundation of humanity. They found themselves in a challenging situation; balancing their studies and also highly cautious if any of their family members were affected by COVID-19.
Educational Institutions are forced to adopt online education for their students to safeguard them from COVID-19 and to impart education. Hence, students are also left with no other choice other than to use electronic devices such as laptops, mobile phones, and tablets extensively for their online classes. The absence of physical movement and socialization resulted in numerous mental and physical health challenges among the students [3-5]. COVID-19 brought a state of lockdown, caused disruption in students, education, and caused significant health issues among students [3].
The main objective of the paper is to develop a robust and accurate classifier model by using an ensemble of decision trees called a random forest model. The model utilizes features including age, type of device used, duration of usage, and student’s interest in online classes. Based on these features, the model predicts the severity of student’s health because of the increased use of electronic devices during this pandemic. It requires real-time data regarding the time spent by students on various activities in a day inclusive of studies.
The main contribution of the proposed work includes:
• An efficient feature selection method named Recursive Feature Elimination (RFE) is presented to determine the most promising features.
• The ensemble-based random forest classifier model is built for determining student’s health.
• The performance evaluation is done through the k-cross validation technique, which constructs a confusion matrix and ROC curve.
• From the confusion matrix and ROC curve, we conducted an in-depth statistical evaluation of the prediction performance using accuracy precision, recall, F1-score, specificity, and error rate. The experimental results established the superiority of the proposed ensemble classifier model.
This study is organized into various sections. Section II discusses the related works during COVID-19 pandemic. Section III elucidates the methodology of the proposed work. Section IV discusses the performance evaluation of the proposed system for classifying student health during COVID-19 pandemic. Conclusion and future scope are given in Section V.
2. RELATED WORKS
Research has been carried out to mitigate various causes of COVID-19's adverse effects on society and has been collected and presented in the section in a nutshell. The pandemic brought in lockdown to prevent widespread use of the virus [4]. Students all over the globe [1] were forced to stay indoors while the school quickly adapted to an online format. COVID-19 has not only caused mental health issues, but it also has deteriorated the physical health of the students significantly [6].
Hana Alharthi [7] conducted an extensive analysis on the level of generalized anxiety disorder during the coronavirus pandemic among college students using artificial intelligence technology. The features used to develop the best fit model to predict anxiety are gender, support system, and family income. Based on these factors, ranks are provided for the most important factors affecting anxiety. Mhanaj et al. [8] studied and designed an online self-assessment system for anxiety disorder to support student wellbeing during COVID-19. The three prototypes built and compared for the analysis are conventional websites and virtual reality immersive environments with single and multiple advisors. Wesley et al. [9] evaluated students’ concerns regarding remote learning amidst the COVID-19 pandemic using a Brazilian dataset. The student’s performance greatly depends on both families’ financial and emotional conditions. Liu Jing Yu [10] investigated the effects and potential remedies stemming from International Public Health Emergency response measures on both supply as well as demand aspects of trade. Hence, it explores its impact on the international free trade system, supply-side, supply chain security and efficiency, and international finance.
Abdulrahim Mohammed et al. [11] identified a significant gap in teaching and learning in Private High schools in Bahrain during COVID-19. They use Decision Tree (DT), Density-Based Clustering (DBC), and Linear Regression (LR) for their analysis. They concluded that the student’s performance depends on family life and the parent’s educational level. Suzanna et al. [12] explored opportunities for home-based learning among parents and students during the Covid-19 pandemic. COVID-19 has resulted in numerous challenges to the teaching and learning process, which were investigated using a descriptive qualitative method [13].
Sudip Vhaduri et al. [14] researched about the phone call patterns of students to improve their lives. When high school students move to college to continue their further studies, they face various problems which include responsibility in life, interacting with new people, and fewer comfort zones. Guiping Zhu et al. [15] examined the challenges and novel approaches in online teaching amidst the COVID-19 pandemic in China. During Spring 2020, all schools and colleges were closed due to the outbreak of pandemics. The Ministry of Education in China felt that the contribution of teaching and learning could improve the negative impact of student self-development. The feedback has been obtained based on questionnaires, and the result showed that the online teaching method outcome will have better student communication through online tools.
Maria Chierichetti et al. [16] chose Engineering College at San José State University to analyze the experience of students in online learning due to COVID-19. Two surveys were conducted in two phases. The first Survey in spring 2020 included the experience of students to move learning to 100% online. The second survey in the fall of 2020 was conducted about the experience of students and faculty with online learning. In Spring 2020, the survey was responded to a large number of students belonging to the international and Asian-American communities. The result shows that 79% of students face severe stress due to shelter, whereas other students worry about time management, lack of interaction with their friends and fellow students, and worried about their well-being. In Fall 2020, the survey reported that students faced severe stress, anxiety, and lack of motivation. Based on the surveys, the university includes six categories of suggestions which include recording and posting lectures online, dynamic online learning, using Canvas and Zoom for better teaching, more proficiency, interacting with students, and giving more practice problems. After transitioning to in-person instruction in 2021, students reported that an optimum blend of online and face-to-face instruction improved their mental health well-being and a better understanding of concepts by using more practical applications.
Iskandar Mukhametzyanov [13] carried out research to analyze device screen time for Children and Adolescents during COVID-19. This shows that the device time of contacts of students on social media platforms such as Instagram, WhatsApp, Twitter, FaceBook and YouTube increased. This would affect the student's both physical and mental health. The authors investigated the direct and indirect consequences of the impact of device time of contact. The direct consequences are pain syndrome, metabolic disorders, obesity and hypodynamia. The indirect consequence includes behavioral disorders such as socialization. It is very difficult to optimize the length of screen time during the COVID-19 pandemic due to educational purposes.
Anbarasi et al. [17] analyzed the link between sleep difficulties and levels of anxiety by utilising measures such as the Pittsburgh Sleep Quality Index (PSQI) and the General Anxiety Disorder Assessment (GAD-7). In addition, the COVID-19 has had a disproportionate impact on students' mental well-being, with academic pressures and social variables contributing to increased anxiety and disrupted sleep patterns.
It is inferred from the literature published earlier that a considerable amount of work related to COVID-19 was carried out throughout the world. However, the results will vary based on the region of study as it greatly depends on people’s culture of the region. Hence, the prediction in India is to be carried out separately as India has a larger population and a very rigid education system and a major portion of its population falls into the middle age group. This study is expected to benefit the government and administrators to predict the effect on the physical and mental health of the students with the increased use of electronic devices during their online classes. It also helps to decide upon remedial measures to overcome the same.
3. MATERIALS AND METHODS
In this proposed work, ensemble based subspace discriminant model is presented to predict student health during COVID-19. The proposed architecture consists of four stages, namely, data acquisition, data preprocessing, features election, and data prediction, which are depicted in Fig. (1).
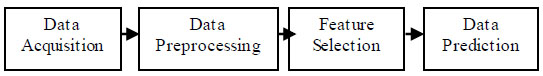
System architecture.
The dataset for the study was acquired from Kaggle (https://www.kaggle.com/datasets/kunal28chaturvedi/covid19-and-its-impact-on-students) and the data was based on a web-based survey through the medium of Google online platforms. The participants in the survey were students from different educational institutions situated in Delhi National Capital Region (NCR) and outside Delhi NCR. The dataset contains 1182 student records. Among 1182 records, 728 Delhi NCR (61%) and 454 outside Delhi NCR (39%) records are present.
The data acquisition step is followed by a preprocessing step which performs data cleaning steps to make acquired data fit the raw data into a clean analysis by machine learning model. In this work, the preprocessing steps used are:
i. Conversion of text-valued attributes into numerical
ii. Split the entire dataset into train and test sets.
The text attribute value of ‘Rating of Online Class experience’ is assigned to a numeric value such as Very poor = 1, Poor = 2, Average =3, Good = 4, Excellent= 5. Similarly, Increased, Decreased, and Remains Constant value in ‘Change in your weight’ is assigned to ['1', '-1', '0'], respectively. Subsequently, 1182 records in the entire set were split into 80 percent training data for 946 records and 20 percent test data for 236 records.
The third stage in data analysis is feature selection, here, the dataset comprises 19 features, among which 15 highly correlated features were selected using the Recursive Feature Elimination (RFE) approach. RFEs iterative approach eliminates the less important features based on Weighted Feature Importance (WFI).
The final stage in data analysis is data prediction. This is carried out using a popular ensemble-based classifier called Random Forest, which combines several decision trees to train their final classifier. In general, the decision tree classifier is based on bagging or bootstrap aggregating techniques, which consider random subsets of data. But, random forest classifiers used both subset and feature sets of data randomly with replacement. This overcomes bias and variance in single and complex trees, respectively. As a result, ensemble-based classifiers are preferred over single-learning classifiers.
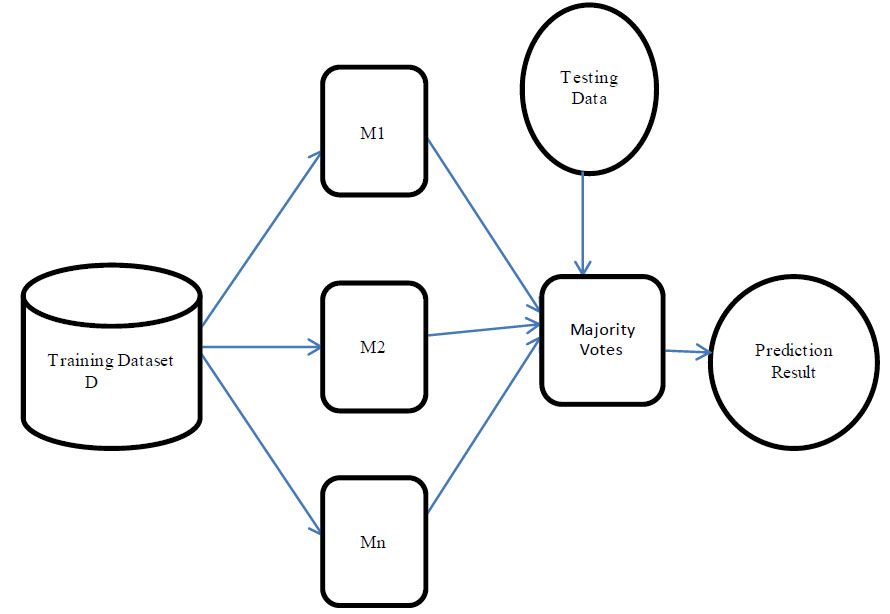
Ensemble-based subspace discriminant classifier.
The proposed ensemble-based subspace discriminant model, which accurately predicts the studentss’ health condition from the acquired is shown in Fig. (2). This is an optimal classifier model since it combines one or more base models. It is a tree-based learning model that works in two phases, namely, training and testing phases, with 20% and 80% of data from the original dataset, respectively. During the training phase, the training dataset D is split into ‘n’ training subsets D1, D2, ….Dn using subspace and feature space replacement method. Splitting the training dataset into subsets reduces the computation time and increases the prediction accuracy. Then, each training subset is given as an input to a decision tree algorithm, which produces a base classifier model. The results from the base classifiers are combined to predict the final output. The predicted final output is determined by the majority of votes among the weighted output of the base classifiers. In this way, the classifier model is trained using the random forest classifier, which is based on ensemble learning. During the testing phase, the test data is given as input to the classifier, which predicts the class label attribute ‘Health issue for the student’ during the COVID pandemic accurately.
Each decision tree in the ensemble model takes three input parameters.
i. Training datasets and their associated class labels
ii. Attribute list describing the training data
iii. Attribute selection method.
The attribute selection method assigned a ranking for each attribute based on the given training dataset. The attribute that shows the highest score, the best score for the measure is chosen as the splitting attribute for the tuples. The attribute that has the highest information gain is chosen as the best splitting attribute typically. There are three attribute selection measures, namely information gain, Gain ratio, and Gini Index. Among them, which information gain is chosen as the attribute selection measure in our proposed work.
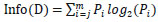
Information gain is the expected information which is used to classify the tuples is given in Eq. (1).
 |
(1) |
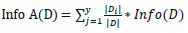
Here, Info(D) represents the average amount of information needed to classify the class label of a tuple and it specifies the entropy of D.D represents a set of class-labeled training tuples in the dataset Info(D) is calculated using Eq. (2),
 |
(2) |
Finally, the Gain ratio is determined using Eq. (3),
 |
(3) |
Due to its significance and the highest information gain among the attributes, age is chosen as the best splitting attribute at the root. The computational complexity of the given training dataset is calculated as O(n*|D| *log(|D|), where ‘n’ represents the number of attributes in the dataset. During the testing phase, the test record is given as input to the training model in which the obtained responses help to predict whether the student’s health issue is affected or not during the lockdown. The classifier is developed in the form of classification rules, and it takes the value of “1” or “0” based on the presence of a health issue or not, respectively. The proposed model works well with large amounts of missing or null values and has been found to provide more accurate prediction than single classifiers. The algorithm for the ensemble-based subspace discriminant classifier is shown in Algorithm 1.
To optimise the performance of the suggested classifier model, the hyperparameter values are finetuned using the GridSearchCV method from the SklearnPython package. The hyperparameters used in the proposed model are as follows: the number of decision trees ranges from 150, 250, 350, or 500; features considered by each tree when splitting a node (max_features) can be either 'auto' or 'sqrt'; the maximum number of levels can be 10 to 100; the minimum number of data points before the node is split and leaf node can be 2, 4, or 8; and the method for sampling data points (bootstrap) can be either true or false.
| Algorithm: Ensemble based Subspace Discriminant Classifier |
|---|
|
Input: D- a set of class-labeled training dataset m- Number of training subsets |
| Output: Accurate prediction results from Ensemble Model D* |
|
Training Phase: For i=1 to m do Create ‘m’ training subsets and feature sets D1, D2, ….Dm from training dataset D. where Di (1 <= i<= m) Constructs a mi decision tree Obtain prediction results from mi decision tree End for |
|
Testing Phase: Use ensemble model to classify testing data For testing data finally obtain the prediction results based on the majority of votes |
4. EVALUATION METRICS
After the training phase, we evaluated the performance of the developed classifier using the confusion matrix and Receiver Operating Characteristic (ROC) curve. The parameters used for the construction of the confusion matrix and ROC curve are mentioned in Table 1.
| Validation Accuracy | Validation Cost | Prediction Speed | Training Time | Feature Selection |
|---|---|---|---|---|
| 86.5% | 159 | 7400 obs/sec | 5.3592 sec | 15 |
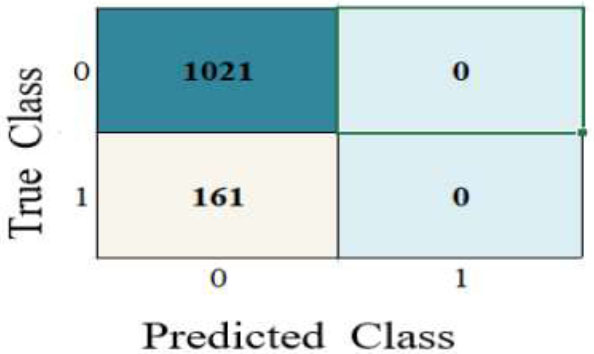
The statistical values are 21 True Positives, 0 True Negatives, 161 False Positives, and 0 False Negatives. Using these values, performance metrics such as accuracy, precision, recall, F1-score, specificity, and error rate were calculated.
The accuracy is computed using Eq. (4), which is the ratio of a number of correctly predicted class labeled attributes “health issue of the student” to the total number of predictions and attained 86.4%.
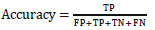 |
(4) |
The next metric is the error rate, which defines the number of incorrectly predicted class labels. The value of error rate is 0.136, which is determined using Eq. (5).
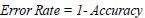 |
(5) |
The important parameter for data measurement is precision. It is the ratio of the number of positively predicted true data to the total predicted data in the dataset consistently, which is shown in Eq. (6) whose value is 0.863.
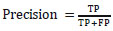 |
(6) |
The proportion of positively predicted true data is called sensitivity or recall, whereas the proportion of positively predicted negative data is called specificity, which is given in Eqs. (7 and 8), whose values are 1 and 0, respectively.
 |
(7) |
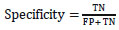 |
(8) |
The F1-score metric is obtained by combining precision and recall, which is represented in Eq. (9) which is 0.9265. It considers both false positives (FP) and false negatives (FN) values. The best possible value of accuracy, precision, recall, F1-score is 100%, whereas the error rate and specificity is 0%.
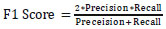 |
(9) |
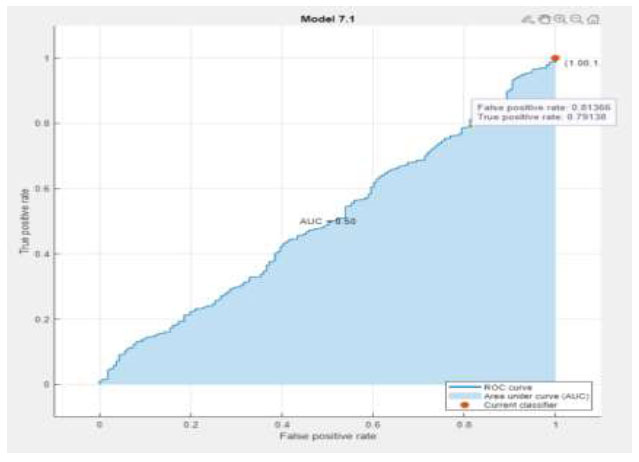
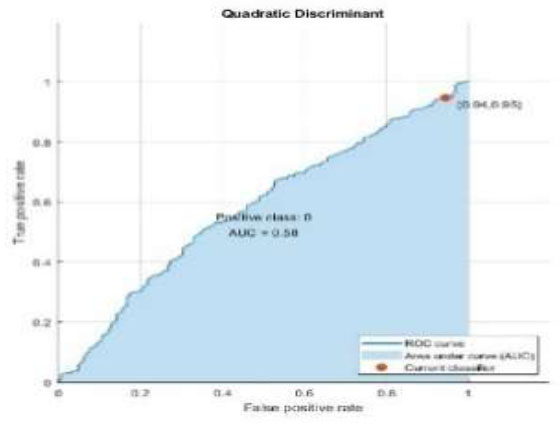
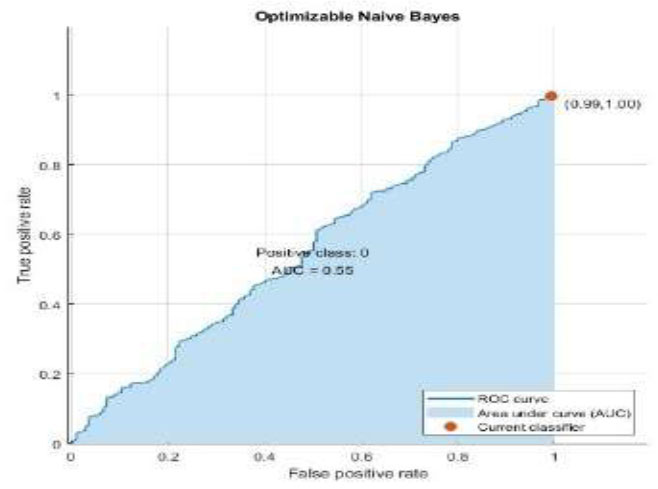
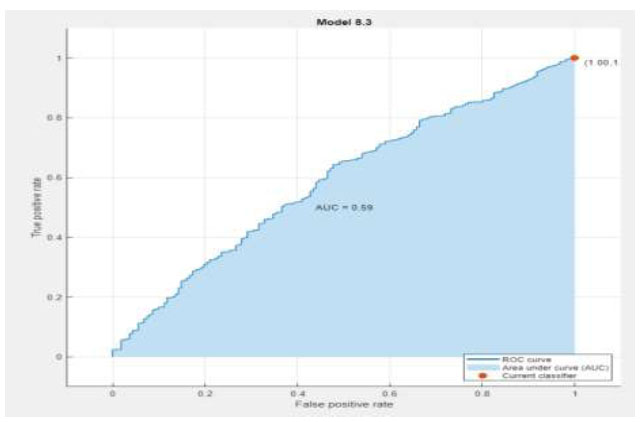
The classifier models' performance is assessed using the Area Under the ROC Curve (AUC), as shown in Table 2. The AUC value, which is produced from the True Positive Rate (TPR) and the False Positive Rate (FPR), is a numerical measure that falls within the range of 0 to 1. The True Positive Rate (TPR) is computed by dividing the number of True Positives (TP) by the sum of true positives and false negatives. Eq (10).
 |
(10) |
| Classifier Model | Confusion Matrix | ROC |
|---|---|---|
| KNN | 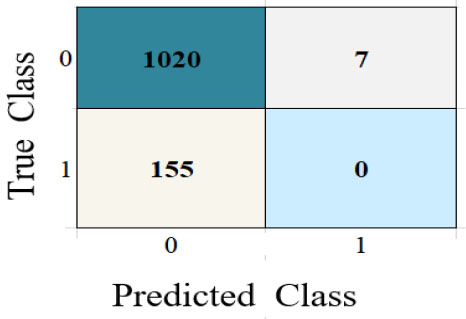 |
 |
| SVM | 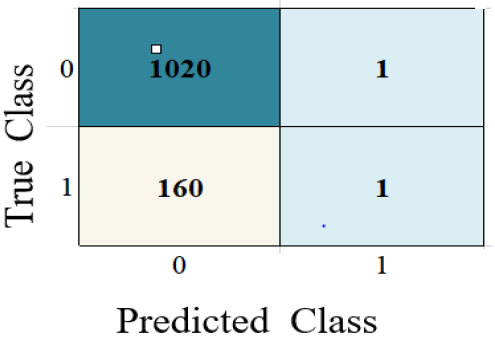 |
 |
| Neural Network | 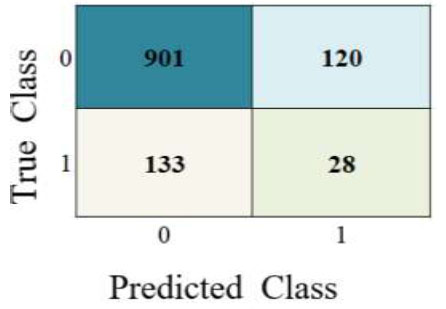 |
 |
| Quadratic Discriminant |
 |
 |
| Linear Discriminant |
 |
 |
| Naïve Bayes | 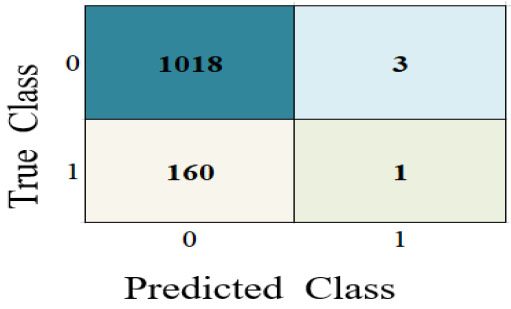 |
 |
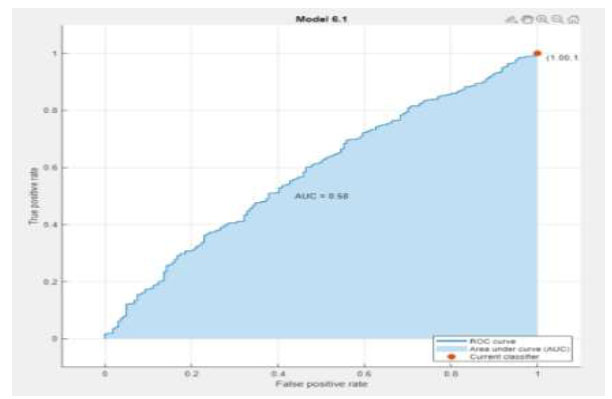
| Ensemble Subspace Discriminant |
 |
 |
The False Positive Rate (FPR) is calculated as the ratio of the number of False Positives (FP) to the total of false positives and true negatives. Eq. (11).
 |
(11) |
AUC is defined as the area under the curve obtained by integrating the True Positive Rate (TPR) with respect to the False Positive Rate (FPR), as shown in Eq. (12).
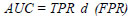 |
(12) |
| Classifier Model | KNN | SVM | Neural Network | Quadratic Discriminant | Linear Discriminant | Naïve Bayes | Ensemble (Subspace Discriminant) |
|---|---|---|---|---|---|---|---|
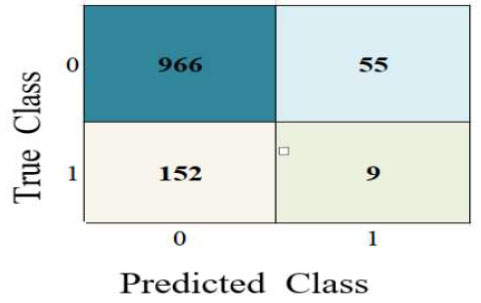
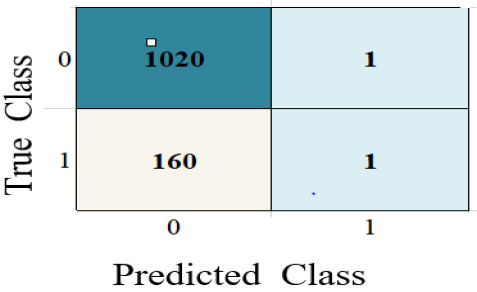
| True Positive (TP) | 1020 | 1020 | 901 | 966 | 1020 | 1018 | 1021 |
| True Negative (TN) | 0 | 1 | 28 | 9 | 1 | 1 | 0 |
| False Positive (FP) | 155 | 160 | 133 | 152 | 160 | 160 | 161 |
| False Negative (FN) | 7 | 1 | 120 | 55 | 1 | 3 | 0 |
| Classifier Model | Validation Accuracy | Error Rate | Precision | Recall | Specificity | F1-score |
|---|---|---|---|---|---|---|
| KNN | 86.3 | 0.137 | 0.868 | 0.993 | 0 | 0.926 |
| SVM | 86.3 | 0.137 | 0.864 | 0.99 | 0.0062 | 0.9322 |
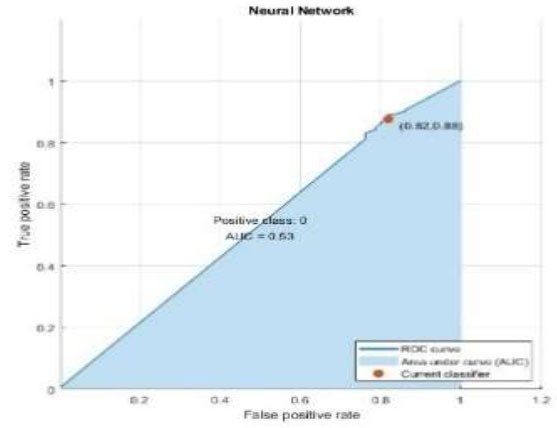
| Neural Network | 78.6 | 0.214 | 0.871 | 0.88 | 0.173 | 0.8755 |
| Naïve Bayes | 86.13 | 0.139 | 0.864 | 0.97 | 0.039 | 0.9138 |
| Quadratic discriminant | 82.5 | 0.175 | 0.864 | 0.94 | 0.055 | 0.9004 |
| Linear discriminant | 86.3 | 0.137 | 0.864 | 0.99 | 0.0062 | 0.9322 |
| Ensemble (subspace discriminant) |
86.4 | 0.136 | 0.863 | 1 | 0 | 0.9265 |
The classifier with the large area under the ROC is considered the best classifier model. Further 5-fold cross-validation technique is used to verify the performance results with 20% of test data.
5. RESULTS AND DISCUSSION
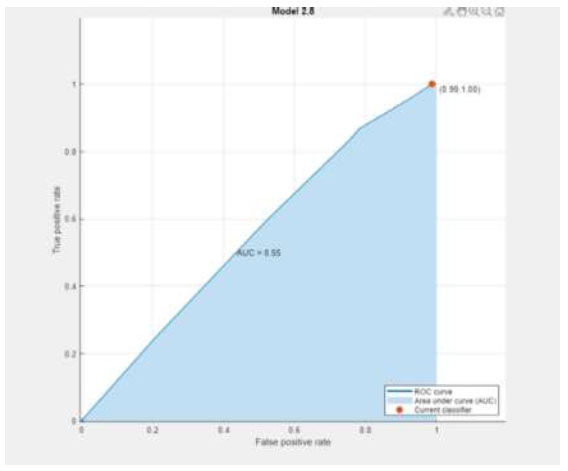
The performance metrics are visualized using Python in Google Colab. Table 3 depicts the confusion matrix and ROC observations obtained from different classifiers. It predicts a class label attribute, ‘Health issue for the student’, “predicted class”, which is compared to the true label in the test dataset. Here, the confusion matrix detects the data of 1021, 1021, 901, 966, 1021, and 1021 as true positives for the six classifiers: K nearest neighbor (KNN), Support Vector Machine (SVM), Neural Network, Quadratic Discriminant Analysis (QDA), Linear Discriminant Analysis (LDA) and Ensemble subspace discriminant method classifier, respectively. Similarly, from the ROC curve, AUC values are obtained, which are 0.55 for KNN, 0.5 for SVM, 0.58 for LDA, and 0.59 for Ensemble. Table 4 shows the statistical values of the confusion matrix for different classifiers.
Table 4 summarizes the evaluation metrics in terms of accuracy, error rate, precision, recall, specificity, and F1-score of the six models. Classification accuracy was above 85% for KNN, SVMEnsemble, and LDA, whereas QDA attained 82.5%; a low accuracy of 78.6% is noted for Neural Network.
CONCLUSION
The proposed ensemble-based classifier uses recursive feature elimination for feature selection and random forest classifier for training and testing data. When compared to traditional classifiers, the proposed ensemble-based classifier outperforms well during the validation process. The classifier model performance was enhanced by improving the classifier using a hyperparameter tuning approach. The performance evaluation was carried out using k-cross validation technique. From the confusion matrix and ROC curve, the performance metrics to be evaluated include accuracy, precision, recall, F1-score, specificity, and error rate. In the future, we will extend the prediction analysis to a heterogeneous ensemble-based classifier model. Moreover, the classifier model can be applied to any other region for finding preventive and remedial measures in the outbreak of disease in the near future.
AUTHOR’S CONTRIBUTION
It is hereby acknowledged that all authors have accepted responsibility for the manuscript's content and consented to its submission. They have meticulously reviewed all results and unanimously approved the final version of the manuscript.
LIST OF ABBREVIATIONS
| COVID-2019 | = Corona Virus Disease |
| DBC | = Density-Based Clustering |
| RFE | = Recursive Feature Elimination |
| WFI | = Weighted Feature Importance |
| ROC | = Receiver Operating Characteristic |
| FPR | = False Positive Rate |
| FP | = False Positives |
| TPR | = True Positive Rate |

