All published articles of this journal are available on ScienceDirect.
Condition Generative Adversarial Network Deep Learning Model for Accurate Segmentation and Volumetric Measurement to Detect Mucormycosis from Lung CT Images
Abstract
Introduction
Mucormycosis (black fungal attack) has recently been identified as a significant threat, specifically to patients who have recovered from coronavirus infection. This fungus enters the body through the nose and first infects the lungs but can affect other body parts, such as the eye and brain, resulting in vision loss and death. Early detection through lung CT scans is crucial for reliable treatment planning and management.
Methods
To combat the above problems, this paper introduces a Condition Generative Adversarial Network Deep Learning Model (CGAN-DLM) to facilitate the automatic lung CT image segmentation process, contributing to accurately identifying Mucormycosis earlier. This deep learning model employed different pre-processing strategies over raw lung CT images for extracting its ground truth values based on potential morphological operations. It adopted CGAN to segment the region of interest used for diagnosing mucormycosis with the pre-processed images and their related truth values.
Results
It also included a volumetric assessment approach that significantly identified the change in lung nodule size before and after the infection of mucormycosis.
Conclusion
The extensive experiments of the proposed CGAN-DLM conducted using lung CT images taken from the LIDC-IDRI database confirmed sensitivity of 98.42%, specificity of 98.86% and dice coefficient index of 97.31%, on par with the benchmarked lung CT images-based Mucormycosis detection approaches.
1. INTRODUCTION
Mucormycosis is considered a rare fungal infection, also known as Zygomycosis. The primary cause of this fungal illness is the mould group known as mucormycetes. This mould has the nature of living in the environment and angio-invasive infection. The seeds of these omnipresent fungi, mainly present in air, compost, soil, fallen leaves, animal dung, etc., are inhaled, infect the sinuses and lungs, and further spread to the eyes and brain. In rare cases, the infection can occur when spores involve the body through an open wound or little scratches in the body. In particular, the disease often affects people with less immunity to fight sickness and bacteria.
Furthermore, it is not transmitted from one individual to another and is not contagious. However, it enters the human body through the nasal part and first infects the lung region. Although current research reports suggest that the disease can affect the eyes and brain, its onset begins in the lungs. Moreover, only when it affects the eyes and brain do we become aware of mucormycosis (Black fungus) symptoms. Hence, the early detection of mucormycosis is possible by examining lung CT images so that treatment planning and management of its infected patients can be attained with the utmost reliability [1].
In this context, an even more significant issue that decision-makers and researchers must address is the massive volume of data, said to be big data, which presents significant hurdles in our detection model. This illustrates the situations in which artificial intelligence may be essential for establishing and raising the standard of healthcare worldwide [2]. Even in fields like health, economics, engineering, and psychology, AI has recently sparked considerable interest and research [3]. As a result, in an emergency like this, medical, logistical, and human resources must be mobilised and saved. AI can not only make this easier, but it may also concentrate on saving time at a time when even one hour saved can save lives in all areas where the Black fungus is killing people. Artificial intelligence (AI), which has recently gained popularity in clinical settings, can be instrumental in lowering the number of unnecessary deletions while also improving efficiency and competitiveness in large-scale research [4]. Higher accuracy in diagnosis and prediction is also desired [5]. The utilisation of big data can help research viral activity modelling in any country. Because of the data, health authorities may better prepare for disease outbreaks and make better decisions [6]. Medical imaging and image processing techniques like AI could improve diagnosis procedures, such as treatment strategies, crisis management, and optimization. However, they have not been used adequately to help healthcare systems fight Black fungus. For instance, image-based medical diagnostics, which can quickly and accurately diagnose black fungus and save lives, can benefit enormously from AI's helpful input. There are several challenges in using computational solutions for accurate segmentation and volumetric measurement to detect mucormycosis from lung CT images: image quality variation, the complexity of mucormycosis lesions, presence of other pathologies, limited annotated data, inter-observer variability, computational complexity and generalization across patient populations. Fig. (1) depicts the challenges associated with the detection of black fungus using AI-based techniques.
Segmentation of medical images is a cumbersome task in medical diagnosis. Recently, an increasing number of researchers have attempted to segment aberrant areas in numerous medical images, such as MRI images, CT images, Ultrasonic images, etc., using learning-based algorithms. Because computed tomography (CT) is required for many medical diagnostics, precise CT picture segmentation is critical in clinical applications. However, due to the significant likeness of grey values in CT scans, effectively segmenting the relevant areas remains difficult. The development of Computed Tomography (CT) technology has led to a massive increase in the amount of data that may be captured during clinical CT. Clinical diagnosis is facilitated by the development of automatic segmentation methods based on computer-assisted diagnosis (CAD). Segmentation of the lung parenchyma is the pre-processing step in processing lung CT images. This step is beneficial in measuring and analysing lung disease, and the pre-processing results directly affect how images will be processed. As a result, the latest work has focused heavily on developing quicker and more accurate segmentation algorithms for lung CT scans, which may have significant medicinal and practical ramifications. For accurate segmenting of the region of interest used for diagnosing Mucormycosis with the pre-processed images, we adopt the Condition Generative Adversarial Network Deep Learning Model (CGAN-DLM). CGAN-DLM performs data augmentation to the training sample to do specific tasks. In this research work, we specifically investigate segmenting lung nodules using CGAN-DLM.
The GAN architecture, which consists of a generator (G) and a discriminator (D), is a generative model that learns features by using a random noise vector (Z) concerning the picture of an output (y). The generator comprises convolutional layers, ReLU layers, the desired range of normalization layers, and the tanh activation layer associated with it. Furthermore, the discriminator layer also comprises a set of convolutional layers, leaky ReLU activation and desired batches of normalization layers based on the given applications. The widely used filter sizes of every transposed convolutional and convolutional layer of pixels are 5 x 5, with the filters for every generative and discriminative layer being 20,10,5, 5, 10, 20, and 40, respectively. Fig. (2) depicts the functional and sequence of layers in the CGAN Deep Learning Model. We utilised CGAN to segment lung nodules accurately by detecting the affecting region of the lungs [7].
Then, the volumetric assessment approach significantly identified the change in lung nodule size before and after the infection of mucormycosis. Volumetric assessment can be actioned by utilising the technique of 3-D VOI-based segmentation, which is done with the help of the region of interest based on 2-D segmentation. Although it has various advantages, 3-D VOI-based segmentation has limitations. For example, it necessitates vast training data and increases the computing cost. Compared with other methods, 2-D ROI-based segmentation takes only a fraction of the time and processing capacity. This makes it a popular alternative. More recent research shows that investigating patch-wise using a 2-D segmentation approach can be used to determine a lung nodule's 3-D volumetric structure [8]. The main contribution of the proposed approach is listed below;
- We utilized a Condition-Generative Adversarial Network Deep Learning Model (CGAN-DLM) to facilitate automatic lung CT image segmentation. This process contributes to the accurate identification of mucormycosis at an earlier stage.
- Then, a volumetric assessment approach was utilised, which significantly identified the change in lung nodule size before and after the infection with Mucormycosis.
- For experimental analysis, the LIDC-IDRI database is utilized, and the performance of the proposed approach is analysed based on the different metrics.
The rest of the paper is organized as follows: section 2 presents a literature survey of the proposed research, section 3 discusses the proposed methodology, section 4 discusses the experimental results of the presented technique, and section 5 gives the conclusion.
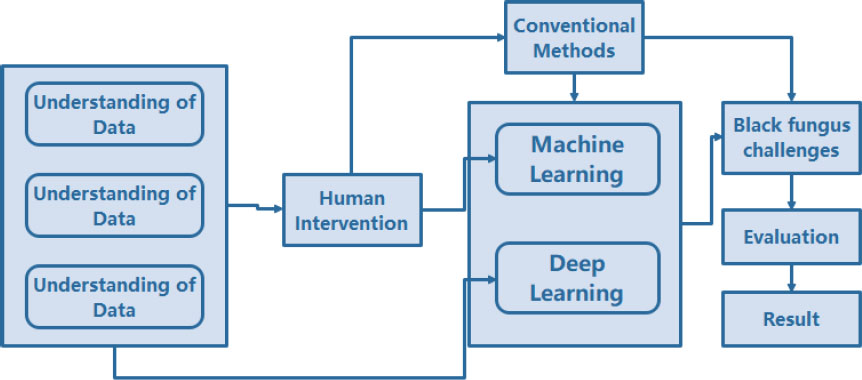
AI-based technique associated with the detection of mucormycosis (black fungal attack).
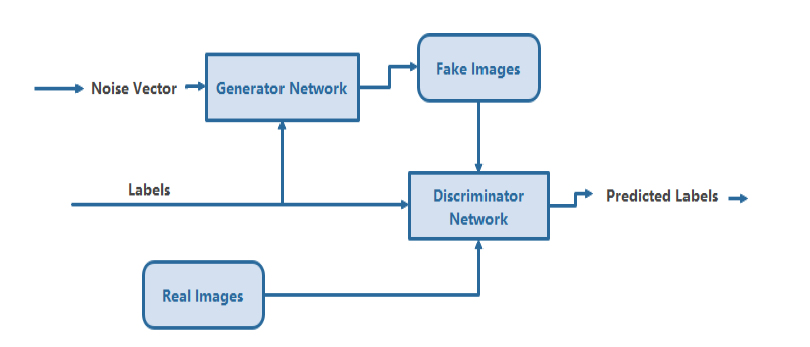
Conditional generative adversarial deep learning model.
2. LITERATURE WORK
As far as most lung segmentation techniques are widely utilised, thresholding [9, 10], expanding the regions [11, 12], transforming the watershed [12, 14], and techniques based on boundary tracking [15, 16] are among the most used ones. The lung segmentation algorithm that is most frequently employed is the threshold segmentation approach. The performance of threshold-based segmentation is quick but unsatisfactory since the bronchus and trachea sections cannot discriminate between the grey values of lung regions. Expanding the region of interest is a straightforward region-based segmentation technique. The interstitial lung can quickly and reliably separate from the surrounding lung tissue while maintaining a transparent border. Nevertheless, growing criteria are parameter-sensitive, while the region-growing technique is highly complicated. A gradient picture of the original image must be on hand to use the boundaries traceability approach.
To a certain extent, border traceability can handle non-closed images of curved borders. However, it is susceptible to the choice of detection point pixels, which could cause the algorithm to take the wrong path and disrupt the traces of images. The main bronchus may be removed, or the left and right lungs may be separated after these treatments. To do this, most lung segmentation techniques today employ hybrid strategies that combine the thresholding method with other data extraction methods and regional growth [15-17]. Than et al. [16] proposed using the Otsu grey-level threshold with filtering based on morphological features as an initial segmentation strategy. Fuzzy connectivity segmentation of images was used by Mansoor et al. Meng and colleagues [18] coupled the updated live-wire model with snake models and contour interpolation to identify the lung outlines [17]. to recover the initial lung parenchyma, a unique neighbouring anatomy-guided associated with extended was employed to fine-tune it.
In addition, numerous studies emphasize the segmentation of pulmonary parenchyma in patients with lung illness. To cope with juxta pleural (lesions next to the ribcage and pulmonary trunk) lung nodules, Pu et al. [19] suggested an automated segmentation of lung strategy, which is based on an adaptive border marching-based 2-D algorithm. Greater under-segmentation was observed in the hilar and respiratory accumulation regions. Sun et al. suggest a robust and active contour model technique to segment lung cancer-ridden sketches significantly [20], followed by an optimized surface-seeking technique to enhance the preliminary segmented lung image. The elasticity and global optimality of the energy function have led to the rapid development of a novel method for picture segmentation in graph theory and the graph cuts algorithm. Graph cuts were introduced by Boykov [21] to achieve globally optimal N-dimensional object segmentation.
As a result, graph cuts have swiftly evolved and are now being used in various research fields. Xu et al. [22] utilised graph cuts and active contours to segment objects. The graph cuts approach was studied by Yang et al. and is utilised to create a detailed depth image for 3D film. Compared to the benchmark technique, the multi-set graph cut model produced better virtual view images [23, 24].In medical image segmentation, the graph cuts approach becomes more acceptable because human involvement can provide some prior information to the graph cuts method. Researchers Sun et al. [25] found that segmenting the lungs in 4D CT scans may be automated using graphs. His presentation comprised a multi-surface (4D) optimal surface discovery framework, picture registration, and a 3D active shape model. Price et al. [26] completed picture segmentation by combining edge and geodesic distance information.
Balagan et al. [27] used graph cuts in PET images to segment lung tumours, and the graph cuts were enhanced using a monotonic SUV downhill feature and a standardised uptake value (SUV) cost function. Lung tumours can be precisely mapped, but it takes a long time [28]. Automated lung segmentation was revolutionised by Ali et al. They employed the graph cuts method to represent the surrounding pixels using a Markov Gibbs random field, and then they used Gaussian and Potts distribution to extend the energy function further. They found that segmentation findings had a high accuracy rate and low optimum energy. However, the findings of that study show that removing the principal bronchi to compute lung volumes also necessitates post-processing. Nakagomi et al. [29] utilised the graph cuts approach to segment the lung with pleural effusion. They increased the graph's segmentation accuracy by incorporating multiple shapes and structural limitations on the graph cuts. However, It takes a long time to compute; each CT volume takes about 15–30 minutes. The paper provides a comprehensive overview of deep learning techniques used in CAD systems for lung cancer detection, covering nodule detection and false positive reduction. It discusses the characteristics and performance of different algorithms and architectures, as well as the available CT lung datasets for research [30-37]
Deep learning allows for the accurate diagnosis of a novel Coronavirus (COVID-19) using CT images” The study describes a deep learning-based CT diagnostic system that uses CT scans to detect COVID-19 patients. With an AUC of 0.95, recall of 0.96, and precision of 0.79, the model distinguished COVID-19 patients from those with bacterial pneumonia. The study emphasises the relevance of CT imaging in rapid COVID-19 diagnosis and the urgent need for precise computer-aided approaches to help doctors. For comparison and modelling, the investigators gathered chest CT images from 88 COVID-19 patients, 100 bacterial pneumonia patients, and 86 healthy persons [31].
This work introduces a fresh, fully annotated dataset of LUS pictures and investigates the use of DL approaches for LUS image interpretation [32]. The authors present a video-level prediction model and a method for predicting segmentation masks for image segmentation utilising an ensemble of different state-of-the-art neural network architectures. The authors suggest a Transformer model that uses positional embeddings, a modified decoder attention mask, and a unique pre-training challenge to accomplish spatiotemporal sequence-to-sequence modelling [33].
To solve these challenges, the authors present a unique hybrid deep learning model called CTransCNN, which consists of three major components: a multilabel multi-head attention enhanced feature module (MMAEF), a multi-branch residual module (MBR), and an information interaction module (IIM) [34] CTransCNN, the proposed hybrid deep learning model, outperformed ten previous medical image classification networks in multilabel classification, as evidenced by AUC scores on the ChestX-ray11 and NIH ChestX-ray14 datasets. On the ChestX-ray11 dataset, the CTransCNN model had the most significant average AUC score of 83.37, outperforming other models [35].
The research offers a multi-cell type and multi-level graph aggregation network (MMGA-Net) for cancer grading that builds numerous cell graphs at different levels to capture intra- and inter-cell type associations and combines global and local cell-to-cell interactions [36].
Although the article suggests integrating a semi-structured EHR system with patient registries makes sense, there are challenges. Despite these challenges, our research found that adopting EHR in a patient registry for illnesses like cancer was beneficial and might save time and cost. We could extend our methodology to other patient registries. Policymakers should support the use of EHR data by registries. This option will improve the data quality of registries and EHRs and the overall goals.
In this section, we analysed several studies and found some flaws. Some are imprecise, some are too complex, some are not reliable, and some are not real-time friendly. Some authors do not extract the features and directly classify the image using a deep learning algorithm, which will affect the segmentation accuracy. Features are essential for the classification process. Therefore, considering these drawbacks, we proposed efficient automatic lung image segmentation.
3. METHOD
3.1. Condition Generative Adversarial Network Deep Learning Model (CGAN-DLM)-based Accurate Identification of mucormycosis
This section presents the systematic steps involved in developing the proposed CGAN-DLM-based accurate identification of mucormycosis from lung CT images. This proposed CGAN-DLM-based Mucormycosis identification is ultimately achieved by exploring lung CT images from which the lesions' existence confirms it. This CGAN-DLM-based Mucormycosis identification scheme is proposed using an Enhanced GAN Classifier (EGLNC) to identify the type and stage of mucormycosis from CT images. Based on deep learning schemes, the propounded system uses the EGLNC framework to build automatic classifiers to support Mucormycosis identification and its type along TNM states. The TNM states that it is a pattern representing the extent and stage of a patient's cancer. T refers to the tumour's dimensions and how far it has disseminated into nearby tissue. T0 indicates no tumour presence, and T1-T4 indicates tumour size and extent.
The T1 is the smallest, and the T4 is the largest and most aggressive.N denotes the amount of nearby cancer lymph nodes. NX means no lymph nodes can be evaluated, and N0 implies no regional lymph node metastasis.M indicates whether cancer has circulated from the original tumour to other body parts. Lastly, a stage organizer is developed to collect outcomes from TNM state categorizers and join them to identify the NSCLC stage by denoting the newest TNM system. The propounded method effectively aids in comprehensive stage categori- zation, similar to the examination done by physicians. It is clear from the results that the proposed approach provides better cancer detection accuracy of roughly 99.2%, along with type and TNM stage categorization accuracy of 96.5% and 90.5%, respectively. The system aids physicians in planning for efficient treatment depending on cell type. The stage forecast aids in carefully observing the patient’s existence period. This effectual GAN-based Fully Automated Categorization Scheme (GFACS), which is simple and time-saving, is needed to diagnose mucor- mycosis. Deep learning performs several image identi- fication tasks efficiently with self-characteristic learning. The following mechanisms are contributed to this work:
a) CGAN-DLM-based Mucormycosis identification framework is designed as a completely automatic Mucormycosis identifier.
b) GAN enables accurate identification of mucormycosis and forecasting its stages after getting the whole set of TNM states, which is different from the existing studies that find the phase from the ‘T’ result.
c) In the 'T' state classifier, the pixel categorization output layer is employed rather than GAN's classification layer, which efficiently identifies the microscopic centimetre variance among the states.
d) Lymph node participation, i.e., the 'N' state forecast system, is developed using deep learning.
e) A novel Metastases (M) state categorization is propounded with 100% accuracy.
The demand for a quicker diagnosis and the disadvantages of the prevailing approaches led to the design of GFACS for identifying Mucormycosis. It helps in forecasting the type and TNM state of mucormycosis. The proposed scheme offers better accuracy, improves treatment preparation by evading delay, and decreases the death rate.
3.2. Proposed Gan based Fully Automated Categorization Scheme Framework
Fig. (3) shows the proposed GAN-based Fully Automated Categorization Scheme (GFACS) architecture for NSCLC. The system covers type and stage classification, preliminary Mucormycosis detection, pre-processing and segmentation, post-processing, and GAN classification.
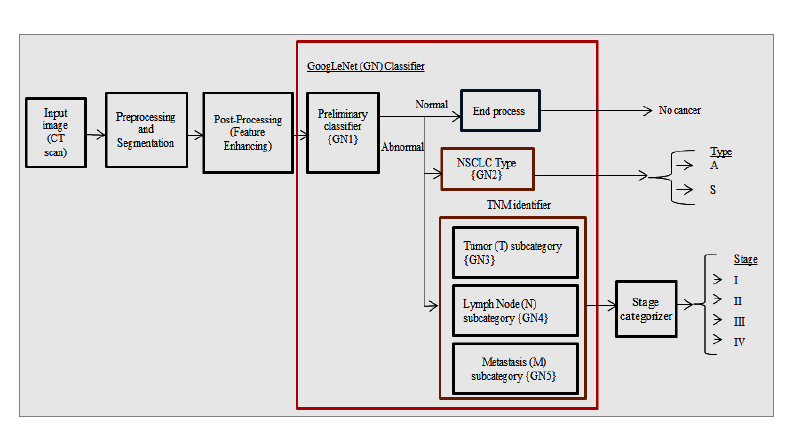
CGAN-DLM-based mucormycosis identification framework.
3.2.1. Mucormycosis CT Images Datasets
The following image datasets are taken into consideration.
3.2.1.1. LIDC-IDRI Dataset
The Lung Image Database Consortium and Image Database Resource Initiative (LIDC-IDRI) includes CT images of 1010 patients in DICOM format (512 x 512). This dataset was used in almost half of the research. Each case includes hundreds of lung images and information on the lesions that four radiologists have decided to be present.
3.2.1.2. NSCLC Radio genomics Dataset
Mucormycosis Radio genomics includes 151 subjects who intend to discover the association between medical image and genomic characteristics and design advanced image prognostic models. Tables 1-3 display the kind of NSCLC, total TNM states, and stage categorization counts taken from the medical dataset.
| Sl.No. | Dataset | No. of Patients | Mucormycosis Adenocarcinoma | Mucormycosis (Squamous Cell Carcinoma) |
|---|---|---|---|---|
| 1 | TCGA-LUAD | 26 | 26 | - |
| 2 | TCGA-LUSC | 36 | - | 36 |
| 3 | NSCLC Radiogenomics | 151 | 116 | 35 |
| 4 | NSCLC-Radiomics-Genomics | 75 | 39 | 36 |
| Sl. No | Dataset | No. of Patients | Stage | ||||||
|---|---|---|---|---|---|---|---|---|---|
| I | II | III | IV | ||||||
| A | B | A | B | A | B | A | |||
| 1 | TCGA-LUAD | 26 | 4 | 5 | 2 | 5 | 8 | 1 | 1 |
| 2 | TCGA-LUSC | 36 | 5 | 9 | 2 | 13 | 6 | - | 1 |
| 3 | NSCLC Radiogenomics | 151 | 14 | 28 | 5 | 22 | 10 | 3 | 5 |
| 4 | NSCLC-Radiomics-Genomics | 75 | 56 | 37 | 2 | 30 | 19 | 2 | 5 |
|
Sl. No. |
Research | Method | Classifier 1 | ||
|---|---|---|---|---|---|
|
Sensitivity/ Recall (%) |
Specificity (%) |
Accuracy (%) |
|||
| 1 | De Carvalho et al., (2018) | CNN | 90.7 | 93.47 | 92.63 |
| 2 | Xie et al. (2018). | DCNN + Adaboost BPNN | 84.19 | 92.02 | 89.53 |
| 3 | Yutong et al., (2019) | MV-KBC + ResNet-50 | - | - | 95.70 |
| 4 | Tulasi et al., (2019) | GAN | - | - | 99 |
| 5 | Lakshmanaprabu et al., (2019) | LDA + ODNN | 94.2 | 96.2 | 94.56 |
| 6 | Proposed method (GAN-1) | Preprocessing + GAN + ReLu | 86.12 | 74.24 | 82.7 |
| PSP + D2 + GAN + ReLu | 100 | 96.66 | 99.2 | ||
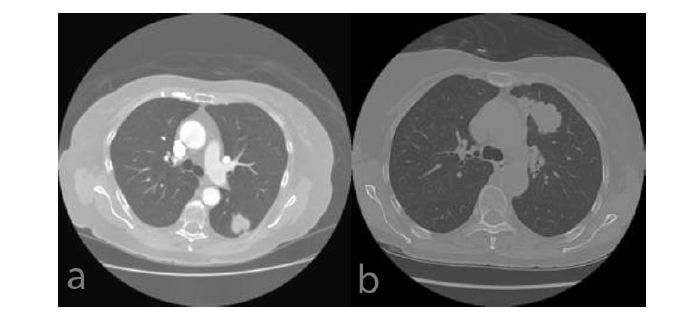
(a) LUAD (b) LUSC.
3.2.1.3. NSCLC-radiomics-genomics
About 75 surgical patients collection includes about 75nformation are included in this from surgical patients. Tables of display of TNM states and stage count extracted from the medical dataset.
3.2.1.4. TCGA-LUAD
The Lung Adenocarcinoma (LUAD) section of The Cancer Genome Atlas (TCGA) contains information on 26 patients and numerous photos. The LUAD image is displayed in Fig. (4a). The patients' information includes the nodule information that the doctor marked as indicated in Tables 1-3.
3.2.1.5. TCGA-LUSC
36 patients' records from the TCGA-Lung Squamous Cell Carcinoma (LUSC) database are included, along with numerous photos. A sample of the LUSC instance is shown in Fig. (4b). Information about the patients' nodules, as noted by the physician and displayed in Tables 1 and 2, is also included.
3.3. Pre-Processing - Segmentation
The Mucormycosis infected nodule is mined from the low-dose CT image. The exact nodule region mining technique improves the classification accuracy. The proposed Automated Multilevel Hybrid Segmentation and Refinement Scheme (AMHSRS) is used in the propounded examination to improve the efficiency of the Mucormycosis classifier. It involves the following steps. Image pre-processing is the first step since getting exact segmentation and categorization results are essential. Initially, RGB colours map the CT image's grey intensities. The B or G components are chosen and made into grayscale images depending on which edge features are preserved. The procedure helps isolate the juxta-pleural and juxta-vascular nodule that contacts the mediastinum region and walls. The Wiener Filter (WF) keeps image structures with edges intact, while the CLAHE approach boosts contrast. The GrowCut (GC) background elimination scheme eradicates frustrating background structures. These steps will offer a well-moderated image of the ensuing step that supports precise Mucormycosis mining.
The ALPM&BR scheme, which includes automatic seed point identification, mining based on region growth, and new border concavity closing techniques to achieve flawless mining that isolates lungs by excluding the surrounding area, is the next step. The CCA and TBMN improvement technique, which removes irrelevant parts such as soft tissues, bone, arteries, fat, etc., is used to mine the Mucormycosis nodules. The segmented nodule region and low dosage input are shown in Fig. (5). The system can operate globally and distinguish between nodules with greater sensitivity, accuracy, and disc similarity coefficient at very low FPs/scans.
3.4. Post-processing [Feature Enhancing and Databases Creation]
The proposed approach uses the GAN deep learning mechanism to achieve deeper classification, such as kinds, TNM states, and stages. It is possible to identify and classify the network-trained segmented nodule area. Squamous cell mucormycosis and adenocarcinoma in addition to shape, carcinoma types are associated with nodule formation in the lung around the pleural area, the mediastinum, and morphological texture form. Patients are given varying amounts of information. To produce accurate results, the segmented picture is post-processed before the classifier is trained rather than directly training the region in the network. The post-processing approach produces a dataset that is acceptable for type and TNM state categorization, which also enhances the character- istics. Algorithm 1 describes this plan in full. Initially, 3 inputs are obtained from the former segmentation, including the original image, lung parenchyma, and segmented nodule regions. Finding the type of mucormycosis is necessary as every kind should be handled exclusively for several amalgamations of treatments. The tumour's location is crucial in identifying its type; in the original image and the database D1, the tumour's outer and inner walls and tumour areas are highlighted with RGB colours. TNM state categorization can be used to stage mycosis. According to the doctor's advice, the primary tumour size can be used to determine the 'T' condition. Algorithm 1 describes the enhancement of the 'T' feature and the development of a database procedure. Tumour sizes T1, T2, T3, and T4 classify the 'T' states. In the second database, D2, tumour areas are displayed in green because there is not much size variation between nearby “T” states in grayscale. The mediastinum area in the original image is stored mainly in the third database, D3, as Mucormycosis infected Nodule (N) participation heavily depends on the region. Similar to physicians, the post-processing approach aids in achieving accurate classification.
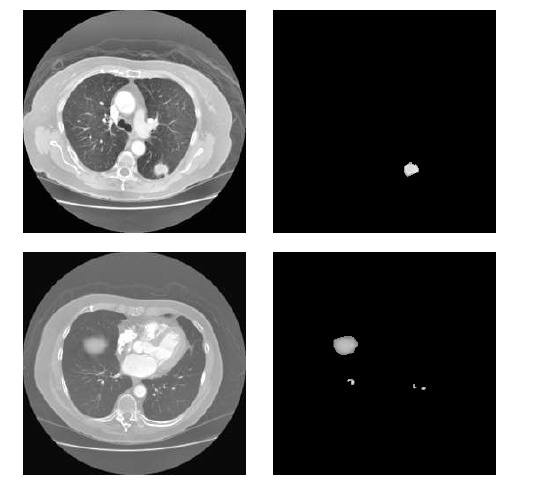
Output of AMHSRS.
Algorithm 1: Feature Improvement and Database Formation
Input: CT image (I), Lung Parenchyma (LP), Segmented Mucormycosis Nodule Area (SegNA)
Output: Databases D1, D2, and D3.
Step 1: Identify the outline of the Mediastinum Region (MReg) from 'LP', i.e., the area between the two lungs.
1. Take A (128,128) as the centre point for the LP image, which is positioned in the mediastinum region owing to the LP structure's nature.
2. To find the exact 'MReg' centre point (a,b) by taking point 'A' as the approximate centre.
a. Determine the indices of the maximum row-wise distance between the inner lungs' wall margins.
b. Determine the indices of the maximum column-wise distance between the inner lungs' wall margins.
c. Determine the known indices' intersection points (a,b) as the 'M_Reg' centre point.
3. Build four quadrants of 90o from point (a,b)
4. In the Ist quadrant:
a. Preserve ‘a’ and decrement ‘b' by one until the first edge is detected and save the indices in variable 'T1’
b. Decrement ‘a' by one and 'b' by one until the first edge is detected, and save indices in variable 'T1.'
c. Disregard the specified index if no edges are found up to a-i==1 or b-1==1.
d. Repeat till ‘a-i’ and ‘b' identify 1 (i.e. edge)
5. In the IInd quadrant:
a. If the value of 'a’ is kept constant, increment ‘b' by '1' until the first edge is detected. Then, save the indices in variable 'T2’.
b. Decrement ‘a' by 1, increment 'b' by one until the first edge is detected, and save indices in variable 'T2’.
c. Ignore the specified index if an edge is not identified until x-i==1 or b+1==256.
d. Repeat till ‘a-i’ and ‘b' identify 1 (i.e. edge)
6. In the IIIrd quadrant
a. If the value of 'a’ is kept constant, increment ‘b' by '1' until the first edge is detected. Then, save the indices in variable 'T3’.
b. Increment ‘a’ by 1, and increment ‘b' by one until the first edge is detected and save indices in variable 'T3’.
c. Ignore the specified index if an edge is not detected until a+i==256 or b+1==256.
d. Repeat till ‘a+i’ and ‘b' identify 1 (i.e. edge)
7. In the IVth quadrant
a. The value of ‘a' is kept constant. Decrement 'b’ by ‘1’ until the first edge is detected. Save indices in variable ‘T4’.
b. Increment ‘a’ by 1, and decrement ‘b' by one until the first edge is detected and save indices in variable 'T4’.
c. If an edge is not located until a+i==256 or b-i==1, disregard the particular index.
d. Repeat till ‘a+i’ and ‘b' identify 1 (i.e. edge)
8. Concatenate T1, T2, T3, and T4, join the line amid neighboring index
Step 2: Map 'M_Reg' to the blue colour M_Regb.
Step 3: The Red Colour (OW_R) is linked to the Outstanding Outer Wall OW=LP-M_Reg.
Step 4: Map 'SegNA' into green colour (
 )
)
Step 5: Build 3 diverse databases (D1, D2, and D3)
1. Fuse O, 'SegNA', wall areas near 'SegNA' must be comprised (
 , OWR) from an image and stored in D1.
2. Save ‘
 ’ in D2.
3. Substitute the area inside '
 ' with 'O' and store it in D3.
3.5. GAN-based Classifier
The GAN framework has been modified considerably compared to AlexNet and ZFNet. In contrast to VGGNet, GAN provides a reduced error rate. The performance has increased by incorporating Inception Modules (IM) in the framework. The IM reduces the computing cost more effectively while maintaining accuracy and speed. In order to drastically reduce the number of parameters, this module performs batch standardization, image modifi- cation, and RMS prop function over inputs using numerous tiny convolution processes. This allows the GAN framework to include 22 deep layers with a reduced number of parameters, which is 4 million, as opposed to other networks with 60 million parameters. A common pre-trained DNN is the GAN, which includes convolutional, max-pooling, average pooling, wholly connected, and Softmax layers with a series of 9 IMs. The inception layer of the GAN consists of sparse and multi-scale information in a block.
The GAN, which offers fewer parameters, faster calculation, and enhanced efficacy, is powered by these 9 IMs. The structure of an Inception module with a dimensionality reduction property is shown in Fig. (6). This framework uses three different size filters for the image (1 x 1, 3 x 3, and 5 x 5) and incorporates the qualities to get superior results. The 1 x 1 convolution layers are introduced into IM to decrease parameter dimensions that attain quick computation. Every layer in GAN acts as a filter. Error back-propagation is used to find and iteratively modify the filter's weights. This method uses the loss of the previous layer to calculate the gradient for the current filter. Due to the primary filter layer's absence of weight adjustment, the gradient vanishing problem typically affects several deeper structures. GAN avoids the gradient vanishing problem by employing a multi-head loss computing block rather than a loss computing block. Auxiliary branches in GAN help to change the weight of the first filter. The top layer mines the common traits, such as edges, colours, and blogs. The final layer mines the high-level characteristics. The configurations enhance GAN's capacity to find the best features expertly. The GAN computes the finest weight while training the network and automatically chooses suitable characteristics.
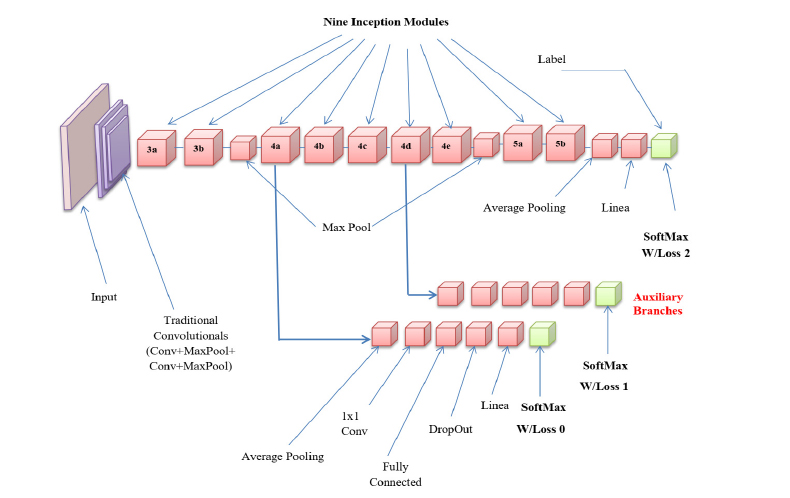
GAN architecture.
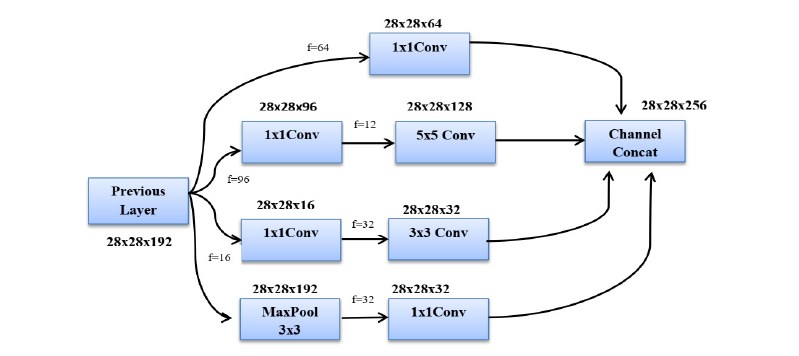
Inception module with dimensionality reduction.
Fig. (7) depicts the conventional GAN structure with three-channel input and output layers and a 224 by 224 image size that can recognize 1000 classes. The convolution block is linked to the ReLu activation function to prevent overfitting, and a dropout block is introduced before the connected layer. A pre-trained GAN is reoriented with four layers to detect lung cancer with the kind and phase, including a dropout layer with a 50% dropout likelihood, wholly connected, SoftMax, and output classification layers.
4. RESULTS AND DISCUSSION
MATLAB 2019a is used to implement the suggested system. The lung CT scan photos are from five different freely accessible datasets. Tables 1 and 2 contain a wealth of information about the quantity of photos and their classification. The database images that were taken are in DICOM format. The slices are changed into Joint Photographic Experts Group (JPEG) images with a resolution of 512 × 512. The dimension is downsized and compressed into 256 × 256 sized pixels for speedier computation and reduced memory usage. The consistent pixel size for a 256 by 256 image size is 1.376 mm, while each pixel length ranges from 1.02 to 1.48 mm. We split the dataset into 60% training, 20% testing, and 20% validation images for detecting Mucormycosis.
The studies conducted to evaluate the GAN classifier's performance in identifying lung cancer and thoroughly classifying CT images are described below. The procedures are shown in Fig. (6). The initial classification (non-cancer and cancer), type classification, and T, N, and M state categorization for the cancer phase forecast all use the GAN classifiers. Thanks to GAN, a pre-trained network, the framework comes with the necessary pre-trained weights. During the network's fine-tuning phase, the weights are updated using the Stochastic Gradient Descent Optimization (SGDO) scheme with a 1e-4 preliminary learning rate. Sensitivity (SN), Specificity (SP), and accuracy are the assessment measures that are used to determine the performance. These parameters are calculated from the values of 'TP', 'FP', 'TN', and 'FN', where 'TP' stands for Mucormycosis tumours recognized as positive, 'TN' for non-mucormycosis identification tumours recognized as negative, 'FP' for incorrectly identified non-cancer tumours, and 'FN' for cancer tumours recognized as negative. SN, SP, and Accuracy gauge the classifier's proficiency and dependability. The values range from 0 to 100, with 0 designating the worst performance and 100 the best performance, respectively. The AUC parameter, whose value ranges from 0 (bad) to 1 (excellent), also reveals the network's ability to classify positive cases appropriately.
 |
(1) |
 |
(2) |
 |
(3) |
 |
(4) |
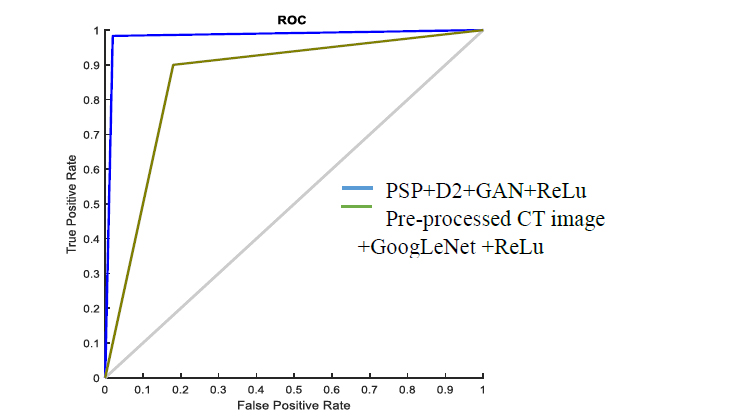
ROC graph for CGAN-DLM-based mucormycosis identification.
4.1. Normal and Abnormal Case Detector (GAN-1)
By examining the primary tumour size, the professionals conduct a preliminary inquiry to distinguish between non-cancer and cancer instances. The global cancer categorization system determines that a tumour is lung cancer if its diameter exceeds 0.5 cm. Using the handled CT images, the proposed GAN (GAN-1) classifier recognizes the cases as though it were an expert. The pre-trained and supervised network used by the classifier is effective in identifying the 1000 object classes. By reorienting the network to recognize cancer using the Deep Learning (DL) toolkit, which is easily accessible in MATLAB, GAN-1 is created. The task, SoftMax, fully connected, and output layers are used as the foundation for constructing the network's last three layers. With binary outputs (normal and abnormal), the classification layer is utilized instead of the output classification layer. The input layer with three colour channels is 224 × 224 x 3. Table 2 displays the results of training and testing the GAN-1 on database D2, which contains 888 images (200 normal and 688 aberrant). Pre-processed, Segmented, and Post-processed (PSP) pictures are used for 30% of the network testing and 70% of the network training.
Fig. (8) displays how the proposed method (PSP + D2 + GAN + ReLu) performed on the ROC graph that displays the diagnostic potential of binary classifiers; the propounded scheme results in an output line (Blue color) close to the top region that specifies superior performance. Additionally, the network is trained using the preprocessed CT image plus GAN plus ReLu. The proposed segmentation and post-processing strategies significantly raise the performance of the classifier. Table 3 shows the network parameters, such as SN, SP, and Accuracy, help compare the proposed technique to other popular DL systems. The propounded scheme offers 100%, 96.66%, and 99.2% better SN, SP and Accuracy than the prevailing methods.
Fig. (9) describes the classification accuracy performance for detecting Mucormycosis using lung CT images. The proposed TNM states-based method efficiently detects mucormycosis from CT lung images. The proposed method attains 99.02% classification accuracy. Likewise, the existing techniques have obtained less accuracy performance than the proposed method.
Fig. (10) shows the sensitivity and specificity performance for detecting Mucormycosis using lung CT images. The proposed method attains 98.8% specificity and 98.42% sensitivity. Likewise, the existing techniques have obtained less sensitivity and specificity performance than the proposed method.
4.2. T State Classifier (GAN-2)
To identify NSCLC cases, the experts refer to the most recent 8th edition lung cancer categorization system provided by the International Association for the Study of Lung Cancer (IASLC). The 'T' states are categorised according to the size of the original tumour. It falls into 5 categories: T0, T1, T2, T3, and T4, where T0 denotes the lack of a primary tumour. Filtering T0 cases involves using the starting classifier (GAN-1). Therefore, T0 in the 'T' state is not considered throughout the classification process. State T1 is used for tumours between 0.5 and 3 cm in size, T2 is further classified into T2a and T2b for tumours between 3 and 4 cm and 5 cm in size, T3 and T4 for tumours larger than 7 cm. When a CT scan shows multiple tumours, the highest “T” class is used. The D1 dataset is divided into 'T' classes and trained with GAN-3 to predict the' T' state. The output layer in GAN-3 is updated with count 5, and the outputs are from a non-binary class. The residual parameters are similar to other GANs, and the Pixel Classification Layer (PCL) is used instead of the traditional Classification Layer (CL). The PCL effectively identifies the minute differences between 'T' states and clusters in particular. Fig. (11) shows the confusion matrix of the ‘T’ state classifier GAN-3 with testing results. Table 3 demonstrates how the proposed system performs better in sensitivity and accuracy than the existing methods. The findings demonstrate that the proposed approach (PSP + D2 + GAN+ ReLu+ PCL) provides superior 'T' state categorization. Fig. (12a-f) represents the segmentation and post-processing of the original image, SegNA, outer and inner lung wall after RGB color map, green color mapped SegNA for D2 database formation, area within inner wall for D3 database formation and feature improved image for D1 database formation respectively.
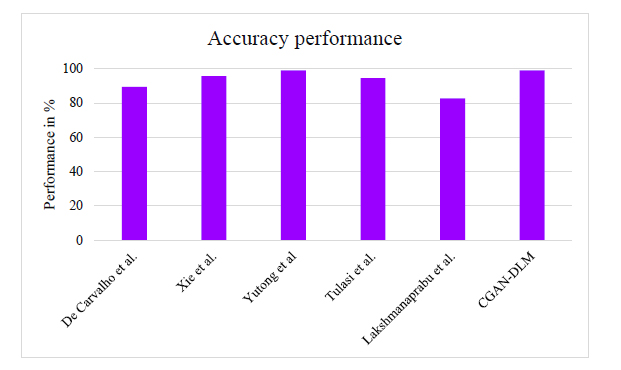
Performance of classification accuracy for detecting mucormycosis.
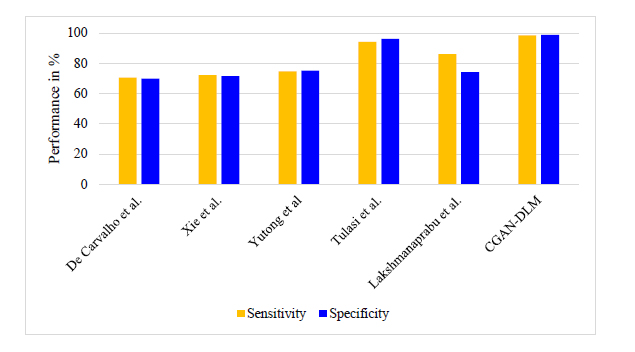
Performance of sensitivity and specificity for detecting mucormycosis.
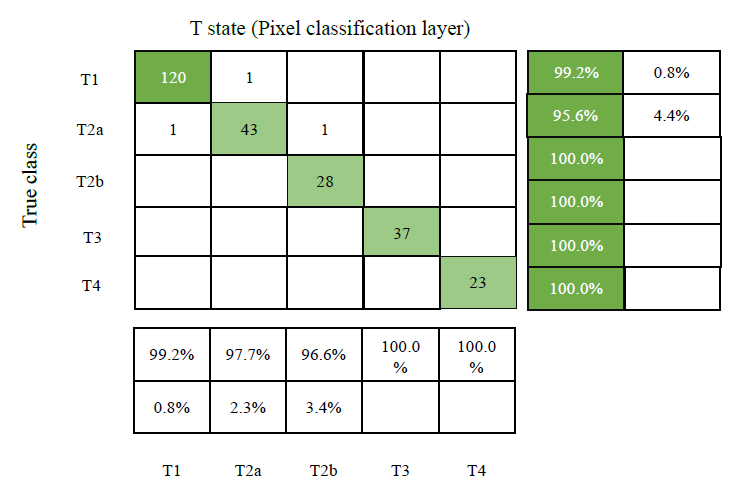
Confusion matrix of ‘T’ state classifier GAN-3 with testing results.
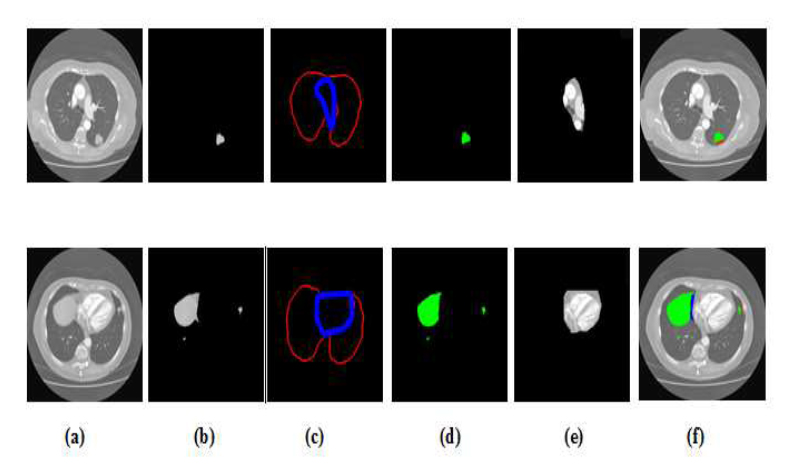
Segmentation and post-processing (a) original image (b) SegNA (c) Outer and inner lung wall after RGB color map (d) Green color mapped SegNA for D2 database formation (e) area within inner wall for D3 database formation (f) feature improved image for D1 database formation.
CONCLUSION AND FUTURE WORK
This paper's CGAN-DLM-based deep learning model facilitated the automatic lung CT image segmentation process and identified mucormycosis at the earlier stage. This deep learning model, the CGAN-DLM-based deep learning model, employed different pre-processing strategies for raw lung CT images and extracted its ground truth values based on potential morphological operations. It adopted CGAN to segment the region of interest used for diagnosing mucormycosis with the pre-processed images and their related truth values. It also included a volumetric assessment approach that significantly identified the change in lung nodule size before and after the infection of mucormycosis. The extensive experiments of the proposed CGAN-DLM conducted using lung CT images taken from the LIDC-IDRI database confirmed sensitivity of 98.42%, specificity of 98.86% and dice coefficient index of 97.31%, on par with the benchmarked lung CT images-based Mucormycosis detection approaches. However, the work has limitations in finding the severity of the mucormycosis infection. Additional modalities, such as PET scans or MRI data, will be integrated to find the severity, providing complementary information for more accurate detection and segmentation. Also, we will incorporate advanced deep learning-based models into clinical decision support systems to assist radiologists and clinicians in diagnosing and monitoring mucormycosis more effectively. Similarly, different deep learning algorithms will classify the different diseases.
AUTHOR'S CONTRIBUTION
It is hereby acknowledged that all authors have accepted responsibility for the manuscript's content and consented to its submission. They have meticulously reviewed all results and unanimously approved the final version of the manuscript.
LIST OF ABBREVIATIONS
| CGAN-DLM | = Condition Generative Adversarial Network Deep Learning Model |
| GFACS | = GAN-based Fully Automated Categorization Scheme |
| LIDC-IDRI | = Lung Image Database Consortium and Image Database Resource Initiative |
| TCGA | = The Cancer Genome Atlas |


