All published articles of this journal are available on ScienceDirect.

Gait Speed Assessment in the 10-meter Walk Test for Older Adults Using a Computer Vision-based System: A Cross-sectional Study on Validity, Reliability, and Usability
Authors Info & Affiliations
Abstract
Background
The 10-meter walk test (10MWT) is a useful field test for gait speed assessment in older adults. However, the conventional 10MWT only provides an overall average gait speed and does not monitor changes in gait speed at specific times. A computer vision-based system is a markerless motion-tracking technology that detects an individual’s instantaneous gait speed, providing valuable insights into gait control.
Objective
This cross-sectional study aimed to investigate: 1) the concurrent validity of a computer vision-based system against a motion analysis system for capturing instantaneous gait speed in the 10MWT; 2) the test-retest reliability of gait speed measures obtained from a computer vision-based system in the 10MWT; and 3) the usability of a computer vision-based system for gait speed assessment during the 10MWT in free-living environments.
Methods
In the validity and reliability testing phase, ten older adults (mean age = 67.50 (6.36) years) participated. Participants performed the 10MWT under two walking conditions: walking at a comfortable speed and walking at maximum speed. For the validity testing, the instantaneous gait speed obtained from a computer vision-based system was compared against that from a motion analysis system. After 30 minutes, the same protocol was repeated to assess the test-retest reliability of a computer vision-based system. The outcome measures were the average instantaneous gait speed for each meter (i.e., meters 0-1, 1-2, 2-3, 3-4, 4-5, and 5-6). In the usability testing phase, six physical therapists (mean age = 26.83 (0.98) years) were asked to test a computer vision-based system for 10MWT assessment in a free-living environment. After completing the test, they were asked to rate the perceived usability of a computer vision-based system using the System Usability Scale (SUS). A Spearman's rank correlation was used to determine a correlation between a computer vision-based system and a motion analysis system, with significance set at P-value < 0.05. An intraclass correlation coefficient (ICCs (3,2)) was used to test the agreement between two repeated sessions of a computer vision-based system. Descriptive statistics were employed to analyze the SUS score.
Results
The average gait speed obtained from a computer vision-based system and a motion analysis system showed high to very high agreement in all meters across two walking conditions, with correlations ranging from 0.70 to 1.00 (P-value < 0.05). The average walking speed measured by a computer vision-based system demonstrated very high repeatability across two sessions for all walking conditions, with ICCs falling between 0.940 and 0.986. The total SUS score for all participants was 75.83 (7.36), suggesting a good perception of the system's usability.
Conclusion
A computer vision-based system is accurate, consistent, and acceptably user-friendly, making it a promising approach for measuring instantaneous gait speed of the 10MWT. However, the proposed system would need to be improved in terms of feasibility for use in community-based settings.
1. INTRODUCTION
As age increases, there is an inevitable gradual degradation in physiological functions, such as sensory, neuromuscular, and cognitive capabilities, leading to a reduction in gait control [1]. Numerous studies have found changes in gait characteristics with age, with a decrease in gait speed appearing to be the most consistently documented finding [2, 3]. Additionally, the reduction in gait speed among older adults has been evidenced to be a predictor of adverse health outcomes, including disability, hospitalization, institutionalization, falls, cognitive deficits, and all-cause mortality [2, 4, 5]. Specifically, gait speed is recognized as the sixth vital sign with the potential to serve as a robust indicator of health and functional status [6]; therefore, it should be an integral part of physical assessments for older people.
Currently, the functional gait speed test for commu- nity-dwelling older people is commonly conducted by measuring the time taken to complete a predetermined distance, which varies across studies from 2 to 500 meters [7, 8]. Among gait speed test protocols, a distance of 10 meters (called the '10-meter walk test') is one of the most commonly used in clinical and research settings, and its excellent validity and reliability across older adults, both with and without health-related conditions, have been established [9-12]. However, a major limitation of the conventional 10-meter walk test (10MWT) using a hand-time stopwatch is that it offers only a global average gait speed and thus does not track changes in gait speed over a specific time. Providing insight into changes in gait speed during walking would enhance our understanding of gait speed adaptation in older adults, potentially yielding meaningful qualitative information on gait control.
To date, high-technology laboratory-based systems such as motion capture and pressure-sensitive walkways have been utilized for the measurement of instantaneous changes in gait speed [13-15]. Although these systems are highly precise, they have some drawbacks involving laboratory restrictions, high costs, and time consumption, and they can affect the naturalness of the motion. Moreover, sensor-based technologies such as Depth motion sensing devices (i.e., Kinect for Xbox 360, Kinect for Xbox One, Azure Kinect DK) [16], inertial sensors (i.e., accelerometers, gyroscopes) [17], and smartphones [18] have been employed to determine gait outcomes, including instan- taneous gait speed, due to their portability, high validity, and affordability [19-21]. However, there are challenges arising from the inconvenient attachment of sensors, variations in sensor specifications as well as estimation algorithms that lead to inconsistent findings [19].
In recent years, considerable effort has been devoted to implementing markerless technology leveraging a computer vision-based system for extracting human motion information [22, 23]. A computer vision-based system offers many advantages, including simple adminis- tration, low cost, and allowing individuals to move naturally due to markerless approaches, which under- scores its potential for characterizing human motion in unrestricted environments.
Despite the prevalent use of computer-based technology for movement analysis [24-26], to the best of our knowledge, there are no studies examining the movement speed of 10MWT using a computer vision-based system. To address this, the present study aimed to: (1) determine the validity of a computer vision-based system compared to gold standard motion analysis methods for assessing gait speed in the 10MWT, (2) examine the test-retest reliability for tracking 10MWT gait speed in older adults, and (3) establish the usability of a computer vision-based system for assessing 10MWT gait speed in community-based settings. Upon establishing the validity, reliability, and usability of the developed computer vision-based system, it could serve as a potential tool for measuring changes in 10MWT gait speed, thereby enabling practitioners to gain qualitative insights into gait control in older adults.
2. MATERIALS AND METHODS
2.1. Research Design and Participants
This study is a cross-sectional study comprising two phases: (1) assessing the validity and reliability of a computer vision-based system for the 10MWT in a laboratory environment, and (2) evaluating its usability in free-living conditions. The developer of the computer vision-based system was a computer programmer with 20 years of experience in developing codebases for computer software. The usability guidelines employed in the design of the system emphasized user-friendly features, including simple setup, operation, administration, and data manage- ment, as well as the device's portability to facilitate its use in community settings.
For the validity and reliability testing phase, ten older adults living in the community were recruited from community groups and social media advertisements. Eligible participants met inclusion criteria by (1) being aged 60 years or older, (2) being able to walk independently without assistive devices for at least 10 meters, and (3) being able to comprehend and follow the instructions. Exclusion criteria included: (1) having a major cognitive impairment (Mental State Examination T10; MSET10 < 23 or depending on the level of education) [27], (2) having been diagnosed with neuromuscular diseases (e.g., Parkinson’s disease, dementia, stroke, and multiple sclerosis) and active uncontrolled health problems (e.g., acute painful joint pain, uncorrected visual or hearing impairments, and hypertension) that affect gait performance and safety during testing, and (3) current use of sedative or antipsychotic medications. In the usability testing phase, six physical therapists, who represent the end users of a computer vision-based system for 10MWT assessment, were included. Physical therapists were enrolled if they worked in a service setting that provides care for older adults, such as clinics, senior care centers, or community healthcare facilities. This study was conducted in accordance with the Declaration of Helsinki and was approved by the Human Ethical Review Board of the primary investigator’s institution (approval number: AMSEC-65EX-078). All participants provided written informed consent prior to the commencement of the study. The recruitment and exposure periods for this study were conducted from November 30, 2022, to November 20, 2023.
2.2. Experimental Procedure
2.2.1. Phase 1: Validity and Reliability Testing Phase
Older adult participants were interviewed about their demographic and health-related information, such as age, weight, height, medical conditions, regular medications taken, and any history of falls within the past year. For validity testing protocol, participants were required to wear a mocap suit along with their regular footwear. The four reflective markers, each with a diameter of 2.0 centimeters, were bilaterally positioned onto specific bony landmarks of the participants, including the anterior superior iliac spines (ASIS) and posterior superior iliac spines (PSIS). These markers were utilized to calculate the center of mass (COM) for each participant, representing the overall movement speed of the entire body [26, 28].
Afterward, participants underwent the 10MWT testing on a 10-meter flat surface walkway in the motion capture laboratory room. The starting point, ending point, and points 2 meters and 8 meters along the paths were marked on the floor, with a 6-meter segment in the middle used for analyzing gait speed. Participants performed the 10MWT in two walking conditions, including 1) walking at a comfortable speed for two rounds, and 2) walking at a maximum speed for two rounds, with a 1-minute rest period between rounds. Comfortable walking speed was defined as the pace at which participants preferred to walk comfortably. Maximum walking speed was defined as the fastest pace at which participants could walk safely without transitioning into a run. One practice trial was allowed for familiarization with the test. During data collection, the 10MWT was administered by one expert in motion analysis and two assessors (physical therapists), who were the same individuals throughout the study. To determine the validity of a computer vision-based system compared to a 3-dimensional motion analysis system, gait speed was simultaneously obtained from both systems during the execution of the 10MWT in each trial. A 3-dimensional motion analysis system, a gold standard tool, equipped with ten Eagle-4 infrared cameras (Motion Analysis®, Motion Analysis Corporation, Santa Rosa, California, USA), and EVaRT 5.0 software were used to quantify instantaneous changes in gait speed during the 10MWT assessment. The sampling rate of the motion capture was set at 60 Hz and filtered using a fourth-order, low-pass Butterworth filter with a cutoff frequency of 6 Hz. Regarding a computer vision-based system, a standard video camera (SONY Mirrorless SLR α 5100, Sony, Japan) was utilized to record gait speed. The camera was set 1.0-meter height from the ground and positioned 5 meters away from the midpoint of the walkway and perpendicular to the participants' movement plane. The video camera was recorded at a rate of 60 Hz and had a resolution of 1280 × 720 pixels in MOV format. The starting events of the two systems were synchronized using an audiovisual synchronization box (patent number: 16706). The experimental setup of the 10MWT is shown in Fig. (1).
For assessing the test-retest reliability of a computer vision-based system, the system was reset by the same assessors using the settings established during the validity testing (session 1) and after a 30-minute interval (session 2). Participants were asked to perform a retest of the 10MWT at both their comfortable and maximum speeds, with two rounds conducted for each condition. During a 30-minute period, participants were requested to rest in order to mitigate the potential effects of fatigue. The assessment during the first and second sessions was conducted by the same assessors.
The processing method of our developed computer vision-based system was divided into six steps as follows (Fig. 2):
2.2.1.1. Step 1: Calibration of the Capture Volume
Two markers, labeled M1 and M2, were placed 6 meters apart along the walkway to measure the entire distance of the capture volume (Fig. 2a).
2.2.1.2. Step 2: Input Video
The standard camera was mounted on a tripod at a height of around 1.0 meters from the ground for video capture. The recordings were made in MOV format, with a resolution of 1280×720 pixels and a frame rate of 60 Hz (Fig. 2b).
2.2.1.3. Step 3: Image Processing
The video file was split for frame extraction, and then the body of the human in each frame was detected using the background subtract technique. The subtraction value of each pixel was used to define the foreground (i.e., large subtraction value) and the background (small subtraction value). Besides, to decrease the noise of the foreground image, the noise was diminished using a two-dimensional median filter (5×5 adjacent pixels). The BLOB Analysis Bounding Box was employed to pinpoint the location of the human body [28, 29]. Finally, the geometric centroid position was labeled to calculate the COM in both horizontal and vertical directions using a two-dimensional lamina [28-30] (Fig. 2c).
2.2.1.4. Step 4: Identification of the Body Position
Each frame of the human body’s geometric centroid position (Position(x, y)) was calculated with the calibrated values of both the endpoint (M1) and starting point (M2). The horizontal direction (Position(x)) was used for tracking the body position (Fig. 2d).
2.2.1.5. Step 5: Feature Tracking of the Human Speed
The system collected the position of COM in array format within the geometric coordinate system. This data was then utilized to compute the instantaneous speed for each frame. The system operated with four frames for each instance (DurationTime = 4). The speed value (Speedindex) of the human formula is given below (Eq. 1):
 |
(1) |
Where, ∆xindex as the difference in distance between index and index + 4, and also ∆tindex as the difference of time between index and index + 4 (Fig. 2e).
2.2.1.6. Step 6: Estimation of the Human Speed
The gait speed during participants' performance of the 10MWT was segmented into the following meter intervals: 0 to 1, 1 to 2, 2 to 3, 3 to 4, 4 to 5, and 5 to 6. The relation of speed and distance was presented in the line graph (Fig. 2f).
The geometric centroid position of each participant's body during walking was quantified. This data was then converted into the instantaneous gait speed using a MATLAB (2015a) script and the Computer Vision and Image Processing Toolbox. A Windows 10 laptop featuring an Intel Core i5-8265U CPU @ 1.60 GHz, a 2 GB NVIDIA graphics card, and 8 GB of DDR4 RAM (manufactured by ASUSTek Computer Inc., Taipei, Taiwan) was used for data computation. The output from a computer vision-based system was an individual’s instantaneous gait speed for each meter segment, including meters 0-1, 1-2, 2-3, 3-4, 4-5, and 5-6.
2.2.2. Phase 2: Usability Testing Phase
During this phase, our developed computer vision-based system was deployed to physical therapists, the representative target users, to evaluate its usability in a community-based setting at their workplace. Physical therapists were asked to provide general information, including their age, duration of working as a physical therapist, as well as their proficiency in using basic technology and computer programs, rated on a 5-point Likert scale (5 = excellent, 4 = good, 3 = fair, 2 = poor, 1 = very poor). Afterward, researchers demonstrated the step-by-step setup of computer vision-based system equipment and installation of the application software using a notebook, and the analysis of gait speed results. Subsequently, physical therapists were required to utilize the system under supervision until they achieved proficiency in independent operation. To test the usability of our developed system, physical therapists were given hands-on experience in setting up a computer vision-based system, preparing subjects, administering the 10MWT according to the standard protocol in convenient free-living environments, and analyzing and interpreting gait speed outcomes. The depiction of physical therapists during the testing of the developed computer vision-based system is illustrated in Fig. (3).
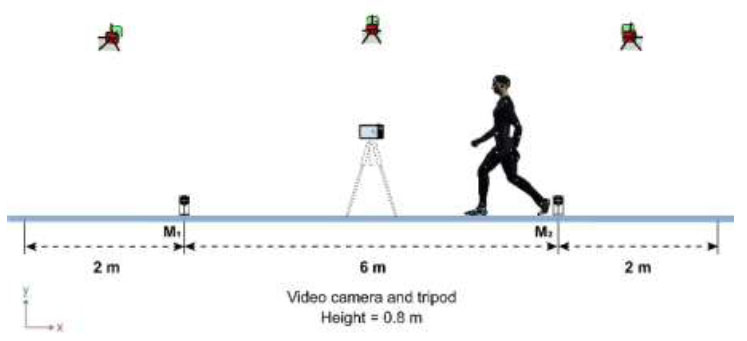
Experimental setup for the 10MWT assessment to test the validity and reliability of a computer vision-based system [26].
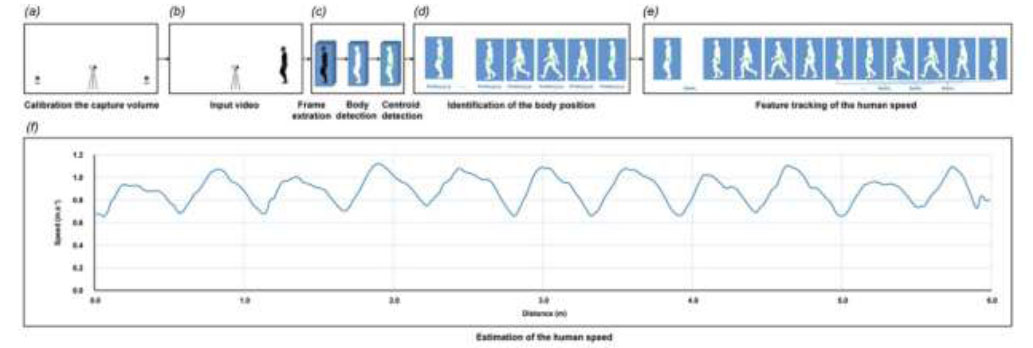
The steps of a computer vision system setup and data processing for computing the instantaneous gait speed in the 10MWT.
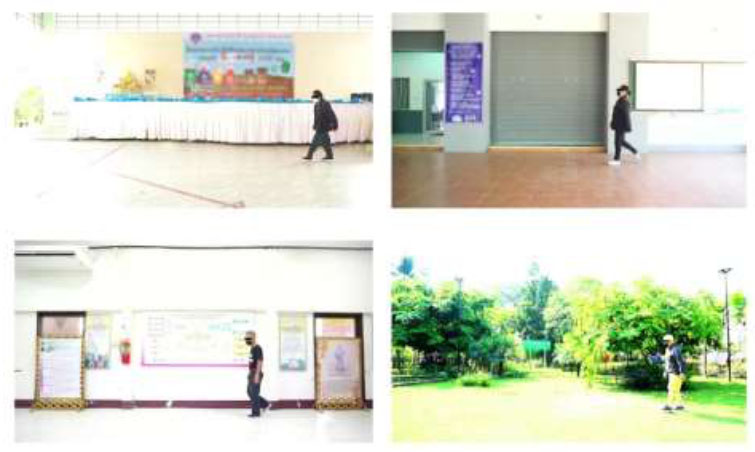
Example of a physical therapist engaging in the usability testing of a computer vision-based system.
After completing the 10MWT testing, physical therapists were requested to rate the system’s usability using a 5-point Likert scale of the System Usability Scale (SUS), where 5 = strongly agree, 4 = agree, 3 = not sure, 2 = disagree, and 1 = strongly disagree [30]. The question items are as follows:
1. I think that I would like to use this system frequently.
2. I found the system unnecessarily complex.
3. I thought the system was easy to use.
4. I think that I would need the support of a technical person to be able to use this system.
5. I found the various functions in this system were well integrated.
6. I thought there was too much inconsistency in this system.
7. I would imagine that most people would learn to use this system very quickly.
9. I found the system very cumbersome to use.
9. I felt very confident using the system.
10. I needed to learn a lot of things before I could get going with this system.
The SUS rating scale was employed to calculate both the total score of all participants and the total score of each question and participant, with scores ranging from 0 to 100. A higher score indicates a greater perceived ease of using the system. A total score of SUS above 68 is designated above average (good), and above 85 is considered excellent [31]. Furthermore, physical thera- pists were interviewed about their perceptions and satisfaction with a computer vision-based system through probe questions.
2.3. Statistical Analysis
Statistical analyses were performed using SPSS Windows, version 21 (IBM Corporation, Chicago, IL). Descriptive statistics (mean and standard deviation) were calculated for the demographic data of the participants and the total score of the SUS. The concurrent validity, defined as the agreement between a computer vision-based system and a motion analysis system, was determined using Spearman's rank correlation (r) with statistical significance set at p < 0.05. The relative agreement between the two systems was interpreted as follows: r < 0.50 indicates low agreement, r = 0.50 to 0.69 indicates moderate agreement, r = 0.70 to 0.89 indicates high agreement, and r > 0.90 indicates very high agreement [32]. The test-retest reliability of a computer vision-based system across two repeated sessions was employed using intraclass correlation coefficients (ICCs (3,2)) and the corresponding 95% confidence intervals (CIs). The ICCs is characterized as follows: ICCs values < 0.50 are indicative of poor reliability, those ranging from 0.50 to 0.69 represent moderate reliability, those from 0.70 to 0.89 represent good reliability, and values ≥ 0.90 are classified as excellent reliability [33].
3. RESULTS
3.1. Phase 1: Validity and Reliability Testing Phase
3.1.1. Participant Characteristics
Ten older adults, consisting of 3 males and 7 females, with an average age of 67.50 (6.36) years, participated in the validity and reliability study. All participants were community-dwelling older adults. The demographic characteristics of the participants are presented in Table 1.
| Demographic Variables | Minimum | Maximum | Mean (SD) |
|---|---|---|---|
| Age (yrs) | 60.00 | 76.00 | 67.50 (6.36) |
| Height (cm) | 145.00 | 176.00 | 159.00 (10.37) |
| Weight (kg) | 52.00 | 74.00 | 62.54 (6.15) |
| BMI (kg.m-2) | 20.98 | 26.84 | 24.94 (1.84) |
| Medications (number) | 0 | 4 | - |
| Falls in the past 12 months (number) | 0 | 2 | - |
| MSET10 (score, range = 0 - 29) | 22.00 | 29.00 | 25.40 (2.01) |
| Meter | Walking Conditions | |||||||
|---|---|---|---|---|---|---|---|---|
| Comfortable Gait Speed (m.s-1) | Maximum Gait Speed (m.s-1) | |||||||
| Motion | Computer Vision | r | P-value | Motion | Computer Vision | r | P-value | |
| Mean (SD) | Mean (SD) | - | - | Mean (SD) | Mean (SD) | - | - | |
| 0 to 1 | 1.18 (0.21) | 1.03 (0.16) | 0.79 | 0.006** | 1.44 (0.21) | 1.29 (0.17) | 0.91 | <0.001** |
| 1 to 2 | 1.17(0.20) | 1.06 (0.18) | 0.95 | <0.001** | 1.48 (0.20) | 1.35 (0.20) | 1.00 | 0.001** |
| 2 to 3 | 1.19 (0.19) | 1.08 (0.19) | 0.99 | <0.001** | 1.50 (0.22) | 1.35 (0.18) | 0.91 | <0.001** |
| 3 to 4 | 1.22 (0.19) | 1.10 (0.18) | 0.95 | <0.001** | 1.55 (0.23) | 1.41 (0.22) | 0.98 | <0.001** |
| 4 to 5 | 1.22 (0.21) | 1.10 (0.17) | 0.95 | <0.001** | 1.57 (0.24) | 1.40 (0.19) | 0.87 | 0.001** |
| 5 to 6 | 1.14 (0.21) | 1.12 (0.19) | 0.70 | 0.025* | 1.49 (0.19) | 1.40 (0.20) | 0.93 | <0.001** |
Spearman's rank correlation (r). *P-value < 0.05, **P-value < 0.01.
3.1.2. Concurrent Validity of a Computer Vision-based System
The average instantaneous gait speed between the two systems exhibited significantly high to very high agreement at every distance (i.e., meters 0-1, 1-2, 2-3, 3-4, 4-5, and 5-6) in both walking conditions. Specifically, in the comfortable speed condition, the correlation between the two systems ranged from 0.70 to 0.99 in which the lowest correlation was identified at meters 5 to 6 (r = 0.70, P-value = 0.025), while the highest correlation was observed at meters 2 to 3 (r = 0.99, P-value < 0.001). In relation to the maximum gait speed condition, the range fell between 0.87 and 1.00. The minimum correlation was observed at meters 4 to 5 (r = 0.87, P-value = 0.001), while the maximum correlation was observed at meters 1 to 2 (r = 1.00, P-value < 0.001). The concurrent validity of a computer vision-based system for measuring gait speed in the 10MWT is presented in Table 2.
3.1.3. Test-retest Reliability of a Computer Vision-based System
As for the comfortable speed condition, a computer vision-based system showed excellent repeatability across every meter, with ICCs ranging from 0.953 to 0.986. Likewise, the system demonstrated excellent reliability at each meter in the maximum speed condition with all ICCs falling between 0.940 and 0.980. The ICCs for gait speed measurements using a computer vision-based system during two repeated sessions are illustrated in Table 3.
3.2. Phase 1: Usability Testing Phase
3.2.1. Participant Characteristics
Participants were six physical therapists (3 males and 3 females) with a mean age of 26.83 (0.98) years. Their workplace was a health care community center and physical therapy clinic. The proficiency level in using basic technology and computer programs was rated between 3 and 5, indicating a fair to excellent level. The physical therapist’s demographic information is shown in Table 4.
3.2.2. Usability and Satisfaction of a Computer Vision-based System
The total SUS score for all participants was 75.83 (7.36), indicating that they perceived the usability of the developed computer vision-based system as good. Notably, the lowest SUS score was 67.50 (participant number 1), while the highest was 87.50 (participant number 2), designating a range from marginal good to excellent ratings. Additionally, the average SUS score for each question varied from 54.17 (question item 4) to 87.50 (question items 7 and 8), indicating a range of adjectives associated with raw SUS score ratings from OK to excellent. The overall results of the SUS score are depicted in Fig. (4).
| Meter | Walking Conditions | |||||||
|---|---|---|---|---|---|---|---|---|
| Comfortable Gait Speed (m.s-1) | Maximum Gait Speed (m.s-1) | |||||||
|
Session 1 Mean (SD) |
Session 2 Mean (SD) |
ICCs 3,2 (95% CIs) |
P-value |
Session 1 Mean (SD) |
Session 2 Mean (SD) |
ICCs 3,2 (95% CIs) |
P-value | |
| 0 to 1 | 1.03 (0.16) | 1.05 (0.22) | 0.953 (0.810-0.988) |
<0.001* | 1.29 (0.17) | 1.25 (0.19) | 0.970 (0.887-0.992) |
<0.001* |
| 1 to 2 | 1.06 (0.18) | 1.07 (0.21) | 0.976 (0.904-0.994) |
<0.001* | 1.35 (0.20) | 1.30 (0.18) | 0.980 (0.920-0.995) |
<0.001* |
| 2 to 3 | 1.08 (0.19) | 1.09 (0.21) | 0.986 (0.904-0.994) |
<0.001* | 1.35 (0.18) | 1.33 (0.18) | 0.961 (0.844-0.990) |
<0.001* |
| 3 to 4 | 1.10 (0.18) | 1.12 (0.20) | 0.980 (0.921-0.995) |
<0.001* | 1.41 (0.22) | 1.36 (0.21) | 0.963 (0.852-0.991) |
<0.001* |
| 4 to 5 | 1.10 (0.17) | 1.14 (0.21) | 0.966 (0.865-0.992) |
<0.001* | 1.40 (0.19) | 1.36 (0.20) | 0.940 (0.758-0.985) |
<0.001* |
| 5 to 6 | 1.12 (0.19) | 1.02 (0.18) | 0.980 (0.919-0.995) |
<0.001* | 1.40 (0.20) | 1.20 (0.17) | 0.962 (0.847-0.991) |
<0.001* |
| Demographic Variables | Minimum | Maximum | Mean (SD) |
|---|---|---|---|
| Age (yrs) | 26.00 | 28.00 | 26.83 (0.98) |
| Duration of working (yrs) | 1.00 | 5.00 | 3.17 (1.72) |
| Proficiency in using basic technology (Likert scale 0 - 5) |
3.00 | 5.00 | 3.83 (0.98) |
| Proficiency in using basic computer programs (Likert scale 0 - 5) | 3.00 | 5.00 | 3.83 (0.75) |
After participants administered the 10MWT and tested a computer vision-based system, probe question about the advantages and disadvantages of the system were conducted as follows:
Positive feedback regarding the advantages of the system:
1. It helps to reduce the time needed to calculate walking speed. It is also great for evaluating how someone walks, which helps tailor exercise plans to their needs.
2. I feel satisfied with this system because it utilizes simple technology to accurately measure walking speed, which reflects the global physical performance of older people.
3. It relies on simple devices, making it convenient to carry and easy to use.
4. It would be possible to effectively apply the system within the community, as they are reasonably priced and highly reliable.
5. For those who are not proficient in using technological devices, they can still use them easily after a short training period.
Negative feedback regarding the disadvantages of the system:
1. The system requires specific training in data analysis before it can be used independently.
2. The data processing of the system requires a relatively plain background to ensure output accuracy. Thus, the assessor must be concerned about the locations of data collection.
All feedback and comments from participants were documented to improve a computer vision-based system before advancing to further research.
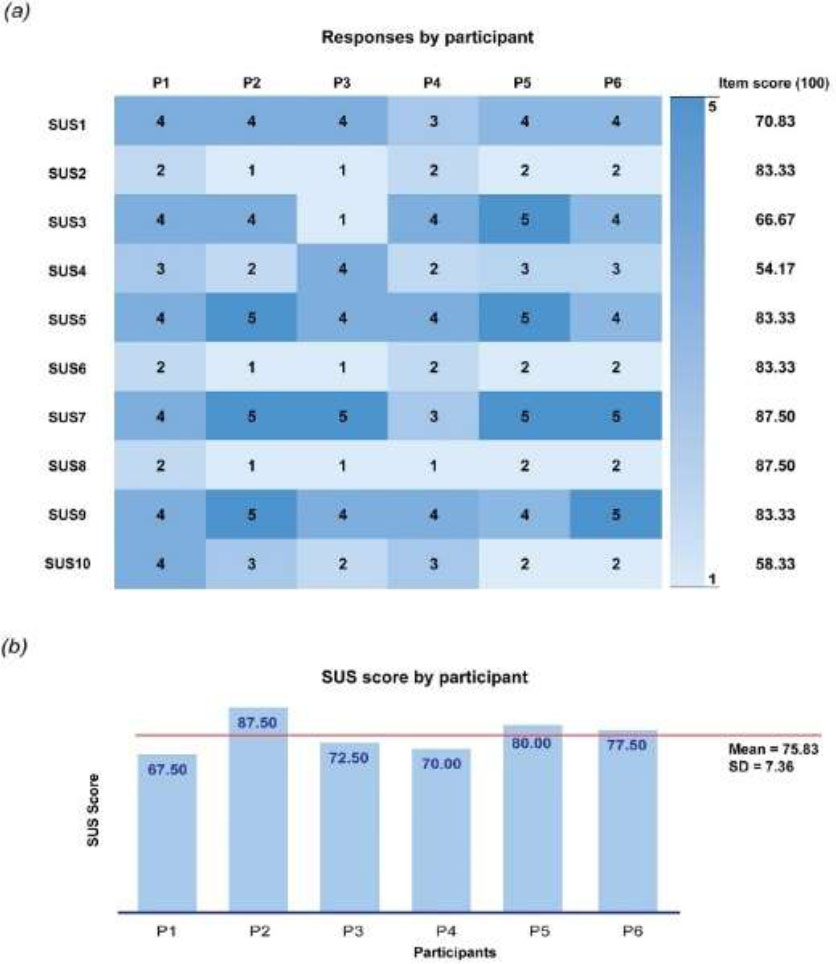
The usability results of a computer vision-based system using the SUS questionnaire (a) The SUS score for each of the questions, (b) The SUS score of six participants, with one rating it as ‘OK’, four ratings it as ‘good’, and one rating it as ‘excellent’.
4. DISCUSSION
The present study aimed to develop and evaluate the concurrent validity, test-retest reliability, and usability of a newly developed computer vision-based system for measuring gait speed in the 10MWT within a community-based setting. The findings from this study demonstrate that a computer vision-based system was highly valid and reliable for tracking instantaneous gait speed during the execution of the 10MWT. Additionally, the system was relatively usable for practitioners in a free-living environment. The feedback also indicated potential future applications in community settings.
Regarding the validity testing, a computer vision-based system showed high to very high accuracy in evaluating gait speed during the 10MWT compared to a motion analysis system, which is considered the gold standard method, across both comfortable and maximum speed conditions. In the present study, the average gait speed at each meter from the two systems was computed based on multiple instantaneous speed values (a computer vision-based system using 15 to 25 instantaneous speed values versus a motion analysis system using 65 to 120 instantaneous speed values). It is possible that gait speed can be calculated from the movement of an individual’s centroid position (representing the COM of the whole body) in a single plane (horizontal direction), resulting in comparable data obtained from two-dimensional analysis using a video-based system and three-dimensional analysis using the motion analysis system. Furthermore, a computer vision-based system is unaffected by lens distortion when walking forward along the horizontal plane calibration line (z-axis) and within the field of view of a two-dimensional camera, thereby enhancing its validity compared to standard instruments. Our results are consistent with prior findings, suggesting that a conventional video-based system demonstrates very high accuracy compared to a motion analysis system in evaluating gait speeds during straightforward walking over short distances and during the walking subtask of the Timed Up and Go (TUG) test among older adults [26, 34, 35]. As for the test-retest reliability testing, a computer vision-based system demonstrated excellent repeatability across every meter at both comfortable and maximum walking speeds. We postulated that the highly repeated measurements of the system may be attributed to several factors, including testing conditions, examiners, participants, and system characteristics. For the testing condition, in the present study, the 10MWT was conducted within a controlled laboratory environment that was devoid of external distractions, such as noise, light, and objects, which could potentially affect participants’ concentration and video background quality. Another factor is the consistency of examiners in system setup and operation as well as the test administration and instruction. All examiners in the study were trained and responsible for the same role throughout the test, which may result in high repeatability of the outcome measures. An additional aspect pertains to the stability of the participants. Participants in our study were older adults with well-functioning and intact cognitive function; therefore, they were able to perform the testing task and follow the instructions. The last aspect pertains to the system characteristics of a computer vision-based system. The system prototype was developed using image-processing techniques and was designed by computer science experts to be user-friendly. In addition, the post-processing of gait speed data was a semi-automated process using a MATLAB program, resulting in the stability of the outcome measurement. Our finding is consistent with that of a previous study and supports the proposition that a simple video-based system exhibited good to excellent reproducibility of subtask movement speeds of TUG among healthy older adults [26].
In addition to the valid and reliable properties of the developed system, the usability of a computer vision-based system is a crucial consideration for its delivery to the target group. A representative of end-users (physical therapists) from a healthcare community center and a physical therapy clinic was included to utilize the developed system for testing the 10MWT at their workplace. Participants responded positively to the system’s usability, as evidenced by the average total SUS score from all participants and provided positive feedback after testing the developed system. When considering the SUS score for each item and participant feedback, the high satisfaction with the developed system may be attributed to its fundamental aspects, including the use of simple technology devices (utilizing only a video camera and portable computer) and the uncomplicated system setup. Additionally, participants perceived the system’s benefits and feasibility in clinical practice. The present findings are supported by prior research, which suggests that the acceptance of technology depends on the perceived ease of use and the perceived usefulness of the technology [36]. Nevertheless, some responses, as indicated by the SUS score (items 4 and 10) and the feedback, highlight that the developed system requires technical support, particularly in the process of data analysis before it can be used independently. Furthermore, for future implementation of this system, practitioners must prioritize privacy protection by ensuring that video recordings are anonymized, securely stored, and accessible only to authorized personnel to maintain confidentiality.
5. LIMITATIONS OF THE STUDY
Based on our current understanding, this is the first study that develops a computer vision-based system, a markerless technology, and determines its validity, reliability, and usability for testing the 10MWT. However, the system has some limitations regarding its usability that need to be addressed. Our developed system is a semi-automatic method that requires manual calibration and manual input for the post-processing step. Additionally, the system is currently unable to generalize across various settings due to its reliance on a relatively plain background. Therefore, further research should focus on developing a deep learning-based object detection algorithm to automate the system and resolve the background issues [37-39]. Apart from the issue of system usability, the sample size was relatively small; thus, further research with larger sample sizes is needed to validate these findings.
CONCLUSION
The present study demonstrated that a computer vision-based system exhibited high to very high concurrent validity and very high test-retest reliability in measuring instantaneous gait speed during the execution of the 10MWT at both comfortable and maximum speeds. The perceived usability of the system was good. Therefore, the developed computer vision-based system could serve as a potential tool for gait speed measurement in the 10MWT, allowing practitioners to gain qualitative insights into the gait control of older adults.
AUTHORS' CONTRIBUTION
B.S., P.P, A.K., M.C., T.C., and K.T.: Contributed to the study's conception and design, data collection, data analysis, and the approval of the final manuscript for publication; B.S.: Made substantial contributions to research planning, material preparation, data analysis, result interpretation, and manuscript drafting; K.T.: Responsible for the development of the software program, research planning, data analysis, manuscript drafting, and reviewing the final manuscript.
LIST OF ABBREVIATIONS
| 10MWT | = 10-meter walk test |
| ASIS | = Anterior superior iliac spines |
| BMI | = Body mass index |
| COM | = Center of mass |
| ICCs | = Intraclass correlation coefficients |
| MSET10 | = Mental State Examination T10 |
| PSIS | = Posterior superior iliac spines |
| SPSS | = Statistical Package for Social Services |
| SUS | = System usability scale |
| TUG | = Timed Up and Go |
ETHICS APPROVAL AND CONSENT TO PARTICIPATE
The research protocol received approval from the Human Ethical Review Board of the lead investigator’s institution, Thailand (approval number: AMSEC-65EX- 078).
HUMAN AND ANIMAL RIGHTS
All procedures performed in studies involving human participants were in accordance with the ethical standards of institutional and/or research committees and with the 1975 Declaration of Helsinki, as revised in 2013.
CONSENT FOR PUBLICATION
All participants provided written informed consent prior to enrolling in the study.
AVAILABILITY OF DATA AND MATERIALS
Data that supports the findings of this study can be obtained from the corresponding author [T.K] upon reasonable request.
FUNDING
This work was financially supported by College of Arts, Media and Technology, Chiang Mai University, Thailand.
ACKNOWLEDGEMENTS
The authors would like to acknowledge the Motion Capture and Motion Analysis Laboratory at the College of Arts, Media, and Technology, Chiang Mai University, for their facilities support. We would also like to express our special thanks to all the participants for their valuable contributions to the research.

