All published articles of this journal are available on ScienceDirect.

Using Parkrun Age Grading as an Indicator of Adolescent Health: A Pilot Cross-sectional Comparator Study
Abstract
Background
Prescribing physical activity in parks and other nature settings improves health and well-being. Objective markers of health or health improvement in such a setting are required.
Objective
To examine if Parkrun age grading is a marker for health in adolescents living in a high-deprivation area.
Methods
Twenty-five adolescents, 17 female, and 8 male, were recruited from a high deprivation area. Subjects participated in testing for cardiorespiratory fitness, glycosylated haemoglobin (Hb1Ac), body composition, strength, perceived stress, and perceptions of family functioning. Within 8 days of testing, participants also completed a single 5000m Parkrun, which generated age and gender-specific Parkrun age grading scores. Participants were assigned to a high Parkrun age grading or a low Parkrun age grading group using the participant's Parkrun age grading median value, and then groups were compared.
Results
Parkrun age grading had relationships with body fat (r=-0.65, p < .001), muscle mass (r=0.47, p=0.027), and Hb1Ac (r=-0.45, p=0.037). Hb1Ac was significantly (p=0.006) different between high Parkrun age grading (34.4 ± 2.9 mmol/mol) and low Parkrun age grading (38.1 ± 2.8 mmol/mol).
Conclusion
Parkrun age grading is a marker for physical health in vulnerable adolescents, though not all aspects of health are captured.
1. INTRODUCTION
Prescribing Physical Activity (PA) in nature settings such as parks to improve health and wellbeing is gaining attention globally [1] and in New Zealand (NZ) [2]. Parkrun is increasingly recognized as a valuable form of PA prescription due to its numerous health benefits, including improvements in cardiorespiratory fitness (CRF), body composition, mental well-being, and social connec- tedness [3, 4]. Parkrun is thus gaining attention as a PA prescription for health and wellbeing [5]. Improvements in CRF are of particular importance as CRF is identified as a critical predictor of all-cause mortality and cardiovascular disease (CVD) mortality [6, 7]. Low CRF levels are associated with an increased risk (~30%) of developing at least 25 common long-term physical and mental health conditions [8-10], including stress [11]. PA also improves muscular strength (STR), which is a separate indicator of health status, risk of all-cause, and CVD mortality [12].
In adolescents, CRF and STR are robust and potent health markers [13, 14]. CRF and STR are both associated with adolescent quality of life and STR with family relationships [15]. There has been a global decline in CRF and STR among adolescents [16], with obesity rates in this population tripling over the past 40 years [17]. 80% of adolescents globally are classified as insufficiently active [18]. NZ faces particular challenges, ranking second among OECD countries for the percentage of overweight and obese 5–19-year-olds (33%) [19]. This is particularly concerning in this population as the underlying origins of many long-term conditions are increasingly attributed to factors encountered in younger years [20]. A recent review [13] describes the compelling evidence associating CRF and STR in adolescence with all-cause, CVD, and cancer-specific mortality in later life. Adolescent CRF and STR levels are now a global concern [21, 22].
Differences in running performance due to age and sex are well documented [23, 24], with peak 5000m run performance occurring at 27 and 29 years of age for males and females, respectively [25]. Parkrun attempts to account for age and sex differences by including Parkrun age grading (PAG). PAG is a percentage score per- formance metric generated for each runner at each event that has been adjusted for age and sex. This allows participants to compare their results to world records for their demographic group. PAG also allows each runner to compare personal performance against all other runners, even though they might be of different age and sex. A higher PAG score indicates better performance. While PAG has been linked to self-reported health benefits [4], its usefulness as a health marker has not been thoroughly studied, particularly among adolescents.
In NZ, ongoing patterns of ethnic socio-economic deprivation are major determinants of health inequities [26]. Deprivation is a small geographical area measure of socio-economic disadvantage relative to other small geo- graphical areas, estimated across eight factors: communi- cation, employment, home-ownership, income, living space, qualifications, support, and transport [27]. NZ adolescents from higher deprivation areas, when compared to those from low deprivation areas, have a greater risk of obesity and obesity-linked morbidities [28-30]. The incidence of NZ adolescents developing Type 2 Diabetes Mellitus (T2DM) is increasing and dispro- portionally increasing in high deprivation areas [31].
This pilot study aims to assess whether PAG can serve as a health marker for adolescents, focusing on a sample from a low-deprivation area in NZ. The study aims to examine the relationships between PAG and various health markers, including CRF, STR, body composition, HbA1c levels (a marker for diabetes), stress, and family relationship functioning. The study will also compare PAG with the Ruffier Dickson Index (RDI), a well-established marker of CRF in adolescents that has been recommended for clinical use [32, 33]. This research may provide valuable insights into how Parkrun and PAG could be used to monitor and improve adolescent health, particularly in populations affected by health inequities.
2. MATERIALS AND METHODS
2.1. Participants
Twenty-five participants were recruited via flyers distributed at a high school in New Zealand's North Island during September 2022. The school and region are both ranked decile 10 on the NZDep Index, a decile scale from 1 (the least deprived) to 10 (most deprived) [26, 27]. Inclusion criteria were enrolled school students between 13 and 18 years of age, living at an address within the decile 10 area. Exclusion criteria were a current injury, condition, or commitment that would prevent completing a Parkrun at the local Parkrun. All students received written explanations of procedures and attended information sessions with opportunities to ask questions. Participants provided written informed assent, and written informed consent was obtained from each participant’s legal guardian. All procedures conformed to the 2013 Declaration of Helsinki. The Research Ethics and Approvals Committee of the local institution provided ethical permission. (ref EA01110321).
2.2. Testing Day
All participants attended a testing day and were instructed to avoid exercise and caffeine and to not eat in the two hours prior to their testing appointment. All participants received the same sequence of testing protocol.
2.2.1. Body Composition
Participants' height was measured using a portable stadiometer to the nearest 0.5 cm. Weight (Kg), body fat (%), and skeletal muscle mass (Kg) (SMM) were then determined using ACCUNIQ BC380 (Selvas Healthcare, Seoul, 08594, Korea) bioelectrical impedance scale. BMI was calculated as weight (kg) / height2 (m2). Obesity categories were determined by BMI percentiles on the WHO growth reference for 5–19-year-olds [34].
2.2.2. Cardiorespiratory Fitness
Participants were then measured for the Ruffier Dickson Index (RDI) using the previously validated protocol [35]. RDI is calculated from three different heart rate (HR) beat per minute (BPM) measurements (HR1) average BPM from 15 s HR at rest, (HR2) the maximum BPM HR recorded during the immediate 15 s recovery following a standardized 30 squat test (40 squats·min-1, knee flexion 90°, for 45 s), and (HR3) the average BPM from 15 s HR at recovery from 1 min. The calculation is:
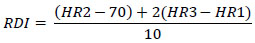 |
HR during RDI testing was recorded using Polar OH1 sensors (Polar, Polar Electro, Kempele, Finland).
2.2.3. Strength
Hand grip STR was measured using a Hand Dynamometer (Jamar Digital Plus, SI Instruments, Hilton, Australia) while sitting following the American Society of Hand Therapists recommendations [36]. Three repetitions with the dominant hand were allowed, and 30 seconds of rest between repetitions, with no verbal encouragement given. The maximum value from the three repetitions was used.
2.2.4. Hb1Ac
Hb1Ac was used as a measure of blood glucose control by Cobas B101 (Roche Diagnostics, Auckland, New Zealand). A registered nurse took blood and performed the analysis as per manufacturer instructions.
2.2.5. Perceived Stress
Participants then completed the ten-item perceived stress scale, a validated questionnaire designed to measure perceived mental stress over the previous 4 weeks [37]. Stress was calculated and categorised as previously described [38]. Scores within the 0-13 range are low stress, the 14-26 range is moderate stress, while over 27 is high stress.
2.2.6. Family Assessment Device
Finally, participants completed the 12-item General Functioning Subscale of the McMaster Family Assessment Device (FAD). The subscale is validated as a single reliable measure to assess perceptions of family functioning [39]. Scores range from 1.0 (best functioning) to 4.0 (worse functioning), while any score ≥ 2.0 was used to classify a poorly functioning family.
2.3. Parkrun Age Grading
Parkrun allows individuals to register online and generate a personal barcode. The personal barcode is then matched with a time and a finishing place. Results are displayed online after each event, showing 5k times and placings, including by gender and by age group. The website retains all results and personal best times. PAG is also given on the website. While PAG is a percentage score based on the world record 5k times for sex and age, the specific calculation used to calculate PAG is not made available by Parkrun.
The local Parkrun is flat, 5000m long, and pre- dominately tarmac with short gravel sections. Researchers registered each participant for Parkrun and printed barcodes. The participants then completed a Parkrun within eight days following the testing day in late September 2022. Participants were instructed to complete their run as fast as possible, and verbal encouragement was given. Participant Parkrun time was recorded from the Parkrun website.
2.4. Study Design
This study used a cross-sectional design with a comparator group. Participants were first ranked accor- ding to CRF estimated by PAG. Then, participants were assigned to one of two different subgroups using the PAG median value. All participants who recorded PAG value above the median value were assigned to a high PAG group, while all participants below the median were assigned to a low PAG group. This created two groups even in number that were then compared for BMI, SMM, Body fat, Strength, FAD, PSS, and Hb1Ac. This compa- rator group analysis was then repeated with RDI as the outcome measure.
2.5. Statistics
The sample size was determined using the purpose-made spreadsheet [40, 41]. Distributions were tested for normality with the D'Agostino and Pearson omnibus normality test. RDI and PGA were then examined for associations with each other and with other health markers. Comparisons between high and low groups were made with an unpaired t-test. Statistical differences and correlations were considered significant at alpha p<0.05. Cohen effect sizes were classified as trivial (d < 0.2), small (d = 0.2 to 0.5), moderate (d > 0.5 to 0.8), and large (d ≥ 0.8). Data were analysed using Prism version 4.0 (GraphPad Version 4.01, San Diego, USA).
3. RESULTS
Of the 25 participants’ 17 were female, and 8 were male. Participants' BMIs (Table 1) were underweight (n=2), healthy (n=8), overweight (n=9), and obese (n=6). 3 participants (two females and one male) did not complete RDI testing.
PAG had no association with RDI (r = -0.18, p = 0.457). PAG and RDI were examined for associations with other health markers (Table 2).
| - | n | Mean | SD | Min | Max | Female Mean |
Male Mean |
DP p value |
|---|---|---|---|---|---|---|---|---|
| Age | 25 | 15.0 | 1.6 | 12 | 18 | 15.1 | 14.6 | - |
| Height (cm) | 25 | 168.3 | 8.6 | 151.0 | 183.0 | 164.5 | 176.4 | - |
| Weight (kg) | 25 | 73.5 | 15.1 | 50.3 | 104.7 | 69.0 | 82.9 | - |
| BMI (kg/m2) | 25 | 25.9 | 4.8 | 18.2 | 34.0 | 25.5 | 26.7 | 0.266 |
| Body fat (%) | 25 | 28.9 | 10.6 | 6.5 | 44.6 | 31.3 | 23.8 | 0.131 |
| SMM (kg) | 25 | 28.8 | 5.5 | 19.2 | 38.8 | 26.0 | 34.6 | 0.664 |
| Strength (Kg) | 25 | 32.7 | 7.1 | 18.4 | 47.7 | 30.0 | 38.2 | 0.840 |
| Resting HR (bpm) | 25 | 90.1 | 14.3 | 54 | 114 | 89.7 | 90.9 | 0.066 |
| RDI | 22 | 12.3 | 3.8 | 6.7 | 19.4 | 12.6 | 11.8 | 0.393 |
| HbA1c (mmol/mol) | 25 | 36.4 | 3.3 | 30.0 | 43.0 | 37.0 | 35.1 | 0.981 |
| PSS Score | 25 | 23.0 | 6.4 | 11 | 32 | 24.9 | 18.7 | 0.160 |
| FAD Score | 25 | 2.2 | 0.5 | 1.3 | 4.0 | 2.4 | 1.9 | 0.001* |
| 5k Time (s) | 22 | 2850.9 | 640.1 | 1647 | 3782 | 3066.9 | 2388.0 | 0.419 |
| Age Grading (%) | 22 | 33.7 | 8.3 | 22.3 | 52.5 | 30.9 | 39.6 | 0.054 |
| Variable | - | PAG | RDI |
|---|---|---|---|
| BMI | Pearson's r | -0.33 | 0.34 |
| p-value | 0.129 | 0.126 | |
| Body fat | Pearson's r | -0.65 | 0.20 |
| p-value | < .001* | 0.375 | |
| SMM | Pearson's r | 0.47 | 0.11 |
| p-value | 0.027* | 0.638 | |
| Strength | Pearson's r | 0.12 | -0.51 |
| p-value | 0.576 | 0.02* | |
| HBA1c | Pearson's r | -0.45 | 0.44 |
| p-value | 0.037* | 0.04* | |
| PSS Score | Pearson's r | -0.30 | 0.23 |
| p-value | 0.170 | 0.298 | |
| FAD Score | Pearson's r | -0.44 | 0.12 |
| p-value | 0.040* | 0.959 |
As only FAD returned a significant D'Agostino & Pearson omnibus normality test, we examined FAD inde- pendently using Spearman's rank correlation coefficient. FAD was not associated with PAG (r=-0.40, p=0.07). As neither stress nor FAD was associated with either RDI or PGA, we subsequently examined associations between PSS and FAD to gain a better understanding of these two markers in our cohort (Fig. 1). Only three participants recorded low (<14 PSS) stress and 22 participants (88%) recorded moderate (n=13) or high (n=9) stress. Seventeen participants (68%) recorded their family functioning as problematic (<2.0).
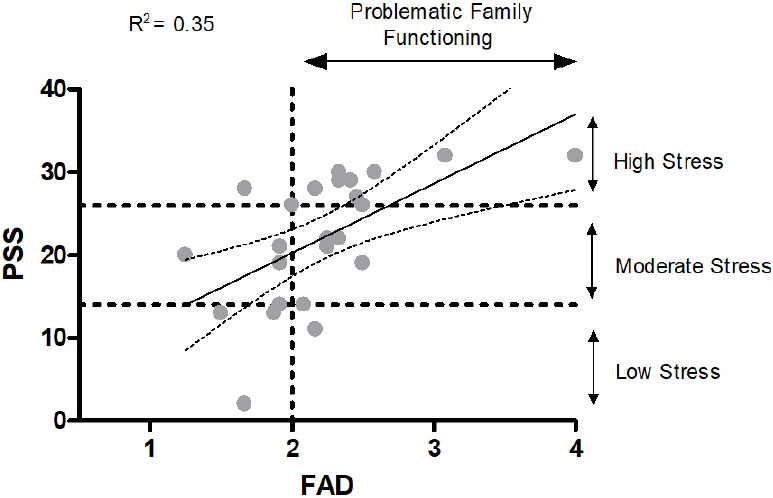
The relationship between FAD and PSS.
| - | Group | Group Means | Student's t | p | Cohen's d (interpretation) |
||||
|---|---|---|---|---|---|---|---|---|---|
| - | - | PAG | RDI | PAG | RDI | PAG | RDI | PAG | RDI |
| BMI (kg/m2) | Higher Health | 25.6 | 24.1 | 0.753 | 2.354 | 0.460 | 0.029* | 0.32 (small) |
1.00 (large) |
| Lower Health | 27.1 | 28.3 | |||||||
| SMM (kg) | Higher Health | 30.5 | 28.3 | 1.535 | 0.622 | 0.140 | 0.541 | 0.66 (medium) |
0.26 (small) |
| Lower Health | 27.1 | 29.7 | |||||||
| Body fat (%) | Higher Health | 25.9 | 26.0 | 1.584 | 1.354 | 0.129 | 0.191 | 0.68 (medium) |
0.58 (medium) |
| Lower Health | 33.1 | 32.3 | |||||||
| Strength (Kg) | Higher Health | 33.4 | 36.2 | 0.37 | 2.247 | 0.715 | 0.036* | 0.16 (no) |
0.96 (large) |
| Lower Health | 32.4 | 30.5 | |||||||
| FAD Score | Higher Health | 2.1 | 2.3 | 0.755 | 0.632 | 0.459 | 0.534 | 0.32 (small) |
0.27 (small) |
| Lower Health | 2.3 | 2.2 | |||||||
| PSS Stress Score | Higher Health | 21.1 | 21.5 | 1.085 | 0.693 | 0.291 | 0.496 | 0.46 (small) |
0.30 (small) |
| Lower Health | 24.2 | 23.5 | |||||||
| Hb1Ac (mmol/mol) | Higher Health | 34.4 | 35.3 | 3.058 | 1.327 | 0.006* | 0.200 | 1.30 (large) |
0.57 (medium) |
| Lower Health | 38.1 | 37.1 | |||||||
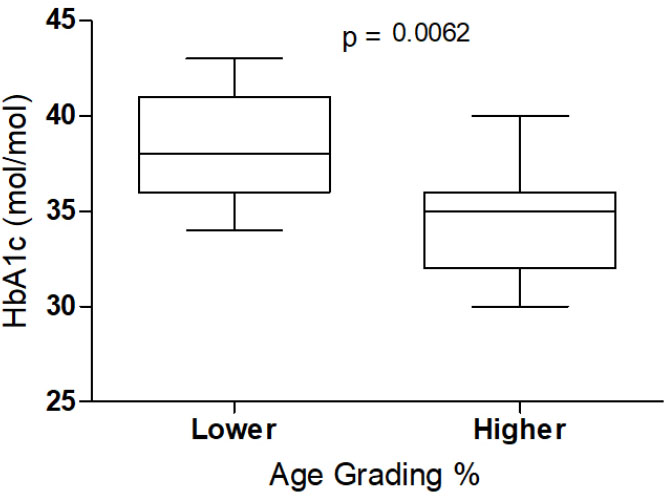
Age grading and HbA1c level.
The median PAG (30.7%) and median RDI (11) were used to split the cohort into lower (n=11) and higher (n=11) health groups resulting in contrasting differences between groups (Table 3). The largest effect and difference between groups was for the HbA1c level when using PAG (Fig. 2).
4. DISCUSSION
This pilot study investigated whether PAG is a marker for health in adolescents living in a high-deprivation area. Firstly, we aimed to examine if PAG has relationships with a holistic definition of health, including CRF, STR, body composition, Hb1Ac levels, perceived stress, and family relationship functioning. We found that PAG had a positive linear relationship with SMM (r=0.47, p=0.027) and inverse linear relationships with body fat (r=-0.65, p < .001) and Hb1Ac (r=-0.45, p=0.037). Secondly, we sought to compare PAG with RDI, an established CRF marker in adolescents. Both PAG and RDI appear useful for classifying some aspects of physical health in vulnerable adolescents. However, neither PAG nor RDI are markers for all aspects of health in this population.
Cardiopulmonary exercise testing is the definitive method to assess CRF [42], though it is rarely used in adolescent populations because it requires specialist gas analysis equipment and trained personnel, and it is also labour-intensive [43]. Our local ethics committee deemed this method unethical in our vulnerable population. In this study, we used both PAG and RDI to classify CRF. RDI has been previously shown to have validity and repeatability [35] and may be useful in clinical practice [32, 33]. Our findings suggest that PAG and RDI capture different aspects of health. In our study, only RDI had a relationship with strength (r=-0.51, p=0.02). In contrast, only PAG had relationships with body fat (r=-0.65, p<0 .001), SMM r=0.47, p=0.027), and HbA1c (r=-0.45, p=0.037). When RDI was used to categorise health status, our high health group, compared with the low health group, exhibited significantly (p=0.029) lower BMI (24.1 vs. 28.3 kg/m2) and significantly (p=0.036) higher strength (36.2 vs 30.5 kg). In contrast, when PAG was used to categorise health status, the high health group, compared with the low health group, exhibited significantly (p=0.006) lower mean HbA1c (34.4 vs 38.1 mol/mol). We speculate that these differences may be partially explained by the fact that RDI performance relies on strength to a greater degree than PAG. RDI requires 30 parallel squats, and stronger individuals and/or those with a lower BMI who encounter less resistance may find squatting less challenging. We suggest both markers are potentially useful as measures of health status, though capture different aspects of health.
The participants self-identified ethnicity in our study were > 90% Māori or Pasifika. In NZ, Māori and Pasifika experience a greater risk of obesity, CVD, and T2DM [30, 44]. The HbA1c differences (34.4 vs 38.1 mol/mol, p=0.006) between low and high PAG groups may be of particular interest to clinicians. While PAG has been previously suggested as a CRF marker [4], our results suggest it is also a marker for blood glucose homeostasis in this population. CRF is the best single predictor for CVD outcomes [6, 7], and a reduced risk for T2DM is also reported [45]. We speculate that both healthcare professionals and patients may find PAG a useful gauge for health via improved CRF. Parkrun calculates and allows individual current PAG and changes in PAG to be easily tracked via a free website. However, as Parkrun uses a variety of courses and terrain, including hills on some occasions, PAG will not be interchangeable across all locations. Rather, recommending a focus on improving PAG at the same local Parkrun should be the focus for improved health when seeking to implement PAG as a marker.
In this study, neither PAG nor RDI had any relationship to stress or FAD. However, it’s worth noting that the PAG relationship with FAD was close to significance (p=0.07), and in a larger sample, this may have been significant. Regular PA is known to decrease psychological stress [11], and such stress is associated with a growing number of physical diseases [46]. In NZ, stress measures are worsening [47], and stress levels have recently been compounded by the COVID-19 epidemic [48]. However, Parkrun mitigation during the epidemic was successful [49]. In our study, stress and FAD had a moderate positive, linear relationship (r=0.62), with 35% of the variance in stress explained by FAD. The lack of any relationship between PA measures and stress in adolescents has been previously reported [50]. Clinicians should be aware that PA levels may not be a major factor for stress in similar populations.
The major limitation of our study is that we were not able to measure CRF in a laboratory using the gold standard method as we originally intended due to ethical concerns. Further limitations are a small sample size due to this being a pilot study. Further research is now required to examine if an increase in PAG improves health. The strength of the study is that PAG was calculated independently by Parkrun, and participants and researchers were blind to PAG when testing for health.
CONCLUSION
In conclusion, we have shown for the first time that PAG is a marker for health in adolescents living in high-deprivation areas. We demonstrated that PAG has relationships with body composition and Hb1Ac in this vulnerable population. Both PAG and RDI appear useful for classifying some aspects of health in vulnerable adolescents. However, stress and FAD were not associated with either of these markers. PAG is thus a marker for physical health, although it does not capture all aspects of health. This research has provided valuable insights into how Parkrun and PAG could be used to monitor and improve adolescent health.
AUTHORS’ CONTRIBUTIONS
It is hereby acknowledged that all authors have accepted responsibility for the manuscript's content and consented to its submission. They have meticulously reviewed all results and unanimously approved the final version of the manuscript.
LIST OF ABBREVIATIONS
| SD | = Standard Deviation |
| DP | = D'Agostino & Pearson omnibus normality test |
| BMI | = Body Mass Index |
| SMM | = Skeletal Muscle Mass |
| HR | = Heart Rate |
| RDI | = Ruffier Dickson Index |
| PSS | = Perceived Stress Scale |
| FAD | = Family Assessment Device |
ETHICS APPROVAL AND CONSENT TO PARTICIPATE
The Eastern Institute of Technology Ethics Committee, provided ethical permission (ref EA01110321), New Zealand.
HUMAN AND ANIMAL RIGHTS
All procedures performed in studies involving human participants were in accordance with the ethical standards of institutional and/or research committee and with the 1975 Declaration of Helsinki, as revised in 2013.
CONSENT FOR PUBLICATION
A written informed consent was obtained from each participant’s legal guardian.
AVAILABILITY OF DATA AND MATERIALS
The data supporting the findings of the article is now available in the Zenodo Repository at https://doi.org/ 10.5281/zenodo.13942615.

