All published articles of this journal are available on ScienceDirect.

Estimating the Economic Burden of COVID-19: Findings from Southern Iran
Abstract
Background and Objective
COVID-19 is an acute respiratory disease that poses a significant threat to public health. Recognizing the impact and costs associated with this disease can assist policymakers in making informed decisions about the allocation of resources. Therefore, this study estimated the economic burden of COVID-19 from a societal perspective, focusing on patients admitted to the referral hospital for this disease in southern Iran in 2022.
Methods
This descriptive and analytical study employed a random sampling method to select patients admitted to hospitals affiliated with Jiroft University of Medical Sciences in southern Kerman, Iran. The sampling period spanned from March 2020 to February 2021. In total, 450 patients were included in this study. A researcher-made checklist was used as the data collection tool. The data were then analyzed using a t-test, ANOVA, and Pearson correlation coefficient. The analysis was performed using SPSS23, with the significance level set at 0.05.
Results
The study estimated the total direct cost, total indirect cost, total cost of the studied patients, and the economic burden of COVID-19 disease as 600,211.89, 193,667.28, 793,879.17, and 4,186,389.48 dollars, respectively. A statistically significant correlation was found between length of stay (r=0.858, p<0.001), type of insurance (F=2.853, P=0.023), and total direct cost.
Conclusion
Based on these results, it is evident that COVID-19 has imposed a substantial economic burden. The study findings emphasize the need for decision-makers to take measures and implement effective interventions to address COVID-19. This can be achieved by controlling risk factors, drawing upon successful experiences from other countries, and following recommendations provided by international organizations. By reducing the number of infections, the economic burden associated with the disease can be alleviated.
1. INTRODUCTION
The rapid spread of COVID-19 across various parts of the world has raised significant concerns in numerous countries as they encounter a large number of COVID-19 cases [1]. Iran officially declared the outbreak of this disease on February 18, 2020, and it is currently experiencing its seventh wave. Given the virus’s ability to spread rapidly, the reported incidence and mortality rates continue to be alarming [2].
While the primary and most crucial aspect of an epidemic is the suffering and loss of human lives, its impact extends beyond the healthcare system and affects all sectors of the country [3]. The economic sector is one of the areas profoundly affected by epidemics. Previous studies have emphasized the economic consequences of epidemics or pandemics, demonstrating their significant effects on the overall economy. Estimates suggest that the total economic loss caused by epidemics such as influenza amounts to approximately 500 billion dollars annually, equivalent to 0.6% of global income [4].
The economic impact of epidemic diseases varies across income groups, with middle and low-income countries experiencing more severe consequences than high-income countries [ 5 ]. The joint report by the World Health Organization and World Bank highlights the significant impact of epidemics. For instance, a report from the United Nations Development Program in 2017 estimated that the Zika virus epidemic in Latin America and the Caribbean from 2015 to 2017 incurred costs ranging from 7 to 18 billion dollars [ 4 ].
In recent decades, healthcare costs worldwide have increased significantly [ 6 ]. Consequently, health policymakers and planners have recognized the importance of understanding the economic costs associated with diseases. This understanding is crucial for evaluating the allocation of healthcare resources across different disease categories and for assessing the potential benefits of public health interventions [ 7 ]. These costs can arise directly from the diagnostic and therapeutic services provided to patients or indirectly from the loss of productivity and quality of life [ 6 ].
Illness costs can be categorized into two main groups: direct and indirect costs. Direct costs refer to the expenses incurred directly in providing healthcare services to patients. This includes both direct medical and non-medical costs. On the other hand, indirect costs pertain to the economic impact of the patient’s lost productivity due to illness [8].
Direct costs are further divided into two subcategories: direct clinical and direct non clinical costs. Direct clinical costs contain expenses related to hospitalization, surgeries, outpatient visits, radiation therapy, and chemo- therapy/immunotherapy. Direct non clinical costs, borne by patients and their families, include transportation costs to healthcare centers and expenses related to comple-mentary and alternative medicines [9].
European data demonstrate substantial macro- economic consequences of the COVID-19 pandemic, with an average decline in GDP of 7.4% in 2020. These effects vary among countries within the region. Without appropriate policy measures, it is estimated that the pandemic will disproportionately affect lower-income individuals, leading to increased poverty rates and overall inequality [10]. The US Council of Economic Advisers also projected that in the absence of economic support policies, low income individuals would experience an average loss of over 10% of their disposable income in the first quarter of 2020.
Initially, there was a scarcity of cost data regarding the burden of COVID-19, as is the case with any new disease. However, owing to the profound economic burden of this disease, numerous studies have recently focused on the medical costs of COVID-19 in different regions. Given the increasing number of these studies and their significant implications for healthcare budgets and the global economy, it is crucial to understand and consolidate these data to provide policymakers with a comprehensive understanding of the overall burden of COVID-19 [11].
A study conducted by Bartsch et al. (2020) in the US revealed that the infection rate of COVID-19 resulted in direct medical costs amounting to 163.4 billion dollars. The average direct medical cost for a symptomatic patient, including infection and one-year post hospital discharge, was $3,994. For hospitalized COVID-19 patients, the average cost was $18,579, considering the infection and one-year post-hospital discharge. Interestingly, the costs of hospitalization for COVID-19 patients were relatively similar across all age groups [11].
In the study by Gedik et al. (2020), the average clinical cost for patients with COVID-19 was reported to be $881.75 ± 667.31. For patients requiring Intensive Care Unit (ICU) treatment, the average cost was $2924 ± 2347.14 [12].
Based on a study by Darab (2021) conducted in Iran, the total direct medical costs for COVID-19 patients in a referral hospital in Fars province were estimated to be $1,791,172. Among the cost items, the highest cost was attributed to hospitalization, totaling $735,510. The average direct medical cost was estimated to be $3,755. The highest indirect costs were associated with the loss of productivity due to premature death, amounting to $10,190, whereas the lowest indirect costs were related to the loss of income due to hospitalization, totaling $378 [13].
To assess the economic burden of a disease, it is necessary to calculate both direct costs associated with resource allocation to medical care and indirect costs resulting from the economic resources and opportunities lost due to the disease and its treatment [9]. Gathering information on direct and indirect costs provides health policymakers with an understanding of the economic burden imposed by COVID-19 on governments, health insurance systems, and individuals. Such studies generate evidence to guide the rational allocation of limited resources to the healthcare sector during decision making processes [14]. Additionally, these studies can identify diseases that are more valuable in reducing the overall disease burden [15].
Several studies have been conducted in Iran to calculate the economic burden of various diseases, including cardiovascular diseases [16], eye diseases [17], hepatitis B [18], breast cancer [9], thalassemia [19], hepatitis C infection [20], and road accidents [21]. However, limited research has been conducted to evaluate the economic burden of this disease, which has become an epidemic in society. Therefore, this study aimed to calculate the economic burden of COVID-19 in patients hospitalized in 2022.
According to what was said, in this research, we looked for the answers to the following questions:
What are the direct and indirect costs of hospitalized patients with Covid-19?
What is the economic burden of COVID-19 in patients hospitalized?
The findings of this research, while helping to expand knowledge about the costs of the COVID-19 pandemic, have developed the awareness of health system managers and policy makers about the economic burden of such pandemics and can be a basis for planning to prepare for future similar crises.
2. METHODS
2.1. Design and Setting
This descriptive-analytical and microeconomic eva- luation study used a random sampling method among patients hospitalized in hospitals affiliated with Jiroft University of Medical Sciences in Southern Kerman, Iran, between March 2020 and February 2021. The hospitals included in this study were Imam Hossein, Imam Khomeini, Ayatollah Kashani, 12 Farvardin, Seyyed al-Shohada, and Shohada.
2.2. Participants
According to the following formula, the estimated sample size was 384 individuals. However, to enhance the validity of the results, we increased the sample size to 450 individuals. This figure was chosen based on the number of inpatients in the studied hospitals and the number of inpatients in different months, using a stratified simple random sampling approach.
The sample size of required patients in each of Imam Hossein, Imam Khomeini, Ayatollah Kashani, 12 Farvardin, Seyyed al-Shohada, and Shohada hospitals was estimated as 33, 208, 62, 89, 30, and 28, respectively.
n=Z2pq/d2
P=q= 0.5
Z= 1.96
d= 0.05
2.3. Instruments
The data collection tool used in this study was a checklist developed by the researchers. This checklist includes various demographic characteristics of the patients, such as age, sex, length of stay, discharge method, and type of insurance, as well as direct costs associated with visits, consultations, nursing services, pharmaceutical services, CT scans, ECG, laboratory tests, dialysis, radiology procedures, ultrasound, MRI, ward equipment, hoteling, and bed charges. Furthermore, the checklist incorporated relevant information needed to estimate indirect costs, such as the per capita GDP of Iran, the average daily wage rate, and the average number of days patients stayed in the hospital.
2.4. Procedures and Statistical Analysis
To collect information about direct costs, the researchers (ARY) referred to the accounting unit of the studied hospitals and obtained patients’ invoices from the Health Information System (HIS) within the desired time period. The checklist of direct costs was completed based on these invoices.
For calculating indirect costs, the human capital approach was employed as follows:
2.4.1. Estimating the Economic Loss in Potential Production due to Mortalities
The economic loss in potential production due to mortalities was determined by multiplying the GDP per capita by the average years of life lost due to premature death. In this study, Iran’s GDP per capita in 2021 was estimated based on the Central Bank report, and the average years of life lost due to premature death were calculated using the number of patients who died between the ages of 15 and 65 years.
2.4.2. Estimating the Economic Burden of Lost Productivity due to Illness and Disability
The economic burden of lost productivity due to illness and disability was calculated by multiplying the average days of hospitalization by the average daily wage rate and the total number of patients.
It should be noted that the average daily wage rate in 2021 was determined to be 15.16 dollars, according to a report by the Ministry of Cooperation, Labor, and Social Welfare of Iran.
2.4.3. Indirect Costs Related to the COVID-19
The indirect cost was estimated by adding the economic loss in potential production due to mortalities to the economic burden of lost productivity due to illness and disability. The economic burden of COVID-19 was then calculated using the following formula:
Economic burden of COVID-19 = total mean cost per person (total direct costs + total indirect costs) divided by the total number of studied patients (450) multiplied by the number of patients with COVID-19 in the studied period [13].
Demographic and cost information of the patients was collected confidentially and imported into SPSS23 without disclosing the patients’ names. The data were analyzed using descriptive and inferential statistical methods, including Pearson correlation coefficient, T-test, and ANOVA, with a significance level of α=0.05.
3. RESULTS
3.1. Demographic Characteristics of the Study Patients
The mean age of the patients included in the study was 55.88 ± 19.11 years, with the majority (18.89%) falling within the age range of 61 to 70 years. The majority of the patients were male (51.3 percent), and a significant portion had health insurance (69.8 percent). On average, the patients stayed in the hospital for a duration of 5.56 ± 4.14 days, with the majority (49.55%) being hospitalized for less than 5 days. Furthermore, 87.34% of patients recovered and were discharged from the hospital. Table 1 shows the frequency distribution of study patients.
3.2. Frequency of Services Provided to the Study Patients
Based on the findings, the highest number of services provided to the study patients was related to pharmaceutical services, with an average of more than 9,000 drugs administered (equivalent to an average of 22.05 drugs per patient) (Table 2).
| Variable | Group | Number | Percent |
|---|---|---|---|
| Sex | Female | 219 | 48.7 |
| Male | 231 | 51.3 | |
| Age (year) | < 20 | 3 | 0.67 |
| 20-30 | 35 | 7.78 | |
| 31-40 | 79 | 17.56 | |
| 41-50 | 72 | 16 | |
| 51-60 | 68 | 15.11 | |
| 61-70 | 85 | 18.89 | |
| 71-80 | 52 | 11.55 | |
| 81-90 | 40 | 8.89 | |
| >90 | 16 | 3.55 | |
| Length of stay (day) | <5 | 223 | 49.55 |
| 5-10 | 189 | 42 | |
| 11-15 | 25 | 5.56 | |
| 16-20 | 6 | 1.34 | |
| > 20 | 7 | 1.55 | |
| Type of insurance | Therapeutic services | 314 | 69.8 |
| Social security | 106 | 23.6 | |
| Armed forces | 14 | 3.1 | |
| Others | 8 | 1.8 | |
| Without insurance | 8 | 1.8 | |
| Discharge method | Recovered | 393 | 87.34 |
| Passed away | 36 | 8 | |
| Transferred | 7 | 1.56 | |
| Discharged with personal consent | 14 | 3.1 |
| Type of Service | Frequency | Mean | Standard Deviation |
|---|---|---|---|
| Visit | 3276 | 7.28 | 8.60 |
| Consultation | 270 | 0.60 | 1.24 |
| Nursing | 459 | 1,02 | 3.44 |
| CT scan | 400 | 0.89 | 0.71 |
| ECG | 513 | 1.14 | 1.42 |
| Laboratory | 2799 | 6.22 | 6.60 |
| Medications | 9922 | 22.05 | 17.50 |
| Radiography | 99 | 0.22 | 0.65 |
| Ultrasound | 58 | 0.13 | 0.41 |
| MRI | 5 | 0.01 | 0.07 |
| Dialysis | 18 | 0.04 | 0.52 |
| Ward equipment | 5668 | 12.59 | 12.96 |
| Hoteling and bed | 2484 | 5.52 | 4.03 |
Table 3.
| Category | Amount | Mean | SD | Percent Out of the Total Costs |
|---|---|---|---|---|
| Primary insurance | 503458.21 | 1118.79 | 1425.02 | 83.88 |
| Subsidy | 27008.46 | 60.01 | 109.21 | 4.50 |
| Supplementary insurance | 4459.33 | 9.90 | 81.67 | 0.74 |
| Patient | 56219.69 | 124.93 | 235.85 | 9.37 |
| Non-subsidized expenses | 9066.18 | 20.14 | 169.20 | 1.51 |
| Total | 600211.89 | 1333.80 | 1315.02 | 100 |
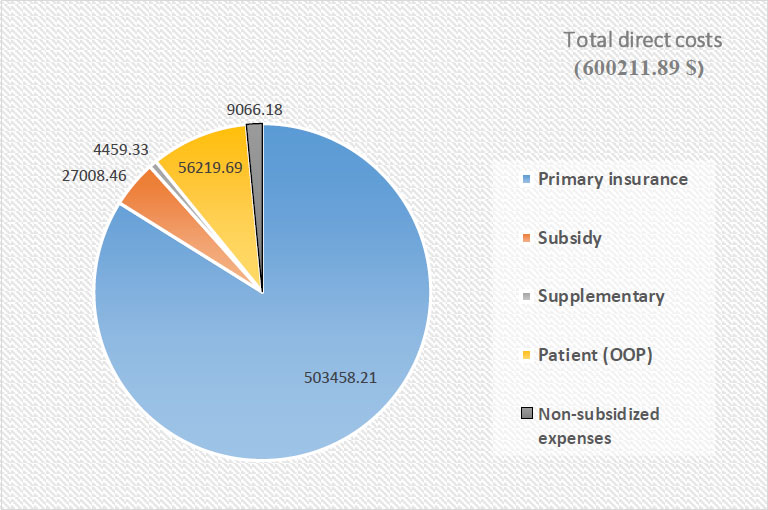
Portions of primary and supplementary insurances, subsidies, patient contributions, and non-subsidized expenses in the total direct costs of study patients.
3.3. Direct Costs of all Study Patients
Based on these findings, the total direct cost was calculated to be $600,211.89. Out of this total amount, primary insurance accounted for 83.88% ($503,458.21), subsidies accounted for 4.50% ($27,008.46), supple- mentary insurance accounted for 0.74% ($4,459.33), patients contributed 9.37% ($56,219.70), and 1.51% ($9,066.18) were non-subsidized expenses. These figures are summarized in Table 3 and Fig. (1).
The results showed that among the types of services, pharmaceutical services accounted for the most direct costs, with 40.74% of the total costs ($244,578.16) (Tables 4 and 5).
3.4. The Relationship between the Direct Costs and Demographic Variables of the Study Patients
Based on the data presented in Table 6, a statistically significant correlation was found between age and the costs associated with visits, consultations, nursing services, CT scans, ECG, ultrasound, MRI, ward equipment, and hoteling and bed. This indicates that as age increased, the costs associated with these services increased (p < 0.05). Additionally, a statistically significant relationship was observed between the length of stay and both the total direct cost and direct costs categorized by service type. As the length of stay increased, the direct costs associated with specific services and the total direct cost increased (p < 0.05).
The findings indicated a statistically significant relationship between the type of insurance and the costs of visits, dialysis, and total direct costs (p < 0.05). Additionally, a statistically significant relationship was observed between the method of discharge, costs of consultation, nursing services, CT scans, laboratory tests, ultrasound, MRI, ward equipment, and hoteling and bed (p < 0.05).
| Type of Service | Total Amount | Total Primary Insurance | Total Subsidy | Total Supplementary Insurance | Total Patient Contribution | Total Non-subsidized Expenses | Percent out of Total Cost |
|---|---|---|---|---|---|---|---|
| Visit | 82105.05 | 77269.20 | 1218.39 | 159.97 | 2967.17 | 503.18 | 13.67 |
| Consultation | 9081.04 | 9527.99 | 161.99 | 16.04 | 313.85 | 67.97 | 1.51 |
| Nursing | 9018.74 | 8467.36 | 231.85 | 30.32 | 821.47 | 146.72 | 1.50 |
| CT scan | 11672.33 | 10462.81 | 244.23 | 37.50 | 748.82 | 162.33 | 1.94 |
| ECG | 2158.84 | 1996.31 | 44.5942619 | 3.93 | 117.72 | 20.67 | 0.36 |
| Laboratory | 39550.31 | 35428.60 | 1027.23 | 149.72 | 3081.43 | 573.20 | 6.59 |
| Medication | 244578.16 | 192173.09 | 12861.20 | 2668.44 | 28238.85 | 0 | 40.74 |
| Radiography | 648.51 | 593.45 | 15.85 | 0.59 | 43.53 | 4.24 | 0.10 |
| Ultrasound | 1330.21 | 1224.95 | 32.47 | 12.86 | 59.91 | 8.10 | 0.22 |
| MRI | 111.11 | 101.18 | 1.24 | 2.48 | 6.20 | 0 | 0.01 |
| Dialysis | 1192.23 | 1158.41 | 12.45 | 0 | 21.36 | 0 | 0.19 |
| Ward equipment | 17587.30 | 5151.94 | 6171.03 | 675.69 | 5643.03 | 11.82 | 2.93 |
| Hoteling and beds | 153990.51 | 136444.32 | 2938.98 | 585.73 | 12597.39 | 2445.45 | 25.65 |
| Type of Service | Mean (SD) | |||||
|---|---|---|---|---|---|---|
| Total Amount | Primary Insurance | Subsidy | Supplementary Insurance | Patient Contribution | Non-subsidized Expenses | |
| Visit | 182.45 (196.36) |
171.70 (188.29) |
2.70 (5.96) |
0.35 (2.54) |
6.60 (13.03) |
1.11 (9.62) |
| Consultation | 20.18 (44.40) |
21.17 (55.52) |
0.36 (1.46) |
0.035 (0.46) |
0.69 (2.91) |
0.15 (2.60) |
| Nursing | 20.04 (2.67) |
18.81 (33.41) |
0.51 (1.16) |
0.06 (0.54) |
1.82 (5.65) |
0.32 (4.02) |
| CT scan | 25.93 (24.40) |
23.25 (20.37) |
0.54 (0.88) |
0.08 (0.66) |
1.66 (3.49) |
0.36 (3.32) |
| ECG | 4.79 (6.25) |
4.43 (5.85) |
0.09 (0.20) |
0.008 (0.07) |
0.26 (0.49) |
0.04 (0.41) |
| Laboratory | 87.88 (64.69) |
78.73 (59.30) |
2.28 (3.92) |
0.33 (2.24) |
6.84 (13.94) |
1.27 (11.98) |
| Medication | 543.50 (729.17) |
427.05 (525.75) |
28.58 (68.23) |
5.94 (68.01) |
62.75 (147.07) |
0 (0) |
| Radiography | 1.44 (4.23) |
1.31 (3.89) |
0.03 (0.12) |
0.001 (0.02) |
0.09 (0.42) |
0.009 (0.20) |
| Ultrasound | 2.95 (11.86) |
2.72 (11.01) |
0.07 (0.34) |
0.02 (0.36) |
0.13 (0.66) |
0.01 90.38) |
| MRI | 0.24 (2.6) |
0.22 (2.37) |
0.002 (0.05) |
0.005 (0.11) |
0.01 (0.17) |
0 (0) |
| Dialysis | 2.64 (34.08) |
2.57 (33.72) |
0.02 (0.48) |
0 (0) |
0.04 (0.63) |
0 (0) |
| Ward equipment | 39.08 (92.70) |
11.44 (41.06) |
13.71 (36.10) |
1.50 (20.68) |
12.54 (26.76) |
0.02 (0.55) |
| Hoteling and bed | 342.20 (476.33) |
303.21 (428.15) |
8.75 (20.34) |
1.30 (11.03) |
27.99 (77.09) |
5.43 (67.11) |
| Demographic Variable | Direct Costs | Pearson Coefficient Correlation | P-value |
|---|---|---|---|
| Age | Visit | 0.096 | 0.042 |
| Consultation | 0.317 | 0 | |
| Nursing services | 0.109 | 0.02 | |
| CT scan | 0.127 | 0.007 | |
| ECG | 0.115 | 0.014 | |
| Laboratory | 0.198 | 0 | |
| Medication | -0.025 | 0.6 | |
| Radiography | 0.031 | 0.5 | |
| Ultrasound | 0.141 | 0.003 | |
| MRI | 0.111 | 0.019 | |
| Dialysis | 0.044 | 0.35 | |
| Ward equipment | 0.135 | 0.004 | |
| Hoteling and bed | 0.101 | 0.032 | |
| Total direct cost | 0.081 | 0.08 | |
| Length of stay | Visit | 0.868 | 0 |
| Consultation | 0.305 | 0 | |
| Nursing services | 0.855 | 0 | |
| CT scan | 0.29 | 0 | |
| ECG | 0.129 | 0.006 | |
| Laboratory | 0.688 | 0 | |
| Medication | 0.504 | 0 | |
| Radiography | 0.148 | 0.002 | |
| Ultrasound | 0.199 | 0 | |
| MRI | 0.107 | 0.023 | |
| Dialysis | 0.264 | 0 | |
| Ward equipment | 0.541 | 0 | |
| Hoteling and bed | 0.859 | 0 | |
| Total direct cost | 0.858 | 0 | |
| Demographic variable | Direct costs | F-value | P-value |
| Type of insurance | Visit | 2.627 | 0.034 |
| Consultation | 1.363 | 0.246 | |
| Nursing services | 0.931 | 0.446 | |
| CT scan | 1.849 | 0.118 | |
| ECG | 1.298 | 0.27 | |
| Laboratory | 1.548 | 0.187 | |
| Medication | 2.331 | 0.055 | |
| Radiography | 0.444 | 0.777 | |
| Ultrasound | 0.814 | 0.517 | |
| MRI | 0.071 | 0.991 | |
| Dialysis | 1.256 | 0 | |
| Ward equipment | 1.074 | 0.369 | |
| Hoteling and bed | 1.364 | 0.245 | |
| Total direct cost | 2.853 | 0.023 | |
| Method of discharge | Visit | 1.002 | 0.406 |
| Consultation | 1.206 | 0 | |
| Nursing services | 2.665 | 0.032 | |
| CT scan | 3.108 | 0.015 | |
| ECG | 1.885 | 0.112 | |
| Laboratory | 4.053 | 0.003 | |
| Medication | 0.482 | 0.749 | |
| Radiography | 0.552 | 0.698 | |
| Ultrasound | 3.964 | 0.004 | |
| MRI | 4.361 | 0.002 | |
| Dialysis | 0.224 | 0.925 | |
| Method of discharge | |||
| Ward equipment | 7.529 | 0 | |
| Hoteling and bed | 2.431 | 0.047 | |
| Total direct cost | 1.517 | 0.196 | |
| Demographic variable | Direct costs | T value | P-value |
| Sex | Visit | 1.107 | 0.552 |
| Consultation | 0.448 | 0.532 | |
| Nursing services | 0.037 | 0.271 | |
| CT scan | 1.568 | 0.158 | |
| ECG | 0.761 | 0.192 | |
| Laboratory | 0.911 | 0.495 | |
| Medication | 0.81 | 0.643 | |
| Radiography | 0.378 | 0.245 | |
| Ultrasound | 0.166 | 0.639 | |
| MRI | 0.95 | 0.057 | |
| Dialysis | 1.181 | 0.019 | |
| Ward equipment | 0.505 | 0.067 | |
| Hoteling and bed | 0.067 | 0.371 | |
| Total direct cost | 0.973 | 0.728 |
Moreover, a statistically significant correlation was found between sex and dialysis costs when examining the relationship between demographic variables and direct costs. Specifically, the mean cost of dialysis was higher in men (4.49 ± 46.46) than in women (0.71 ±10.38).
3.4.1. Indirect Costs of all Study Patients
3.4.1.1. The Economic Loss in Potential Production due to Mortalities
The economic loss in potential production due to mortalities ($155,736.96) = GDP per capita ($9,733.56) × Average years lost due to premature death (16 years).
Given that out of the 36 patients who died, only seven people were of productive age (15-65 years), the average years lost due to premature death were calculated based on the age information of these seven people.
According to a report by the Central Bank, the GDP per capita of Iran in 2021 was considered 9733.56 dollars.
3.4.2. Indirect Costs
Indirect costs ($193,667.28) = the economic loss in potential production due to mortalities ($155,736.96) + the economic burden of lost productivity due to illness and disability ($37,930.32).
3.4.2.1. The Total Cost (Direct and Indirect) of the Study Patients
Total cost (direct and indirect) of the study patients ($793,879.17) = total direct costs ($600,211.89) + total indirect costs ($193,667.28)
3.4.2.2. Estimating the Economic Burden of Patients with COVID-19 Hospitalized in the Study Hospitals in a One-year Period (from the patient's point of view)
Economic burden of patients with COVID-19 hospitalized in the study hospitals ($4186389.48) = total mean cost per person (direct costs ($600211.89) + indirect costs ($193667.28) divided by the total number of study patients (450)) × the number of patients with COVID-19 in the study hospitals (N=2373)
The number of patients with COVID-19 in the study hospitals was 2373 people.
4. DISCUSSION
The COVID-19 pandemic has had a significant impact on the Iranian health system and society, resulting in a heavy economic burden [22]. This study aimed to estimate the economic burden of COVID-19 in hospitals affiliated with Jiroft University of Medical Sciences in southern Kerman, Iran.
The total direct medical costs for COVID-19 patients in this study amounted to $600,211.89, with a mean cost of $1333.80 ± 1315.02 per patient. Darab et al. (2021) conducted a study at a referral hospital for COVID-19 patients in Iran and found that the total costs and mean direct medical costs per patient were $1,791,172 and $3,755, respectively [13]. Bartsch et al. (2020) estimated the mean direct medical costs per COVID-19 patient in the US to be $3045 [23]. Cleary et al. (2021) estimated the hospitalization cost for chronically ill patients in South Africa to be $7600 [24]. Jin et al. (2020) found that the hospitalization cost for critically ill patients with COVID-19 in China was approximately $9,000, with hospital beds being one of the largest cost components [25].
Kabir et al. (2021) conducted a study in a referral hospital for COVID-19 patients in Iran and reported that the mean direct medical cost for each chronically ill patient was $5,117 [22]. Yusefi et al. (2022) estimated the total direct medical costs of COVID-19 patients in a referral hospital in Iran to be $1,037,992.15 [26]. Mojtabaeian and Monfared (2022) estimated the mean direct cost per COVID-19 patient in Iran to be 57,339,107 Rials [27].
It is important to note that direct medical costs can vary depending on factors such as the number of patients, disease severity, length of hospital stay, and length of ICU stay [28, 29]. The treatment costs for COVID-19 patients are generally higher than those for other infectious diseases, owing to the possibility of hospitalization and higher mortality rates [23]. The differences in total costs and mean direct medical costs across different studies may be attributed to differences in the range of medical diagnostic services, medications, and patient's insurance conditions.
The results indicated that pharmaceutical services accounted for the highest proportion of direct medical costs among the different types of services, amounting to 40.74% ($244,578.16) of the total costs. Numerous studies have shown that medication expenses constitute the largest portion of direct medical costs [30, 31]. Darab et al. (2021) found that pharmaceutical costs accounted for 34% of the total cost for COVID-19 patients [13]. Similarly, Sadeghifar et al. (2021) reported that pharmaceutical services represented the largest portion (30%) of direct medical costs for COVID-19 patients [32]. Kabir et al. (2021) also identified drug costs as a major component (32%) of COVID-19 patient expenses [22]. In Yusefi et al.’s study (2022), the cost of medicines constituted the largest out-of-pocket expense for COVID-19 patients (50.23%) (26). Jin et al. (2020) found that medication costs constituted the largest proportion of the total costs for COVID-19 patients [25].
Another significant finding of this study was the relationship between the length of hospital stay and both the total direct cost and direct costs associated with different types of services. It was found that reducing the length of hospital stay could lead to various benefits, including increased revenue, cost reduction, decreased variations in clinical procedures, improved quality of care, and increased profitability. Prolonged and unnecessary hospital stays not only waste human resources and depreciate equipment but also result in additional costs for the patients.
Several studies have demonstrated that reducing the length of hospital stay can effectively lower costs without compromising health outcomes or the quality of care. As a result, policymakers, hospital managers, and third party payers (such as insurers) often prioritize strategies aimed at reducing hospital stays. These stakeholders emphasize the importance of containing hospital costs and maximizing efficient and effective utilization of limited hospital resources [33].
Another significant finding of the study was the statistically significant relationship between age, and the costs associated with various services such as visits, consultations, nursing services, CT scans, ECG, ultrasound, MRI, ward equipment, and hoteling and bed. The results indicated that as age increased, the costs of these services also increased significantly (p < 0.05).
This finding is consistent with a study conducted by Richards et al. (2022), which found that, on average, older patients with COVID-19 incurred higher costs than younger age groups [11]. However, it is important to note that this finding contradicts the results of a study by Holy et al. (2020), which reported that older age groups (≥ 84 years) were associated with lower costs than other age groups [34]. The difference in findings between these studies may be attributed to insurance coverage for COVID-19 patients.
This study found a statistically significant relationship between insurance type, costs associated with visits, dialysis, and total direct costs (p < 0.05). According to Kabir et al. (2021), primary insurance covers an average of 82% of the total costs for COVID-19 patients [22]. Similarly, Sadeghifar et al. (2021) reported that primary insurance covered 80% of the total costs, whereas supplementary insurance covered 2% [32].
The study by Ghiasvand et al. (2010) revealed that having supplementary insurance coverage at the 10% level was statistically significant in preventing the occurrence of financially burdensome medical costs. However, social health insurance plans in Iran have not been effective in reducing such costs. The ineffectiveness of social health insurance plans in supporting patients may be attributed to the design and implementation of insurance plans without considering important factors such as the socioeconomic status of households, demographic characteristics, and the pattern and epidemiology of diseases in Iran [35].
The COVID-19 pandemic not only resulted in direct costs but also imposed significant indirect costs. These indirect costs include potential reductions in productivity due to absenteeism during hospitalization and recovery and decreased productivity resulting from premature death. Additionally, income lost due to illness, obligatory stay-at-home measures, or death of the workforce due to COVID-19 can be considered indirect costs [13].
According to Kabir et al. (2021), the total mean indirect cost for each COVID-19 patient was estimated to be 959,577,714 Rials [22]. In a study by Darab et al. (2021), the reduction in productivity among COVID-19 patients was found to be twice as much as the direct medical costs per patient. The mean indirect cost per person in the above study was estimated to be $11,634 [13]. Different indirect costs across different studies may be attributed to differences in the number of deaths among working-age individuals due to COVID-19.
The findings revealed that COVID-19 placed a significant economic burden on the study hospitals, amounting to $4,186,389.48. Jin et al. (2021) conducted a study in China to examine the economic burden of COVID-19, reporting the total health costs and social costs associated with the disease as $0.62 billion and $383.02 billion US dollars, respectively [36]. Fusco et al. (2021) conducted a study on the consequences and economic burden of 173,942 hospitalized patients with COVID-19 in the US, estimating the mean hospital costs to be $12,046 [37]. Additionally, Lui et al. (2021) conducted a study in the US, which indicated that the economic burden of COVID-19, considering years of life lost due to illness, disability, and death, amounted to $119.62 billion US dollars [38]. Bartsch et al. (2020) conducted a study in the US, estimating the mean direct medical costs per person during the pandemic to be $3,045 [23]. Claxton et al. (2020) also conducted a study on the costs of COVID-19, reporting mean hospital costs of $9,763 for patients without mechanical ventilation and $34,223-88,114 for those requiring mechanical ventilation [39].
When comparing the study results with those of similar studies, it is evident that COVID-19 has imposed a substantial economic burden on various countries. This trend poses a significant challenge to healthcare systems, particularly in underdeveloped and low-income countries, potentially pushing them towards collapse [ 40 ]. Therefore, it is crucial to focus on managing and controlling new COVID-19 cases to prevent their spread.
Regarding the limitations of the study, it is important to note that due to the limited access to socioeconomic information of patients, further research is recommended to explore the impact of lost production and productivity across different income groups.
CONCLUSION
The investigation of the economic dimensions of COVID-19 in this study yielded substantial evidence supporting the implementation of socio-economic policies pertaining to COVID-19 and similar epidemics. The study findings, along with the estimated economic burden, indicate that COVID-19 has the potential to exert unprecedented economic pressure on the Iranian health system in terms of allocating financial resources to healthcare centers. Therefore, it is strongly recommended that disease control be prioritized through preventive measures and subsequently implemented cost control policies.
Also, the implementation of additional preventive measures, such as large scale vaccination in order to reduce the incidence and thus reduce direct and indirect medical costs is a vital issue that health managers and policy makers should consider.
AUTHORS’ CONTRIBUTIONS
R.F.: Designed the study and prepared the initial draft; R.F. and A.R.Y.: Contributed to data collection and data analysis; S.B. and J.B.: Supervised the whole study and finalized the article.
LIST OF ABBREVIATIONS
| ICU | = Intensive Care Unit |
| HIS | = Health Information System |
ETHICS APPROVAL AND CONSENT TO PARTICIPATE
This study was approved by the Jiroft University of Medical Sciences Ethics Committee, southern Iran with the ID number IR.JMU.REC.1400.048. All the methods were carried out in accordance with relevant guidelines and regulations.
HUMAN AND ANIMAL RIGHTS
All procedures performed in studies involving human participants were in accordance with the ethical standards of institutional and/or research committees and with the 1975 Declaration of Helsinki, as revised in 2013.
AVAILABILITY OF DATA AND MATERIALS
All the data is presented as a part of tables or figures. Additional data can be requested from the corresponding author [A.Y].
FUNDING
This work was supported by Jiroft University of Medical Sciences, Jiroft, Iran with grant number: 606.
ACKNOWLEDGEMENTS
This article is part of a research project that has been approved by the Vice-Chancellor for Research and Technology at Jiroft University of Medical Sciences, with reference No. 606. The researchers would like to thank the Vice-Chancellor for Research and Technology at Jiroft University of Medical Sciences and the managers of the hospitals involved in the study. Their invaluable financial and spiritual support has made this research possible.

