All published articles of this journal are available on ScienceDirect.

Prevalence and Determinants of Suboptimal Glycemic Control in Type 2 Diabetes Mellitus Patients in Primary Health Care
Authors Info & Affiliations
Abstract
Background
Diabetes mellitus is considered one of the most critical global health issues. Mitigating diabetic complications resulting from insufficient glycemic control is a primary objective in diabetes care. Identifying the reasons for inadequate glycemic control is crucial for implementing effective therapies and preventing complications.
Materials and Methods
A cross-sectional analytical study was conducted among 352 adult patients with type 2 diabetes mellitus at primary health care centers from January to April 2023. Patients were recruited using a multistage cluster random sampling technique. Data was collected to assess the frequency and determinants of suboptimal diabetic control among type 2 diabetes mellitus patients. A semi-structured questionnaire and clinical measurements were used for data collection. The glycemic control variable (good vs poor) was analyzed using bivariate analyses to evaluate demographic, clinical, and laboratory differences. R Studio (R version 4.3.1) was employed for data analysis. The variable of glycemic control (good vs poor) was analyzed using bivariate analyses to assess differences based on demographic, clinical, and laboratory parameters. Univariate and multivariate logistic regression analyses evaluated predictors of suboptimal glycemic control.
Results
The study comprised 352 diabetic individuals, of whom 150 (42.61%) had suboptimal glucose control. predictors of suboptimal glycemic control were: irregular follow-up (OR = 4.95, 95% CI 2.30 to 11.4, p = 0.001), poor medication compliance (OR = 4.49, 95% CI 2.24 to 9.28, p < 0.001), a positive family history of diabetes (OR = 2.35, 95% CI 1.27 to 4.43, p = 0.007), elevated serum creatinine levels (OR = 8.06, 95% CI 1.89 to 39.2, p = 0.006), and the presence of neuropathy (OR = 6.10, 95% CI 2.46 to 15.8, p < 0.001).
Conclusion
A significant percentage of diabetics in this research had inadequate glycemic control. Consequently, healthcare practitioners must address predictors to prevent illness progression.
1. INTRODUCTION
Suboptimal glycemic control for type 2 diabetes mellitus (T2DM) represents a major global health concern, particularly in developing countries [1]. Diabetes mellitus (DM) impacts about 422 million individuals globally, resulting in 1.5 million direct fatalities and an additional three million indirect deaths, mostly due to inadequate glycemic control. According to recent epidemiological reports, there were 536.6 million individuals globally with T2DM (10.5%), reflecting a 16 percent increase (74 million) from previous projections two years prior. By 2045, it is anticipated that 783.2 million people (12.2%) will have diabetes worldwide [2-5]. Similarly, the prevalence rate is projected to be 13.9% in The Middle East by 2045 [3, 4]. Saudi Arabia has alarming diabetes mellitus occurrence, with the second-highest prevalence of diabetes in the Middle East, placing seventh on a global scale. Moreover, the incidence in Saudi Arabia has escalated from 7% to 32% [6]. The International Diabetic Federation (IDF) report revealed that there are 4.27 million diabetics in Saudi Arabia – which has a population of about 34.8 million – while a further 1.86 million individuals are undiagnosed [7, 8]. According to the WHO, nearly 3 million individuals are pre-diabetic, and around 7 million individuals have diabetes. The recent trend of increasing diabetes patients in Saudi Arabia is alarming [6]. Despite this trend, limited information exists regarding the factors linked to inadequate glycemic control in individuals with type 2 diabetes [7].
According to the American Diabetes Association (ADA), one of the most crucial approaches to managing diabetes is achieving and maintaining glucose control. The ADA states that the primary approach for diabetes care is achieving and maintaining glucose control. The ADA has recommended a glycosylated hemoglobin (HbA1c) goal below 7% to avert complications and minimize overall diabetes-related expenses [3]. Strict control depends on additional patient-specific criteria such as age, duration of diabetes, concomitant conditions, and risk of hypoglycemia. Treatment intensification is advised when patients' HbA1c levels remain above the therapeutic range for over three months [9-11]. According to the UK Prospective Diabetes Study, a 1.0% absolute decrease in HbA1c is linked to risk reductions of 21%, 14%, and 37% for myocardial infarction, microvascular complications, and diabetes-related deaths, respectively [12]. Despite the benefits of comprehensive diabetes management in reducing complications, as shown by evidence-based research [4], many patients still do not have their diabetes well managed [5].
Despite being well recognized, current evidence indicates that diabetes management and control are suboptimal. Significant gaps in early detection and optimal care exist. To mitigate the rising impact of the condition, it is essential to focus on diabetes control and management. In Saudi Arabia, 67.7% of diabetic patients had suboptimal glycemic control [13]. This percentage closely aligns with findings from another study conducted in a different region of KSA (67.9%) [5]. Other studies indicated a significantly higher proportion of appropriate control at 76.4% in Al-Madinah [14, 15], while approximately 20.6% of patients in Riyadh attained HbA1c levels below 7% [16].
Having T2DM patients with poor glycemic control is a serious global health issue, particularly for those of low socioeconomic status, limited educational attainment, and unique dietary practices. A history of diabetes diminished self-efficacy, and inadequate knowledge of diabetes were the most reliable predictors of suboptimal glycemic management [14].
Even while type 2 diabetes mellitus is somewhat common in Saudi Arabia, epidemiological statistics are lacking, particularly in Makkah city. The formulation of therapies necessitates such evidence to devise strategies for early intervention in uncontrolled hyperglycemia and to postpone diabetic consequences. This study assesses the frequency and potential determinants affecting inadequate diabetic management among patients with T2DM receiving care in a primary healthcare setting in Makkah, Saudi Arabia.
2. MATERIALS AND METHODS
2.1. Study Design and Setting
This cross-sectional analytical study examined the prevalence and factors associated with suboptimal glycemic control among diabetic patients attending primary health care centers in Makkah City, Saudi Arabia.
2.2. Study Population
2.2.1. Inclusion Criteria
Patients with (T2DM) who visited diabetic clinics in primary health care (PHC) centers from January to April 2023 had received a diagnosis of T2DM at least one year prior and were undergoing treatment. The agreement to participate was obtained by signing an informed consent.
2.2.2. Exclusion Criteria
Those with severe illness, hospital admissions, pregnancy, or inability to provide essential information were excluded.
2.2.3. Sample Size
The sample size was calculated using the standard formula for cross-sectional studies (1); n= Z2×p (100−p)/e assuming a standard normal variable (z score) of 1.96 at a 95% confidence interval, a margin of error (e) of 5%, and a prevalence (p) of 74% of inadequate DM control revealed in a Jazan study [2]. The estimated sample size was 296 participants, and after allowing an additional 20% dropout, the final sample size was set at 356 patients.
2.2.4. Sampling Technique
A multistage cluster random sampling technique was employed to ensure that the sample was a representative of the target population. The sampling frame in Makkah City consisted of all T2DM patients diagnosed and registered in the registries of the main primary health care centers. Initially, primary care center clusters were chosen using a simple random sample, followed by a random sample selected in proportion to the number of patients with diabetes in each primary care center or each selected cluster.
2.3. Definition of Variables
The dependent main outcome was the rate of suboptimal control of diabetes. Diabetes control was assessed by HbA1c level, with a threshold of HbA1c < 7% and a continuous variable. An HbA1c level ≥ 7% was defined as suboptimal glycemic control [3].
2.3.1. Physical Activity
One of the lifestyle factors can be characterized as any movement of the body that results from the contraction and relaxation of muscles, thereby employing stored energy. Individuals who participated in physical activity for duration under 30 minutes per session daily exhibited mild physical activity; those who engaged for duration exceeding 30 minutes per session daily demonstrated moderate physical activity; and individuals who exercised for periods surpassing 45 minutes per session daily were regarded as participating in vigorous activity [4, 5].
Dietary compliance for individuals with T2DM is characterized by a regimen consisting of modest, frequent meals, with a minimum of five servings daily, rich in fruits, vegetables, high-fiber diets, healthy grains, and little sugar content. A Likert scale with values from 0 to 20 was used. To assess adherence to dietary consumption. Responses to ten items were classified as “always,” “sometimes,” and “never,” corresponding to scores of 2, 1, and 0, respectively. Scores ranging from 15 to 20 indicated satisfactory dietary compliance, whereas scores below 15 signified non-compliance with food intake [6].
2.3.2. Medication Compliance
Medication-compliant patients adhered to the prescribed antidiabetic medications for seven days.
The Perceived Stress Scale was utilized to evaluate stress levels. This assessment included ten questions regarding participants' thoughts and feelings during the preceding four weeks. Each question had five potential responses: 0 for never, 1 for occasionally, 2 for seldom, 3 for frequently, and 4 for regularly. The stress score was subsequently calculated. Low stress was characterized by a score ranging from 0 to 13, moderate stress by a score from 14 to 26, and severe stress levels by scores between 27 and 40 [7, 8].
2.3.3. Microvascular Complications
Microvascular complications were characterized by the presence of at least one criteria of the following: a documented diagnosis of retinopathy, notification by an ophthalmologist regarding retinopathy, an estimated glomerular filtration rate of ≤ 60 ml/min/1.73m2, or a positive screening of neuropathy as a score of seven or higher on the Michigan Neuropathy Screening Instrument [3].
2.4. Data Collection Tools
2.4.1. Data Collection Questionnaire
The researchers developed a semi-structured questionnaire for data collection, consisting of four sections. The first section inquires about sociodemographic information like age, gender, education level, marital status, profession, and income. The second section gathered information about the disease, including duration, follow-up, type of medications, medication number, medication side effects, history of hospital admissions, history of complications, and compliance with the management plan. The third section provided information about diabetic care parameters, including weight, height, fasting blood glucose concentration, glycated hemoglobin concentration, low-density lipoprotein cholesterol (LDL-C), high-density lipoprotein cholesterol (HDL-C), triglycerides, and serum creatinine. The fourth section collected information about health behaviors such as smoking, stress, compliance with a healthy diet, and regular exercise. The questionnaire was validated through conducting Face Validity, Pilot test, and Clean Dataset.
A pilot study with 35 participants similar to the study population was conducted to evaluate the questionnaire's reliability and validity. This step analyzed the feasibility, appropriate wording, and ordering of questions, including the reliability. The final questionnaire achieved a Cronbach’s alpha of 0.80.
2.4.2. Clinical Measurements
2.4.2.1. Anthropometric Measurements
The body weight was measured and approximated to the nearest 0.5 kg while the patient was attired in light clothing and either barefoot or donning stockings. The measurement of height was conducted using a standard height board, wherein the headpiece was systematically lowered until it made contact with the patient's head, thereby establishing a perpendicular alignment with the measuring scale. The measurements were then approximated to the closest centimeter. The Body Mass Index (BMI) was calculated by dividing a patient's weight in kilograms by the square of their height in meters. The WHO standard categorizes BMI into three classifications: normal weight (18.50–24.99), overweight (25.00–29.99), and obesity (≥ 30) [9]. Blood pressure was measured thrice after the patient had been seated for at least 10 minutes [9].
2.5. Statistical Analysis
Data was analyzed using R Studio (R version 4.3.1). Frequencies and percentages were used to represent categorical data, whilst numerical data were conveyed as the median and interquartile range (IQR). The variables of glycemic control (good vs poor) and the existence of diabetes-related complications were analyzed using bivariate analyses to assess the differences based on demographic, clinical, and laboratory parameters using a Pearson's Chi-squared test or a Fisher's exact test for categorical variables, and the Wilcoxon rank sum test for numerical variables. Only independent variables demonstrating statistical significance (p < 0.05) were included to identify determinants or predictors of inadequate glycemic management. The results of the regression models were expressed as odds ratios (OR) and the respective 95% confidence intervals (95% CIs). Statistical significance was set at p < 0.05.
2.6. Ethical Considerations and Confidentiality
All participants were given oral and written explanations of the study and provided their consent before participation to be signed. As this research was conducted on humans, The Medical Ethics Committee at Umm Al Qura University approval (No. HAPO-02-K-012-2022-11-1220) was obtained to comply with the ethical regulations.
3. RESULTS
3.1. Sociodemographic and Clinical Characteristics
Data from 352 patients were included in this study. The demographic and clinical characteristics of the 352 T2DM patients attending primary healthcare in Makkah are summarized in Table 1. The majority were male (62.2%). The median age was 52.0 years (IQR: 43.0 - 60.0), with 46.0% employed. Education levels were predominantly medium (69.0%), and most were married (77.6%). Among the patients, 22.7% reported smoking, and the median BMI was 30.0 (IQR: 26.0 - 33.3). A family history of diabetes was reported by 40.9% of patients. Stress levels were primarily moderate (82.4%). Regarding lifestyle factors, 51.7% engaged in moderate exercise, and 37.2% had hypertension. The median systolic blood pressure (SBP) was 122.0 mmHg (IQR: 120.0 - 140.0), and the median diastolic blood pressure (DBP) was 80.0 mmHg (IQR: 70.0 - 85.0). Most patients (86.4%) had a diabetes duration of 2 years or more (Table 1).
| Parameter | Overall, N=352 |
Good Glycemic Control A1C <7 N=202 |
Poor Glycemic Control A1C≥7 N=150 |
p-value |
|---|---|---|---|---|
| Age | 52.0 (43.0 - 60.0) | 49.0 (41.0 - 58.0) | 55.0 (50.0 - 63.0) | <0.001 |
| Gender | - | - | - | <0.001 |
| Male | 219 (62.2%) | 106 (52.5%) | 113 (75.3%) | - |
| Female | 133 (37.8%) | 96 (47.5%) | 37 (24.7%) | - |
| Education | - | - | - | 0.023 |
| Low | 47 (13.4%) | 19 (9.4%) | 28 (18.7%) | - |
| Medium | 243 (69.0%) | 142 (70.3%) | 101 (67.3%) | - |
| High | 62 (17.6%) | 41 (20.3%) | 21 (14.0%) | - |
| Marital status | - | - | - | 0.039 |
| Single | 45 (12.8%) | 30 (14.9%) | 15 (10.0%) | - |
| Married | 273 (77.6%) | 146 (72.3%) | 127 (84.7%) | - |
| Divorced | 22 (6.3%) | 17 (8.4%) | 5 (3.3%) | - |
| Widowed | 12 (3.4%) | 9 (4.5%) | 3 (2.0%) | - |
| Job | - | - | - | 0.018 |
| Working | 162 (46.0%) | 82 (40.6%) | 80 (53.3%) | - |
| Not working | 190 (54.0%) | 120 (59.4%) | 70 (46.7%) | - |
| Smoking | 80 (22.7%) | 40 (19.8%) | 40 (26.7%) | 0.129 |
| BMI | 30.0 (26.0 - 33.3) | 30.0 (27.0 - 34.0) | 29.0 (26.0 - 32.7) | 0.052 |
| Family history | 144 (40.9%) | 59 (29.2%) | 85 (56.7%) | <0.001 |
| Stress | - | - | - | 0.129 |
| Low | 28 (8.0%) | 16 (7.9%) | 12 (8.0%) | - |
| Moderate | 290 (82.4%) | 172 (85.1%) | 118 (78.7%) | - |
| High | 34 (9.7%) | 14 (6.9%) | 20 (13.3%) | - |
| Diet Compliance | 78 (22.2%) | 40 (19.8%) | 38 (25.3%) | 0.217 |
| Physical activity | - | - | - | 0.937 |
| Vigorous | 54 (15.3%) | 32 (15.8%) | 22 (14.7%) | - |
| Moderate | 182 (51.7%) | 103 (51.0%) | 79 (52.7%) | - |
| Mild | 116 (33.0%) | 67 (33.2%) | 49 (32.7%) | - |
| Hypertension | 131 (37.2%) | 64 (31.7%) | 67 (44.7%) | 0.013 |
| SBP level | 122.0 (120.0 - 140.0) | 120.0 (115.0 - 133.8) | 130.0 (120.0 - 145.0) | <0.001 |
| DBP level | 80.0 (70.0 - 85.0) | 75.0 (70.0 - 80.0) | 80.0 (75.0 - 90.0) | <0.001 |
3.2. Prevalence of Suboptimal Glycemic Control
The frequency of glycemic control is shown in Fig. (1). It indicates that 42.61% of patients had suboptimal glycemic control (A1C ≥ 7) in this study, while the remaining 57.39% had good glycemic control (Fig. 1).
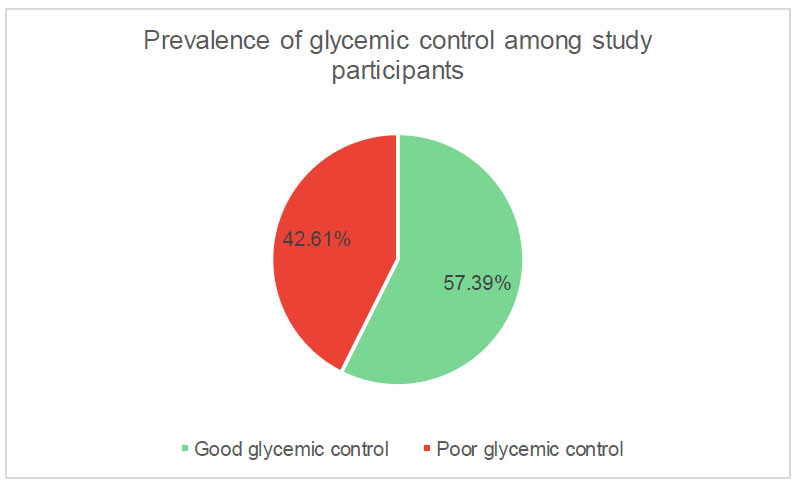
Proportions of glycemic control levels among patients.
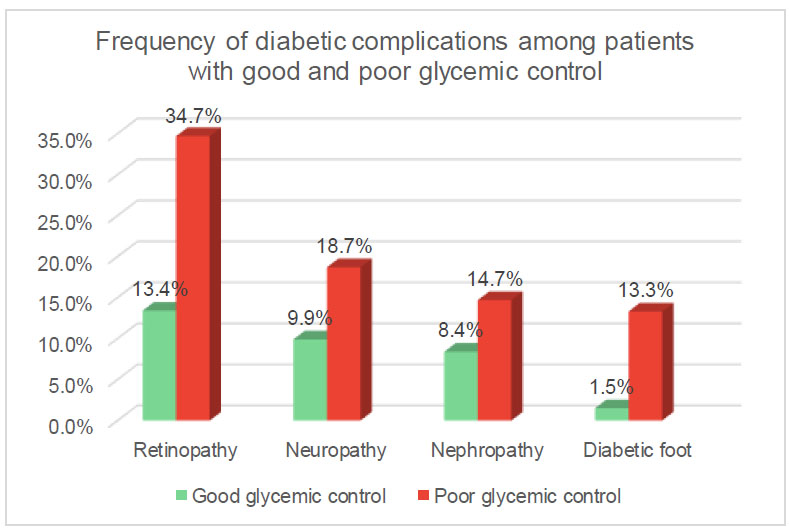
Diabetes-related complications.
3.3. Frequency of Diabetic Complications among Patients with Good and Poor Glycemic Control
A higher frequency of diabetic complications among patients with suboptimal glycemic control compared to those with reasonable control: retinopathy 34.7% vs. 13.4%, neuropathy 18.7% vs. 9.9%, nephropathy 14.7% vs. 8.4%, and diabetic foot 13.3% vs. 1.5% respectively (Fig. 2).
3.4. Relation of Sociodemographic and Clinical Characteristics and Glycemic Control
The analysis of demographic and clinical characteristics in diabetic patients revealed a significant gender difference (p < 0.001), with a higher proportion of male patients exhibiting suboptimal glycemic control (75.3%) compared to female patients who demonstrated good control (52.5%). Marital status showed a significant association (p = 0.039), indicating that married individuals had a higher prevalence of poor glycemic control (84.7% vs 72.3%). Employment status exhibited a statistically significant difference (p = 0.018), revealing a greater proportion of individuals with suboptimal glycemic control among the employed (53.3% compared to 40.6%). Furthermore, a family history of diabetes demonstrated a significant association with glycemic control (p < 0.001), as patients with such a history showed a higher prevalence of poor control (56.7% compared to 29.2%). Hypertension (HTN) exhibited a significant association (p = 0.013) with poor glycemic control, with 44.7% of patients with HTN experiencing inadequate control compared to 31.7% without HTN. Systolic and diastolic blood pressure exhibited significant differences (p < 0.001), reflecting elevated median values in patients with inadequate glycemic control.
3.5. Association between Demographic and Clinical Characteristics and Glycemic Control in Univariate Analysis
Patients with irregular follow-up demonstrated a statistically significant difference (p = 0.010), showing a greater prevalence of poor glycemic control (79.3%) compared to those with good control (66.8%). However, medication compliance demonstrated a significant association (p < 0.001), with poor control being more prevalent among non-compliant patients (63.3% vs 28.7%). Fasting blood sugar (FBS) exhibited a significant difference (p < 0.001), with a higher median value in patients with poor glycemic control (180.0 mg/dL) compared to those with good control (110.0 mg/dL). Neuropathy (p = 0.027), retinopathy (p < 0.001), and diabetic foot (p < 0.001) all showed significant associations, with higher proportions of these complications observed in patients with poor glycemic control (Table 2).
| Parameter | Glycemic Control | Regression Analysis | ||||||
|---|---|---|---|---|---|---|---|---|
| Univariable | Multivariable | |||||||
|
Good N=202 |
Poor N=150 |
OR | 95% CI | p-value | OR | 95% CI | p-value | |
| Age | 49.0 (41.0 - 58.0) | 55.0 (50.0 - 63.0) | 1.04 | 1.02, 1.06 | <0.001 | 1.01 | 0.98, 1.03 | 0.625 |
| Gender | - | - | - | - | - | - | - | - |
| Male | 106 (52.5%) | 113 (75.3%) | Reference | Reference | - | Reference | Reference | - |
| Female | 96 (47.5%) | 37 (24.7%) | 0.36 | 0.23, 0.57 | <0.001 | 0.64 | 0.32, 1.26 | 0.199 |
| Education | - | - | - | - | - | - | - | - |
| Low | 19 (9.4%) | 28 (18.7%) | Reference | Reference | - | Reference | Reference | - |
| Medium | 142 (70.3%) | 101 (67.3%) | 0.48 | 0.25, 0.91 | 0.025 | 0.85 | 0.32, 2.21 | 0.736 |
| High | 41 (20.3%) | 21 (14.0%) | 0.35 | 0.16, 0.75 | 0.008 | 0.39 | 0.12, 1.28 | 0.128 |
| Marital status | - | - | - | - | - | - | - | - |
| Single | 30 (14.9%) | 15 (10.0%) | Reference | Reference | - | - | - | - |
| Married | 146 (72.3%) | 127 (84.7%) | 1.74 | 0.91, 3.46 | 0.102 | - | - | - |
| Divorced | 17 (8.4%) | 5 (3.3%) | 0.59 | 0.17, 1.82 | 0.376 | - | - | - |
| Widowed | 9 (4.5%) | 3 (2.0%) | 0.67 | 0.13, 2.63 | 0.583 | - | - | - |
| Job | - | - | - | - | - | - | - | - |
| Working | 82 (40.6%) | 80 (53.3%) | Reference | Reference | - | Reference | Reference | - |
| Not working | 120 (59.4%) | 70 (46.7%) | 0.60 | 0.39, 0.91 | 0.018 | 0.49 | 0.25, 0.96 | 0.038 |
| Smoking | - | - | - | - | - | - | - | - |
| No | 162 (80.2%) | 110 (73.3%) | Reference | Reference | - | - | - | - |
| Yes | 40 (19.8%) | 40 (26.7%) | 1.47 | 0.89, 2.43 | 0.130 | - | - | - |
| BMI | 30.0 (27.0 - 34.0) | 29.0 (26.0 - 32.7) | 0.99 | 0.98, 1.00 | 0.166 | - | - | - |
| Family history | - | - | - | - | - | - | - | - |
| No | 143 (70.8%) | 65 (43.3%) | Reference | Reference | - | Reference | Reference | - |
| Yes | 59 (29.2%) | 85 (56.7%) | 3.17 | 2.04, 4.96 | <0.001 | 2.35 | 1.27, 4.43 | 0.007 |
| Stress | - | - | - | - | - | - | - | - |
| Low | 16 (7.9%) | 12 (8.0%) | Reference | Reference | - | - | - | - |
| Moderate | 172 (85.1%) | 118 (78.7%) | 0.91 | 0.42, 2.04 | 0.824 | - | - | - |
| High | 14 (6.9%) | 20 (13.3%) | 1.90 | 0.70, 5.35 | 0.213 | - | - | - |
| Compliance with diet | - | - | - | - | - | - | - | - |
| No | 162 (80.2%) | 112 (74.7%) | Reference | Reference | - | - | - | - |
| Yes | 40 (19.8%) | 38 (25.3%) | 1.37 | 0.83, 2.28 | 0.218 | - | - | - |
| Exercise | - | - | - | - | - | - | - | - |
| Vigorous | 32 (15.8%) | 22 (14.7%) | Reference | Reference | - | - | - | - |
| Moderate | 103 (51.0%) | 79 (52.7%) | 1.12 | 0.60, 2.09 | 0.728 | - | - | - |
| Mild | 67 (33.2%) | 49 (32.7%) | 1.06 | 0.55, 2.07 | 0.853 | - | - | - |
| Hypertension | - | - | - | - | - | - | - | - |
| No | 138 (68.3%) | 83 (55.3%) | Reference | Reference | - | Reference | Reference | - |
| Yes | 64 (31.7%) | 67 (44.7%) | 1.74 | 1.12, 2.70 | 0.013 | 0.85 | 0.42, 1.70 | 0.649 |
| SBP | 120.0 (115.0 - 133.8) | 130.0 (120.0 - 145.0) | 1.03 | 1.01, 1.04 | <0.001 | 0.99 | 0.96, 1.02 | 0.382 |
| DBP | 75.0 (70.0 - 80.0) | 80.0 (75.0 - 90.0) | 1.05 | 1.02, 1.07 | <0.001 | 1.04 | 0.99, 1.08 | 0.121 |
| Follow-up | - | - | - | - | - | - | - | - |
| Regular | 67 (33.2%) | 31 (20.7%) | Reference | Reference | - | Reference | Reference | - |
| Irregular | 135 (66.8%) | 119 (79.3%) | 1.91 | 1.17, 3.15 | 0.010 | 4.95 | 2.30, 11.4 | <0.001 |
| Duration of disease | - | - | - | - | - | - | - | - |
| <10 years | 93 (46.0%) | 50 (33.3%) | Reference | Reference | - | Reference | Reference | - |
| > 10 < 20 | 94 (46.5%) | 86 (57.3%) | 1.70 | 1.09, 2.68 | 0.021 | 1.83 | 0.93, 3.64 | 0.081 |
| ≥ 20 years | 15 (7.4%) | 14 (9.3%) | 1.74 | 0.77, 3.90 | 0.179 | 1.06 | 0.28, 3.96 | 0.928 |
| Type of medications | - | - | - | - | - | - | - | - |
| Oral | 174 (86.1%) | 115 (76.7%) | Reference | Reference | - | - | - | - |
| Insulin | 16 (7.9%) | 21 (14.0%) | 1.99 | 1.00, 4.02 | 0.052 | - | - | - |
| Combined | 12 (5.9%) | 14 (9.3%) | 1.77 | 0.79, 4.02 | 0.167 | - | - | - |
| Side effects of medications | - | - | - | - | - | - | - | - |
| No | 156 (77.2%) | 125 (83.3%) | Reference | Reference | - | - | - | - |
| Yes | 46 (22.8%) | 25 (16.7%) | 0.68 | 0.39, 1.16 | 0.159 | - | - | - |
| Medications compliance | - | - | - | - | - | - | - | - |
| Good | 144 (71.3%) | 55 (36.7%) | Reference | Reference | - | Reference | Reference | - |
| Poor | 58 (28.7%) | 95 (63.3%) | 4.29 | 2.75, 6.77 | <0.001 | 4.49 | 2.24, 9.28 | <0.001 |
| History of admission | - | - | - | - | - | - | - | - |
| No | 146 (72.3%) | 120 (80.0%) | Reference | Reference | - | - | - | - |
| Yes | 56 (27.7%) | 30 (20.0%) | 0.65 | 0.39, 1.07 | 0.097 | - | - | - |
| FBS | 110.0 (91.0 - 146.8) | 180.0 (136.0 - 210.0) | 1.01 | 1.01, 1.01 | <0.001 | 1.01 | 1.01, 1.02 | <0.001 |
| Triglycerides level | 170.0 (150.0 - 198.4) | 169.0 (150.0 - 198.4) | 1.00 | 0.99, 1.00 | 0.608 | - | - | - |
| LDL level | 110.0 (94.0 - 145.0) | 119.2 (94.0 - 145.8) | 1.00 | 1.00, 1.01 | 0.183 | - | - | - |
| HDL level | 31.0 (26.0 - 41.0) | 29.9 (26.0 - 43.5) | 1.00 | 0.98, 1.02 | 0.714 | - | - | - |
| Serum creatinine | 0.9 (0.7 - 0.9) | 0.9 (0.9 - 1.1) | 9.57 | 3.85, 27.8 | <0.001 | 8.06 | 1.98, 39.2 | 0.006 |
| Neuropathy | - | - | - | - | - | - | - | - |
| No | 182 (90.1%) | 122 (81.3%) | Reference | Reference | - | Reference | Reference | - |
| Yes | 20 (9.9%) | 28 (18.7%) | 2.09 | 1.13, 3.92 | 0.019 | 6.10 | 2.46, 15.8 | <0.001 |
| Not screened | 0 (0.0%) | 0 (0.0%) | - | - | - | - | - | - |
| Nephropathy | - | - | - | - | - | - | - | - |
| No | 185 (91.6%) | 128 (85.3%) | Reference | Reference | - | - | - | - |
| Yes | 17 (8.4%) | 22 (14.7%) | 1.87 | 0.96, 3.71 | 0.068 | - | - | - |
| Not screened | 0 (0.0%) | 0 (0.0%) | - | - | - | - | - | - |
| Retinopathy | - | - | - | - | - | - | - | - |
| No | 175 (86.6%) | 98 (65.3%) | Reference | Reference | - | Reference | Reference | - |
| Yes | 27 (13.4%) | 52 (34.7%) | 3.44 | 2.05, 5.89 | <0.001 | 1.38 | 0.53, 3.43 | 0.493 |
| Not screened | 0 (0.0%) | 0 (0.0%) | - | - | - | - | - | - |
| Diabetic foot | - | - | - | - | - | - | - | - |
| No | 199 (98.5%) | 130 (86.7%) | Reference | Reference | - | Reference | Reference | - |
| Yes | 3 (1.5%) | 20 (13.3%) | 10.2 | 3.41, 43.9 | <0.001 | 1.65 | 0.39, 8.66 | 0.512 |
| Not screened | 0 (0.0%) | 0 (0.0%) | - | - | - | - | - | - |
3.6. Predictors of Poor Glycemic Control in Multivariate Analysis
Importantly, being unemployed demonstrated protective effects against poor control (OR = 0.49, 95% CI 0.25 to 0.96, p < 0.038), while irregular follow-up exhibited a significant predictor (OR = 4.95, 95% CI 2.30 to 11.4, p = 0.001). Poor compliance with medications was associated with increased odds of suboptimal glycemic control (OR = 4.49, 95% CI 2.24 to 9.28, p < 0.001), as was a positive family history of diabetes (OR = 2.35, 95% CI 1.27 to 4.43, p = 0.007), elevated serum creatinine level (OR = 8.06, 95% CI 1.89 to 39.2, p = 0.006), and the presence of neuropathy (OR = 6.10, 95% CI 2.46 to 15.8, p < 0.001). Additionally, fasting blood sugar (FBS) levels showed a significant association, with each unit increase in FBS associated with 1% higher odds of suboptimal glycemic control (OR = 1.01, 95% CI 1.01 to 1.01, p < 0.001) (Table 2).
4. DISCUSSION
Ensuring glycemic regulation is crucial for postponing diabetic complications. Uncontrolled diabetes significantly increases the likelihood of complications, including retinopathy, nephropathy, neuropathy, and cardiovascular disease. Mitigating diabetes-related morbidity and mortality is contingent upon effective glycemic management. Achieving the glycemic target is the most effective method to postpone diabetes-associated problems [10].
This research evaluated the prevalence and factors influencing inadequate glycemic control in patients with T2DM within primary healthcare settings. The percentage of patients demonstrating suboptimal glycemic control was 42.61%, notably lower than results from previous studies in Saudi Arabia. The data revealed prevalence rates of 74.9% in Tabuk and 67.9% in Riyadh [11]. A comparable figure of 67.9% was observed in Al Hasa and 74% in Jazan [2, 12]. The declining rate of suboptimal diabetic control is encouraging; however, the prevalence remains concerning. The current study identified 42.61% of patients had suboptimal glycemic control, significantly lower than previous studies in Saudi Arabia, with rates of 74.9% in Tabuk and 67.7% in Riyadh. This decline could be associated with insufficient compliance with medical guidelines and a deficit in physical activity observed in the present study. A higher prevalence of inappropriate diabetes management has been recorded in several Arabian Gulf nations, with 73.6% exhibiting poor glycemic control [13].
On the other hand, 54.8% had suboptimal glycemic control in Thailand [14]. Prior research indicates a high incidence of inadequate glycemic control, raising considerable concerns as a result of the negative health effects experienced by people with poor diabetic control in Saudi Arabia and the wider Middle East. This discrepancy may be attributed to including patients with other types of diabetes mellitus, such as T1DM, and using various cut-off points for the HbA1c test in assessing blood glucose levels. Some studies have identified HbA1c levels of ≥ 7%, 8%, and 7% as cut-off points for patients exhibiting poor glycemic control. Additionally, heredity, environmental factors, and cultural differences may impact glycemic control. The current finding significantly exceeds that of developed countries, demonstrated by the 12.9% rate in the United States [15]. This mismatch may highlight variations in respondents' knowledge and lifestyles between developing and developed nations. This study underscores the necessity for enhanced diabetes management, with the maintenance of glycemic control as the principal therapeutic objective for all diabetes patients. This study found a strong correlation between age and inadequate glycemic control among the demographic and clinical variables assessed. Similar research found that advanced age was associated with suboptimal glycemic control [16]. Gender exhibited a notable difference, with a higher proportion of poor glycemic control observed among male patients than female patients. This finding aligns with a study conducted in Ethiopia, which revealed that male respondents had a 2.3 times higher likelihood of poor glycemic control than females [17]. This could be attributed to higher insulin resistance in males than females. However, certain research has shown that female gender is correlated with inadequate glycemic control [18].
Employment status showed a significant difference, indicating an increased prevalence of inadequate glycemic control among working participants. This finding contrasts with another study that reported a higher percentage of uncontrolled diabetes among unemployed or retired subjects [19]. This discrepancy may be because most jobs do not promote active exercise and rely on official and electronic work. The preventive effects of physical activity are well established since exercise promotes insulin sensitivity, reduces blood pressure, and improves plasma lipid profiles [4].
Patients exhibiting irregular follow-up demonstrated a 4.95-fold increased risk of suboptimal glycemic control in comparison to those maintaining regular follow-up. This finding aligns with previous research indicating that non-adherence to regular follow-up among patients correlates with an eightfold increased risk of poor glycemic control relative to adherent patients [20]. Furthermore, another study revealed that T2DM patients with regular follow-ups demonstrated better glycemic control than those without [21]. This observation may be explained by the fact that patients who do not consistently attend the diabetic clinic may exhibit noncompliance with self-care practices and medication regimens for diabetes. This research suggests that healthcare practitioners should emphasize the importance of regular visits to the diabetes clinic for patients to reduce glycemic levels and decrease the occurrence of complications.
An extended period of diabetes is related to suboptimal glycemic regulation, especially within the 10-20-year duration. A study indicated that having diabetes for over ten years exhibits an increased likelihood of insufficient glycemic control in comparison to individuals diagnosed for ten years or less [22]. Stressful lifestyles, high BMI, and smoking have been reported as factors associated with glycemic control [23]. However, in our investigation, these characteristics did not show any significant link with levels of diabetes control, potentially due to the predominance of nonsmokers among participants, the comparable mean BMI across the groups, and the majority experiencing moderate stress levels, with only a minority leading stressful lifestyles. Conversely, diabetes management was associated with the degree of patient education and marital status.
In multivariate regression analysis, this study identified independent predictors of poor glycemic control, including family history, employment, irregular follow-up, poor medication compliance, fasting blood sugar level, neuropathy, and elevated serum creatinine. Of these factors, family history is a non-modifiable risk factor that raises the probability of inadequately controlled diabetes, particularly when there is a familial predisposition to the condition. The current findings indicate that patients with irregular follow-ups have a 4.49-fold higher likelihood of poor glycemic control than those with regular follow-ups. This aligns with findings from an additional study [24]. It was observed that patients with T2DM who made optimal visits to diabetes clinics demonstrated good glycemic control and an improved quality of life. Additionally, another study indicated that T2DM patients who engaged in regular follow-ups exhibited better glycemic control than those who did not [21].
Evidence-based guidelines indicate that weight reduction, dietary modifications, and brief fasting are the best ways to improve glycemic control over the long run. Numerous dietary approaches are effective in reducing body weight and delaying diabetes. Engaging in low-intensity aerobic exercise immediately after meals, besides weight reduction, appears to be the most important element in improving glycemic control in individuals with diabetes, even though researchers are still finding novel nutritional techniques to achieve this goal [25].
CONCLUSION
Most participants in this study with T2DM in Makkah, Saudi Arabia, are experiencing difficulties effectively managing their blood glucose levels. Suboptimal glycemic management is linked to various factors, including personal attributes (advanced age and male gender), family history, employment, irregular follow-up, poor medication compliance, fasting blood sugar level, neuropathy, and elevated serum creatinine. Effective public health initiatives are essential for improving the quality of diabetes management systems for patients and primary healthcare providers.
FUTURE RESEARCH
To enable generalizability, further study is required to address glycaemic control in a broad context, such as the general population, assessing the relation between poor glycaemic control and genetic susceptibility and examining the best evidence-based intervention techniques for improving glycemic control.
THE LIMITATIONS OF THE RESEARCH
The study employed a cross-sectional design, which limits the ability to establish causal relationships that could be obtained better by longitudinal study design. Further follow-up with patients is necessary to validate predictions regarding poor diabetes control based on the collected data. The study was conducted exclusively in Makkah, particularly in primary healthcare settings, not including secondary or tertiary care, limiting the incorporation of the diversity of diabetic care management and the generalizability of the results to broader populations.
AUTHORS’ CONTRIBUTIONS
E.A., N.H., R.A., K.A.: Conceptualization and design; E.A., R.A., K.A.: Data collection; N.H., E.A.: Writing-original draft preparation; N.H., E.A.: Writing-review and editing. All authors reviewed the results and approved the final version of the manuscript.
LIST OF ABBREVIATIONS
| PHC | = Primary health care |
| LDL-C | = Low-density lipoprotein cholesterol |
| HDL-C | = Highdensity lipoprotein cholesterol |
| IQR | = Interquartile range |
ETHICS APPROVAL AND CONSENT TO PARTICIPATE
The Medical Ethics Committee at Umm Al Qura University, Saudi Arabia approval (No. HAPO-02-K-012-2022-11-1220). was obtained to comply with the ethical regulations.
HUMAN AND ANIMAL RIGHTS
All procedures performed in studies involving human participants were in accordance with the ethical standards of institutional and/or research committee and with the 1975 Declaration of Helsinki, as revised in 2013.
AVAILABILITY OF DATA AND MATERIALS
The data sets used and/or analysed during this study are available from the corresponding author [N.H] upon request.
ACKNOWLEDGEMENTS
The authors are sincerely grateful for the cooperation and participation of medical students, Ahmed Ibrahim Ewis and Merna Ibrahim Mohamed, in the data collection and entry. We are extremely grateful to the research team in primary health care institutions, which includes Marfat Mohammed Alnbat, Mansoor Saleh AlShamrani, Bashayr Duhayran Alkhaldi, and Nafeesah Ajing Garoot, for their assistance in the collection and management of blood samples of the patients in our study.

