All published articles of this journal are available on ScienceDirect.

Diagnostic Performance of the TyG Index in Detecting Metabolic Syndrome: A Cross-Sectional Study from Western Iran
Authors Info & Affiliations
Abstract
Background
Metabolic syndrome (MetS) is a prevalent condition characterized by a cluster of metabolic abnormalities, including abdominal obesity, dyslipidemia, hypertension, and impaired glucose metabolism. Early identification and screening are vital for effective management. The triglyceride-glucose (TyG) index, calculated from fasting triglyceride and glucose levels, is gaining recognition as a surrogate marker for insulin resistance and MetS. This study evaluates the TyG index as a standalone predictor of MetS risk and progression.
Methods
This cross-sectional analysis used baseline data from the Dehgolan Prospective Cohort Study (DehPCS), which included 3,800 participants aged 35–70 years from western Iran. MetS was defined using World Health Organization (WHO) criteria. The diagnostic performance of the TyG index, its variants, and anthropometric indices was assessed using regression analysis, receiver operating characteristic (ROC) curves, and the area under the curve (AUC).
Results
MetS prevalence in the study population was 35.19%. The TyG-WHtR (waist-to-height ratio) index demonstrated the highest AUC (0.86) in the total population, with sensitivity and specificity of 84.56% and 72.23%, respectively. In males, the TyG-WC (waist circumference) index showed the highest AUC (0.90, sensitivity: 79.29%, specificity: 85.04%). In females, the TyG index alone ranked highest with an AUC of 0.87 (sensitivity: 76.12%, specificity: 87.01%).
Discussion
The findings indicate that the TyG index combined with anthropometric measures is more effective for MetS diagnosis in the overall and male populations, while the TyG index alone is more valuable for females. These sex-based differences may stem from variations in body fat distribution and metabolic profiles. After adjusting for confounders, the TyG-WHtR remained the most reliable predictor for males and the overall population. The TyG index and its variants offer a reliable and accessible alternative to more complex insulin resistance measures.
Conclusion
The TyG index and its anthropometric variants demonstrated excellent diagnostic performance for MetS, underscoring their value as accessible, cost-effective screening tools—particularly in resource-limited settings. Further research is warranted to validate these findings across diverse populations.
1. INTRODUCTION
Metabolic Syndrome (MetS) is a common endocrine disorder associated with a high rate of complications and mortality. It is a prevalent, chronic condition related to physiological, biochemical, clinical, and metabolic factors, characterized by a combination of metabolic abnormali- ties, including abdominal obesity, high blood pressure, dyslipidemia, and impaired glucose metabolism. Recent lifestyle changes have increased the prevalence of this syndrome [1]. Various factors, such as age, gender, race, place of residence, and ethnicity, influence the prevalence of MetS, leading to varying rates from less than 10% to 84% in different populations [2]. In 2020, approximately 25.8 million children and 35.5 million adolescents worldwide were affected by MetS [1, 3].
MetS induces a chronic low-grade inflammatory state, leading to adipose tissue inflammation, which predisposes individuals to cardiovascular diseases, arthritis, and non-alcoholic fatty liver disease [4]. It also disrupts the antioxidant systems by overloading reactive oxygen species, causing DNA and protein modifications and lipid peroxidation [5]. Studies have identified insulin resistance (IR) as the link between metabolic and hemodynamic abnormalities in individuals with MetS [6]. IR plays a crucial role in the development of MetS and is one of its primary causes [7].
Given the importance of early diagnosis of MetS, various criteria and methods are used to assess an individual's condition. Identifying predictive parameters for the condition is essential for diagnosing and managing patients with MetS [8].
One method for measuring insulin resistance and MetS is the hyperinsulinemic-euglycemic glucose clamp technique, which is an invasive and time-consuming procedure. While it directly measures IR, its high cost limits its use in areas with high prevalence and among the general population [9]. The Homeostatic Model Assessment of Insulin Resistance (HOMA-IR) is another method for evaluating IR, using fasting glucose and insulin levels. Although accurate, its use is limited due to the lack of insulin availability in all laboratories and its high cost [10].
Considering the challenges and difficulties associated with these tests, the need to find an alternative marker without the requirement for insulin has become increasingly important [11]. Triglycerides and HDL-C, being readily available and cost-effective, can serve as suitable substitutes for insulin-requiring tests [10].
Recent studies have indicated that elevated triglyceride levels impair glucose metabolism in skeletal muscles, leading to insulin resistance. A new index called the Triglyceride-Glucose (TyG) index, derived from fasting plasma glucose (FPG) and fasting triglycerides (TG), has been developed as a potential alternative to IR with high sensitivity and specificity [12]. This index was first proposed and validated by Simental-Mendía and colleagues [13]. The TyG index is a simple tool that expresses insulin resistance and, due to its simplicity, availability, and low cost, serves as a good screening marker for MetS. Studies have shown that this index is associated with type 2 diabetes, hypertension, cardiovascular events, and fatty liver disease [14]. Recent studies have evaluated the performance of this index, and their results suggest that the TyG index performs similarly to HOMA-IR in measuring insulin resistance and is more accurate and effective than other tools in predicting and diagnosing MetS [15].
MetS is highly prevalent both globally and in Iran, underscoring the need for effective diagnostic and screening tools. While numerous indices have been developed and evaluated in recent studies, their comparative effectiveness remains an area of ongoing research. This study seeks to assess the diagnostic accuracy of the TyG index as a potential early detection tool for MetS.
2. MATERIALS AND METHODS
2.1. Study Design and Data Source
2.1.1. Study Population and Sample Size
This study was a cross-sectional analytical investigation that utilized data from the Dehgolan Prospective Cohort Study (DehPCS), which is a part of the Prospective Epidemiological Research Studies in Iran (PERSIAN) national study. DehPCS recruited 3,996 adults aged 35 to 70 years from the general population of Dehgolan City between February 2018 and March 2019 [16].
The sample size for this study was determined based on the expected prevalence of Metabolic Syndrome (MetS) in the target population. Previous studies conducted in Iran reported a MetS prevalence of approximately 35% [17]. To achieve a margin of error of ±3% with a 95% confidence level, a minimum sample size of 3,500 participants was required. Accounting for potential exclusions due to incomplete data or non-compliance, we recruited 3,996 participants from the Dehgolan Prospective Cohort Study (DehPCS).
Statistical power analysis was performed using STATA software version 17 to ensure the adequacy of the sample size for detecting statistically significant associations between the TyG index and MetS. The analysis confirmed that the sample size provided sufficient power (>80%) to detect meaningful differences in diagnostic accuracy across indices and subgroups. This rigorous approach ensures the reliability and robustness of our findings.
DehPCS aimed to determine the prevalence, mortality, and associated risk factors for non-communicable diseases in western Iran. Participants were permanent residents of Dehgolan city with at least one year of residency and Iranian citizenship. Individuals who were unable to communicate due to physical or mental disorders and those who declined to participate were excluded from the data analysis.
2.1.2. Data Collection and Measurements
Face-to-face interviews and physical examinations were conducted by trained teams using online software designed specifically for this study. Participants' ages were confirmed using official identification cards. Educational levels were evaluated based on the number of years of education and the highest completed educational degree. Information about smoking and alcohol consumption was obtained. A fasting blood sample (25 ml) and urine sample (at least 10 ml) were collected from each participant by experienced technicians and labeled. Weight and height were measured using a SECA scale and a stadiometer with an accuracy of 0.1 cm. Body Mass Index (BMI) was calculated by dividing weight (kg) by the square of height (m2).
2.1.3. Exposure Assessment
The primary exposure variable of interest is the TyG index, calculated using the formula 1 [13].
Formula 1: TvG index = Ln
 |
While both natural logarithm (Ln) and base-10 logarithm (Log10) can be used interchangeably, this study employs the natural logarithm (Ln), as it is more commonly used in metabolic studies involving the TyG index and provides a more direct relationship with the underlying biological processes.
Fasting blood samples collected during baseline visits are used for this calculation (Table 1). Additionally, the three measures of visceral fat were determined using the following equations (Detailed formulas are provided in Table 1) [18-20]:
| TyG Index | Ln[TG (mg/dL) * Fasting Glucose (mg/dL)/2] |
|---|---|
| TyG -BMI | TyG index * BMI |
| TyG -WC | TyG index * WC |
| TyG – WHpR (waist hip rate) | TyG index * WHpR |
| TyG – WHtR (waist circumference-to-height ratio) | TyG index * WHtR |
| Visceral adiposity index (VAI) | ((waistcircumference/ (36.58+(1.89* BMI))) *(TG /0.81) *(1.52/ HDL mmol)) for female subjects ((waistcircumference/ (39.68+(1.88* BMI))) *(TG /1.03) *(1.31/ HDL mmol)) for male subjects |
| Lipid accumulation product (LAP) | (Waist circumference in cm - 65) × (Triglyceride in mmol/L) for male subjects (Waist circumference in cm - 58) × (Triglyceride in mmol/L) for female subjects |
| Termed waist-triglyceride index (WTI) | Ln[TG (mg/dL) * Waist circumference (cm) /2] |
| Total (n=3865) | Male (n=1692) | Female (2173) | p-value | |
|---|---|---|---|---|
| Age (years) means ±SD | 48.34 ± 8.92 | 48.81 ± 8.89 | 47.98 ± 8.92 | 0.0045* |
| Education n(%) | ||||
| Illiterate | 1206 (31.20) | 181 (10.70) | 1025 (47.17) | <0.0001** |
| Middle school | 1075 (27.81) | 443 (26.18) | 632 (29.08) | |
| High school | 1086 (28.10) | 668 (39.48) | 418 (19.24) | |
| Academic | 498 (12.88) | 400 (23.64) | 98 (4.51) | |
| Marital status n(%) | ||||
| Single | 44 (1.15) | 4 (0.24) | 40 (1.87) | <0.0001** |
| Married | 3514 (91.80) | 1673 (98.88) | 1841 (86.19) | |
| Divorced - Widow | 270 (7.05) | 15 (0.89) | 255 (11.94) | |
| Smoking n(%) | 897 (23.69) | 762 (45.66) | 135 (6.37) | <0.0001** |
| Alcohol | 464 (12.13) | 421 (25.22) | 43 (1.99) | <0.0001** |
| Laboratory data (means ±SD) | ||||
| FBS(mg%) | 98.26 ± 32.40 | 97.08 ± 30.48 | 99.17 ± 33.80 | 0.046* |
| HDL (mg/dl) | 46.37 ± 11.04 | 44.09 ± 10.63 | 48.14 ± 11.03 | <0.0001* |
| LDL | 114.69 ± 32.87 | 111.65 ± 31.88 | 117.02 ± 33.43 | <0.0001* |
| Triglyceride (mg%) | 155.74 ± 100.83 | 163.89 ± 117.72 | 149.40 ± 84.90 | <0.0001* |
| Anthropometry | ||||
| Waist circumferenc(cm) | 97.27 ± 10.82 | 94.8 ± 10.49 | 99.19 ± 10.69 | <0.0001* |
| Hip circumference (cm) | 104.43 ± 8.21 | 102.48 ± 7.19 | 105.94 ± 8.63 | <0.0001* |
| WHpR | 0.93 ± 0.001 | 0.92 ± 0.001 | 0.93 ± 0.001 | <0.0001* |
| WHtR | 0.60 ± 0.001 | 0.55 ± 0.001 | 0.63 ± 0.001 | <0.0001* |
| SBP | 110.80 ± 18.88 | 111.40 ± 18.17 | 110.34 ± 19.40 | 0.082* |
| DBP | 69.37 ± 9.90 | 70.16 ± 10.21 | 68.77 ± 9.62 | <0.0001* |
| BMI | 28.01 ± 4.57 | 26.34 ± 4.06 | 29.31 ± 4.57 | <0.0001* |
| TyG index | 8.75 ± 0.62 | 8.78 ± 0.64 | 8.74 ± 0.61 | 0.049* |
| TyG -BMI | 246.05 ± 47.22 | 232.16 ± 43.97 | 256.87 ± 46.84 | <0.0001* |
| TyG -WC | 853.84 ± 125.20 | 834.59 ± 124.95 | 868.84 ± 123.35 | <0.0001* |
| TyG - WHpR | 8.16 ± 0.01 | 8.11 ± 0.02 | 8.19 ± 0.02 | 0.009* |
| TyG - WHtR | 5.28 ± 0.01 | 4.90 ± 0.01 | 5.57 ± 0.01 | <0.0001* |
| VAI | 2.73 ± 0.03 | 2.41 ± 0.05 | 2.98 ± 0.04 | <0.0001* |
| LAP | 65.88 ± 0.82 | 58.39 ± 1.30 | 71.69 ± 1.04 | <0.0001* |
| WTI | 8.77 ± 0.01 | 8.78 ± 0.01 | 8.77 ± 0.01 | 0.605* |
| MET | 39.29 ± 8.36 | 41.66 ± 11.50 | 37.46 ± 3.74 | <0.0001* |
| Mets n(%) | 1360 (35.19) | 368 (21.75) | 992 (45.65) | <0.0001** |
| Hypertension n(%) | 755 (19.62) | 218 (12.97) | 537 (24.77) | <0.0001** |
TyG Index: Reflects insulin resistance based on fasting triglycerides and glucose levels.
TyG-BMI: Adjusts the TyG index for overall body mass to account for general adiposity.
TyG-WC: Incorporates waist circumference to assess central obesity, a key component of MetS.
TyG-WHtR: Uses the waist-to-height ratio to provide a more accurate measure of abdominal fat distribution.
VAI (Visceral Adiposity Index): Estimates visceral fat accumulation based on waist circumference, BMI, triglycerides, and HDL levels.
LAP (Lipid Accumulation Product): Combines waist circumference and triglyceride levels to estimate lipid-related metabolic risk.
WTI (Waist-Triglyceride Index): Integrates waist circumference and triglyceride levels to assess metabolic risk [21].
2.1.4. Outcome Assessment
The primary focus of this research was the evaluation of Metabolic Syndrome (MetS). The diagnosis of MetS in participants was determined using laboratory results and clinical examinations based on the World Health Organization (WHO) guidelines. According to these guidelines, MetS is defined as the presence of insulin resistance or impaired glucose tolerance, accompanied by at least two of the following criteria:
Obesity:
Body mass index (BMI) > 30 kg/m2, and/or
Waist-to-hip ratio > 0.9 in men or > 0.85 in women.
Dyslipidemia:
Triglycerides > 150 mg/dL (1.7 mmol/L), and/or
High-density lipoprotein (HDL) cholesterol < 35 mg/dL (0.9 mmol/L) in men or < 39 mg/dL (1.0 mmol/L) in women.
Hypertension:
Blood pressure ≥ 140/90 mmHg.
Microalbuminuria:
Urinary albumin excretion rate ≥ 20 μg/min, or
Albumin-to-creatinine ratio ≥ 30 mg/g.
Participants meeting the diagnostic criteria were identified and categorized accordingly to facilitate statistical analyses of the TyG index and its anthropometric variants in predicting MetS [22, 23].
2.2. Statistical Analysis
After data collection and entry into STATA software version 17, data analysis commenced. Descriptive statistics, such as mean and standard deviation, were used to describe quantitative variables, while raw numbers, percentages, or frequencies were used to report qualitative data. To evaluate the association between the TyG index, other indices and MetS, a regression analysis was employed while considering potential confounding variables, including educational level, gender, occupation, underlying diseases, age, and smoking status. Moreover, the AUC (Area Under the Curve), sensitivity, and specificity were also calculated, together with their respective 95% confidence intervals, for the calculation of diagnostic parameters.
3. RESULTS
Overall, sufficient information on the TyG index and MetS was available for 3,865 participants (95.05%) from the DehPCS cohort, including 1,692 men and 2,173 women. The mean age of participants in the total population was 48.34 ± 8.92, with 48.81 ± 8.89 for males and 47.98 ± 8.92 for females. Of the total population studied, 1,360 individuals (35.19%) had MetS. The demographic and laboratory characteristics of the study groups are summarized in Table 2. In total, this study compared eight indices, with detailed information provided in Table 1. The mean values of these eight indices in the total population are as follows: TyG Index: 8.75 ± 0.62, TyG-BMI: 246.05 ± 47.22, TyG-WC: 853.84 ± 125.20, TyG-WHpR: 8.16 ± 0.01, TyG-WHtR: 5.28 ± 0.01, VAI: 2.73 ± 0.03, LAP: 65.88 ± 0.82, WTI: 8.77 ± 0.01 (Table 2).
Table 3 presents the overall association between the studied indices and MetS in this study. As shown, in the female population, the strongest association with MetS was observed for the TyG index (Adjusted OR 95% CI: 34.12 (24.82 - 46.90)), followed by the WTI index (Adjusted OR 95% CI: 32.48 (23.65 - 44.61)). For the male population, the strongest association was found for the TyG-WHtR index (Adjusted OR 95% CI: 21.56 (15.18 - 30.60)), with the WTI index ranking second (Adjusted OR 95% CI: 11.92 (8.81 – 16.14)) (Table 3).
Table 4 presents the results of comparing the predictive power of MetS and the AUC for different indices. In the total population, the highest AUC value of 0.86 with a sensitivity of 84.56 and specificity of 72.23 was observed for the TyG-WHtR index (95% CI: 0.85-0.87, p-value: <0.0001) (Table 4, Figs. 1 and 2). In the male population, the highest AUC of 0.90 with a sensitivity of 79.29 and specificity of 85.4 was found for the TyG-WC index (95% CI: 0.88-0.91, p-value: <0.0001). In the female population, the TyG index ranked first, with an AUC of 0.87, a sensitivity of 76.12, and a specificity of 87.1 (95% CI: 0.85-0.88, p-value: <0.0001) (Table 4, Figs. 1 and 2).
| Adjusted Odds Ratio (95%CI) | Adjusted Odds Ratio (95%CI) | |
|---|---|---|
| Women | Men | |
| TyG index | 34.12 (24.82 – 46.90)* | 10.38 (7.85 – 13.72)* |
| TyG -BMI | 1.02 (1.022 – 1.027)* | 1.04 (0.56 – 1.20)* |
| TyG -WC | 1.01 (1.010 – 1.013)* | 1.019 (1.01 – 1.02)* |
| TyG - WHpR | 7.27 (6.04 – 8.76)* | 8.78 (6.82 – 11.31)* |
| TyG - WHtR | 5.98 (5.00 – 7.14)* | 21.56 (15.18 – 30.60)* |
| VAL | 3.73 (3.30 – 4.21)* | 1.72 (1.58 – 1.86)* |
| LAP | 1.03 (1.02 – 1.03)* | 1.049 (1.044 – 1.05)* |
| WTI | 32.48 (23.65 – 44.61)* | 11.92 (8.81 – 16.14)* |
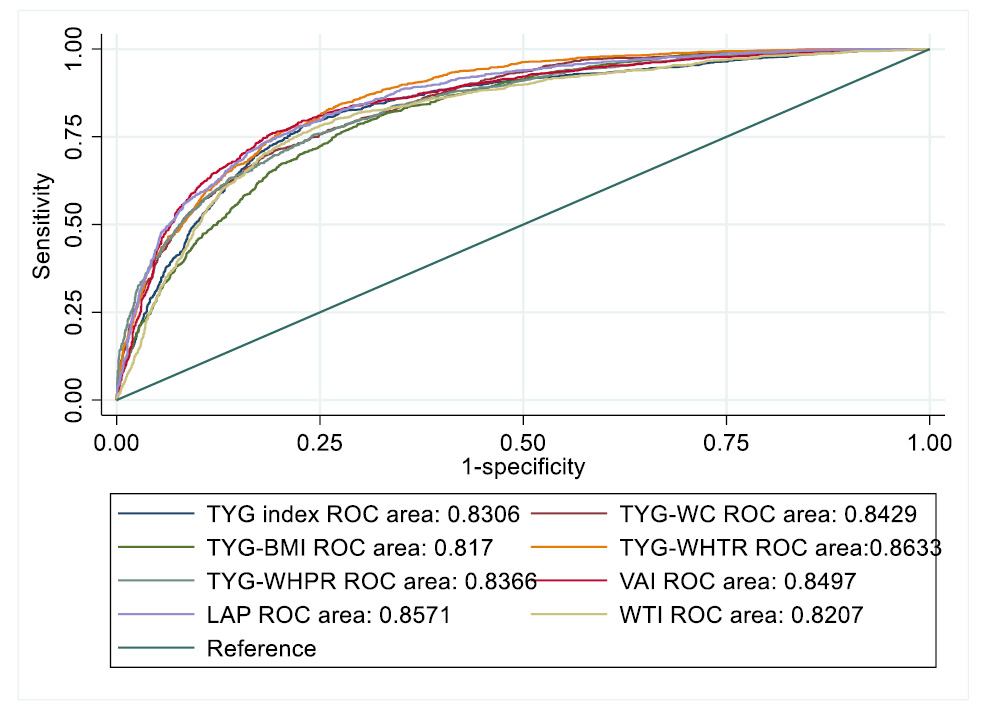
ROC curve for assessing the diagnostic value of all indices for predicting metabolic syndrome.
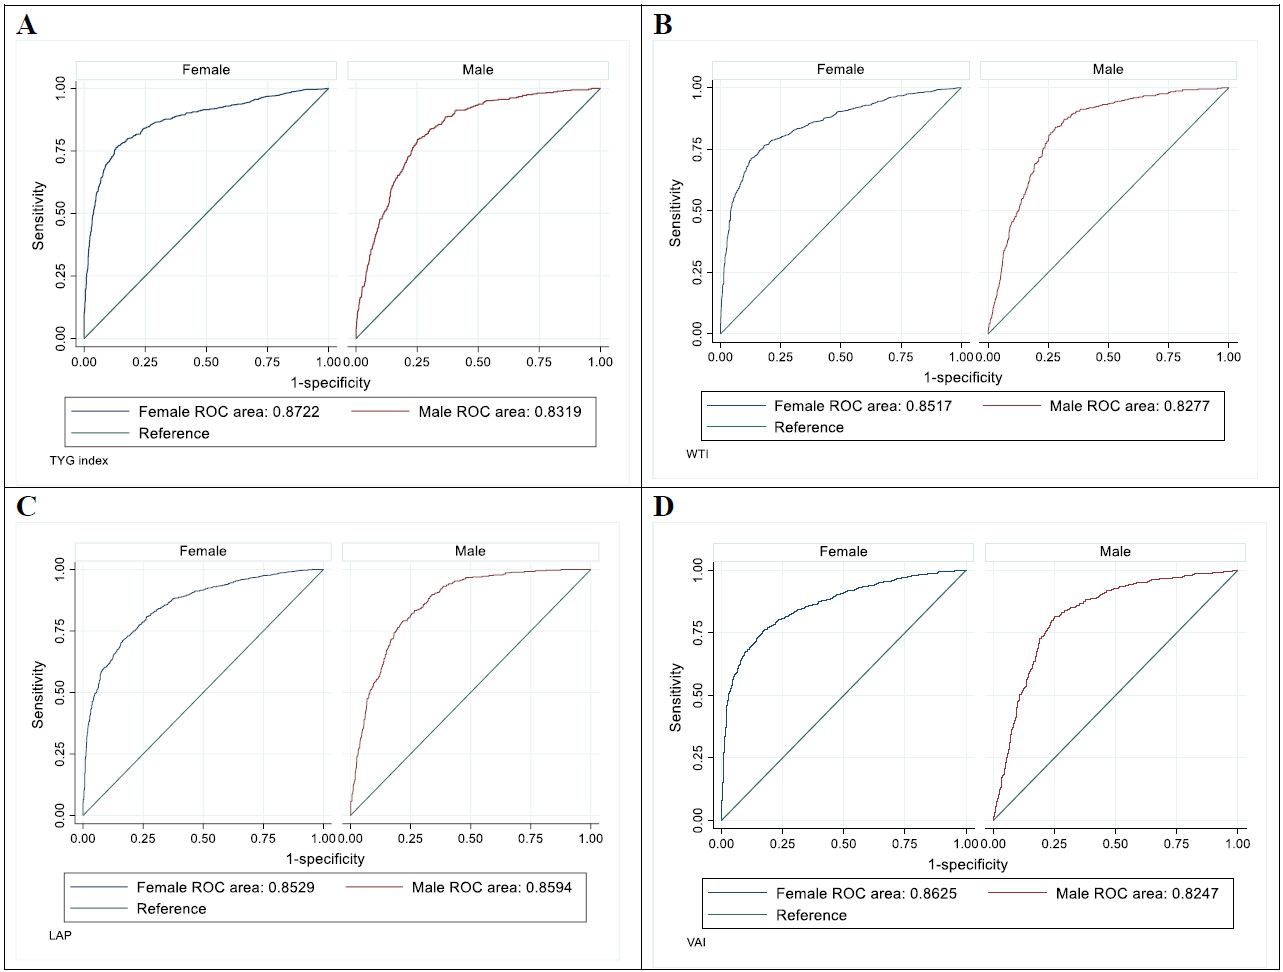
ROC curves for assessing the diagnostic value of various indices for predicting metabolic syndrome based on sex. (A) TYG (Triglyceride-Glucose) Index: ROC curves for females (AUC = 0.8722) and males (AUC = 0.8319). (B) WTI (Waist Triglyceride Index): ROC curves for females (AUC = 0.8517) and males (AUC = 0.8277). (C) LAP (Lipid Accumulation Product): ROC curves for females (AUC = 0.8629) and males (AUC = 0.8594). (D) VAI (Visceral Adiposity Index): ROC curves for females (AUC = 0.8625) and males (AUC = 0.8247).
| Variable | AUC | 95% CI | p-value | Sensitivity | Specificity | Youden Index |
|---|---|---|---|---|---|---|
| All participant | ||||||
| TyG index | 0.83 | 0.81 – 0.84 | <0.0001 | 78.65 | 76.56 | 0.55 |
| TyG -BMI | 0.81 | 0.80 – 0.82 | <0.0001 | 78.56 | 70.23 | 0.48 |
| TyG -WC | 0.84 | 0.82 – 0.85 | <0.0001 | 71.19 | 80.30 | 0.51 |
| TyG - WHpR | 0.83 | 0.82 – 0.84 | <0.0001 | 75.46 | 75.75 | 0.51 |
| TyG - WHtR | 0.86 | 0.85 – 0.87 | <0.0001 | 84.56 | 72.23 | 0.56 |
| VAI | 0.84 | 0.83 – 0.86 | <0.0001 | 76.00 | 80.78 | 0.56 |
| LAP | 0.85 | 0.84 – 0.86 | <0.0001 | 81.17 | 74.07 | 0.55 |
| WTI | 0.82 | 0.80 – 0.83 | <0.0001 | 75.98 | 76.95 | 0.52 |
| Male | ||||||
| TyG index | 0.83 | 0.81 – 0.84 | <0.0001 | 79.62 | 74.79 | 0.54 |
| TyG -BMI | 0.86 | 0.84 – 0.87 | <0.0001 | 84.20 | 71.68 | 0.55 |
| TyG -WC | 0.90 | 0.88 – 0.91 | <0.0001 | 79.29 | 85.04 | 0.64 |
| TyG - WHpR | 0.86 | 0.84 – 0.88 | <0.0001 | 80.93 | 78.17 | 0.59 |
| TyG - WHtR | 0.89 | 0.88 – 0.91 | <0.0001 | 86.65 | 76.79 | 0.63 |
| VAI | 0.82 | 0.80 - 0.84 | <0.0001 | 81.37 | 74.85 | 0.56 |
| LAP | 0.85 | 0.84 - 0.87 | <0.0001 | 79.18 | 78.13 | 0.57 |
| WTI | 0.82 | 0.80 - 0.84 | <0.0001 | 83.92 | 71.91 | 0.55 |
| Female | ||||||
| TYG index | 0.87 | 0.85 – 0.88 | <0.0001 | 76.12 | 87.01 | 0.63 |
| TYG-BMI | 0.76 | 0.74 – 0.78 | <0.0001 | 75.86 | 65.44 | 0.41 |
| TYG-WC | 0.81 | 0.79 – 0.82 | <0.0001 | 67.17 | 79.27 | 0.46 |
| TYG- WHpR | 0.84 | 0.82 – 0.85 | <0.0001 | 71.72 | 81.66 | 0.53 |
| TYG- WHtR | 0.81 | 0.79 – 0.83 | <0.0001 | 79.69 | 67.95 | 0.47 |
| VAI | 0.86 | 0.84 - 0.87 | <0.0001 | 75.43 | 83.22 | 0.58 |
| LAP | 0.85 | 0.83 - 0.86 | <0.0001 | 71.18 | 83.48 | 0.54 |
| WTI | 0.85 | 0.83 - 0.86 | <0.0001 | 71.41 | 86.95 | 0.58 |
4. DISCUSSION
The objective of this study was to investigate the connection between the TyG index (generated using triglycerides and glucose levels) and the presence of metabolic syndrome (MetS) and to assess the diagnostic accuracy of the TyG index and similar tools. From the Dehgolan cohort data, it was discovered by researchers that MetS was present in 35.19% of participants. Among the entire group, the TyG-WHtR index scored the highest AUC of 0.86, along with 84.56% sensitivity and 72.23% specificity. Among men, the TyG-WC index had the top AUC of 0.90, along with a sensitivity of 79.29% and specificity of 85.4%. On the other hand, the TyG index by itself was the top performer in women, achieving an AUC of 0.87, sensitivity of 76.12%, and specificity of 87.1%. These results indicate that the combination of anthropometric indices and the TyG index is more effective for diagnosis in the overall and male populations, whereas the TyG index on its own is more valuable for diagnosing females. After accounting for potential factors that could affect the results, the TyG index exhibited the highest OR among women, affirming its better overall performance.
The increasing prevalence of Metabolic Syndrome (MetS) in Iran aligns with global trends and is largely driven by urbanization, lifestyle changes, and dietary shifts over the past few decades [3, 24, 25]. Studies suggest that the prevalence of MetS in Iran has been rising steadily since the early 2000s, with significant increases observed in urban populations [25]. Unfortunately, detailed incidence data over time is limited, but longitudinal studies such as the Tehran Lipid and Glucose Study (TLGS) have documented this upward trend [26-29]. This highlights the urgent need for effective diagnostic tools to identify and manage MetS in high-risk populations.
The variation in diagnostic accuracy could be attributed to differences in body fat distribution between sexes and the potential impact of visceral fat on MetS development, along with hormonal and metabolic disparities between males and females. Recent studies have highlighted the protective role of gluteal-femoral fat against metabolic disorders, including insulin resistance, type 2 diabetes, and cardiovascular diseases [30]. This underscores the importance of considering fat distribution patterns when evaluating MetS risk.
Our results align with similar studies that have indicated the TyG index and related tools can serve as better predictors for MetS compared to other indices. For instance, in the total population of this study, the AUC for the TyG Index was 0.83, which is consistent with studies on different populations in Pakistan (Khan et al., 2018) [31], South Korea (Lee et al., 2015) [32], and Nigeria (Raimi et al., 2021) [33], further demonstrating the high diagnostic power of this index across diverse populations. The study by Lee et al. (2015) [32] in the South Korean population, which compared the TyG Index results between female and male populations, not only showed remarkable similarity to our findings but also demonstrated slightly higher values in the female population. This observation further corroborates the higher diagnostic power of the TyG Index, particularly in the female population, as observed in our study.
Given the cultural and legal restrictions on alcohol consumption in Iran, it was not included as a covariate in this study. As a result, non-alcoholic fatty liver disease (NAFLD) observed in our population is likely unrelated to alcohol use and is instead driven by metabolic factors such as insulin resistance, obesity, and dyslipidemia. This distinction is critical, as NAFLD in Iran is primarily a consequence of metabolic abnormalities rather than alcohol-related liver damage [34, 35].
It is important to note that insulin resistance (IR) plays a crucial role in the development of MetS and is one of its primary causes. The TyG index, derived from fasting triglyceride and glucose levels, has been shown to be a reliable marker for IR. By providing an inexpensive alternative to more invasive and costly methods like the hyperinsulinemic-euglycemic glucose clamp technique or HOMA-IR, the TyG index can facilitate the assessment of IR and aid in the early detection and management of MetS, particularly in resource-limited settings [7, 31, 33, 36-38].
While the TyG Index exhibited high diagnostic power, it ranked fifth compared to anthropometric indices in the total population in our study. This finding is consistent with the study by Lim et al. (2019) [38], which reported similar results. Additionally, in a study by Raimi et al. (2021) on the Nigerian population [33], the highest AUC in the total population was associated with the TyG-WHtR index, supporting our observation that the combination of the TyG index with anthropometric indices has higher diagnostic power compared to the TyG index alone. This relationship between anthropometric characteristics and the occurrence of MetS is plausible, as abdominal adiposity, a key component of MetS [39, 40], comprises both subcutaneous and visceral fat [41]. The visceral fat component, due to its higher production of inflammatory cytokines, adipokines, and free fatty acids, is more closely associated with cardiovascular diseases and insulin resistance, which are crucial components of MetS [42, 43]. Although the TyG-WC index had the highest AUC in the male population, and the TyG-WHtR index ranked second, after adjustment for potential confounding variables, the highest OR in the male population was observed for the TyG-WHtR index. Considering this, it can be inferred that the TyG-WHtR index is ultimately the best diagnostic index for both the male and total populations. The reason behind this result can be explained by the fact that both waist circumference (WC) and waist-to-height ratio (WHtR) are measures of abdominal fat accumulation, which is a crucial factor contributing to the development of MetS. The superior performance of WHtR over WC may be attributed to its consideration of an individual's height in addition to their waist circumference, providing a more accurate assessment of abdominal obesity [44, 45].
LIMITATIONS AND FUTURE DIRECTIONS
Despite the valuable insights obtained from this study, several limitations must be acknowledged. First, the study population consisted predominantly of Kurdish individuals residing in western Iran, which may limit the generalizability of the findings to other ethnic or geographic groups. Future studies should include more diverse populations to validate the applicability of the TyG index across different demographics. Second, the cross-sectional design of the study precludes causal inferences, and longitudinal studies are needed to assess the predictive power of the TyG index for long-term health outcomes, such as cardiovascular disease and type 2 diabetes. Third, the lack of complete data on medication use or self-administered drugs that could influence MetS components introduces potential confounding factors. Finally, while the TyG index demonstrated high diagnostic accuracy, its performance may vary depending on the criteria used to define MetS (e.g., WHO vs. IDF definitions). Addressing these limitations in future research will strengthen the evidence base and improve the clinical utility of the TyG index.
CONCLUSION
In conclusion, this cross-sectional analysis from the Dehgolan Prospective Cohort Study (DehPCS) demonstrates the diagnostic utility of the TyG index and its anthropometric variants for detecting Metabolic Syndrome (MetS). The TyG index exhibited high diagnostic accuracy, particularly in females, achieving an AUC of 0.87. Incorporating anthropometric measures further enhanced diagnostic performance, with the TyG-WHtR index (AUC 0.86) and TyG-WC index (AUC 0.90) showing the highest diagnostic value in the total and male populations, respectively. These findings highlight the potential of the TyG index, both as a standalone tool and when combined with anthropometric parameters, as a cost-effective screening method for early detection of MetS.
The study underscores the importance of considering sex-specific differences in diagnostic accuracy, as the TyG index alone performed better in women, while indices incorporating waist circumference or waist-to-height ratio were superior in men. This variation likely reflects differences in body fat distribution and metabolic profiles between genders. Additionally, the results align with prior studies conducted in diverse populations, reinforcing the generalizability of the TyG index as a reliable marker for insulin resistance and MetS.
Despite these promising findings, several limitations must be acknowledged. First, the study was conducted in a Kurdish population, which may limit the generalizability of the results to other ethnic groups. Second, the cross-sectional design precludes causal inferences, and longitudinal studies are needed to validate these findings over time. Third, the lack of data on medication use or self-administered drugs that could influence MetS components introduces potential confounding factors. Future research should address these gaps by conducting prospective cohort studies in diverse populations, incorporating detailed medication histories, and exploring the predictive power of the TyG index for long-term health outcomes such as cardiovascular disease and type 2 diabetes.
In clinical practice, the TyG index represents a promising, accessible biomarker for risk stratification and management of MetS, especially in resource-limited settings where more invasive or costly methods like HOMA-IR are not feasible. Its simplicity, low cost, and high diagnostic accuracy make it a valuable tool for early identification and intervention. However, further validation across diverse populations and healthcare systems is warranted to establish its broader applicability. By integrating the TyG index into routine clinical assessments, healthcare providers can enhance early detection and management of MetS, ultimately reducing the global burden of this prevalent metabolic disorder
AUTHORS' CONTRIBUTIONS
Authors M. Afshar, M. Afraie, FM and YM designed the study. M. Afshar, FM and YM participated in the conception of the study. M. Afraie, M Azami, KZ, FM and YM managed and conducted the statistical analyses and interpreted the data. M. Afshar prepared the first draft and FM and YM revised it to make the final manuscript. All authors approved the final manuscript.
LIST OF ABBREVIATIONS
| MetS | = Metabolic Syndrome |
| TyG | = Triglyceride-Glucose |
| WHO | = World Health Organization |
| IR | = Insulin Resistance |
| DehPCS | = Dehgolan Prospective Cohort Study |
| PERSIAN | = Prospective Epidemiological Research Studies in Iran |
| ROC | = Receiver Operating Characteristic |
| AUC | = Area Under the Curve |
| BMI | = Body Mass Index |
| WC | = Waist Circumference |
| WHpR | = Waist-to-Hip Ratio |
| WHtR | = Waist-to-Height Ratio |
| VAI | = Visceral Adiposity Index |
| LAP | = Lipid Accumulation Product |
| WTI | = Waist-Triglyceride Index |
| HDL | = High-Density Lipoprotein |
| LDL | = Low-Density Lipoprotein |
| FPG | = Fasting Plasma Glucose |
| TG | = Triglycerides |
| OR | = Odds Ratio |
| CI | = Confidence Interval |
| HOMA-IR | = Homeostatic Model Assessment of Insulin Resistance |
ETHICS APPROVAL AND CONSENT TO PARTICIPATE
The protocol and ethical considerations were formally reviewed and approved by the Ethics Committee of Kurdistan University of Medical Sciences, Iran under the approval code IR.MUK.REC.1404.032.
HUMAN AND ANIMAL RIGHTS
All procedures performed in studies involving human participants were in accordance with the ethical standards of institutional and/or research committee and with the 1975 Declaration of Helsinki, as revised in 2013.
CONSENT FOR PUBLICATION
All participants provided written, informed consent prior to enrollment, affirming their voluntary participation and understanding of the study’s objectives, procedures, and potential risks/benefits.
AVAILABILITY OF DATA AND MATERIALS
This study utilized data from the Dehgolan Prospective Cohort Study (DehPCS), a subset of the national PERSIAN cohort, which recruited 3,996 adults aged 35 to 70 years from the general population of Dehgolan City between February 2018 and March 2019.
ACKNOWLEDGEMENTS
Declared none.

