All published articles of this journal are available on ScienceDirect.

A Cross-Sectional Study of the Impact of Knowledge, Medication Adherence, and Illness Acceptance on the Quality of Life in Hypertensive Patients
Authors Info & Affiliations
Abstract
Background
Hypertension is a major noncommunicable disease globally, affecting patients' quality of life due to changes in lifestyle and socio-psychological factors. Identifying key determinants of quality of life in hypertensive patients can aid targeted interventions.
Aim
This study aims to examine the impact of hypertension knowledge, medication adherence, and illness acceptance on the quality of life of hypertensive patients in Lhoks
eumawe, Aceh, Indonesia.
Methods
A cross-sectional study was conducted with 429 hypertensive patients using structured questionnaires. Data were analyzed using Structural Equation Modeling (SEM) with AMOS software version 22 to evaluate relationships among variables.
Results
Knowledge about hypertension (p < 0.001), medication adherence (p < 0.001), and illness acceptance (p = 0.003) significantly influenced quality of life, while demographic factors did not (p = 0.173). The model fit analysis confirmed the SEM model's adequacy.
Conclusions
Hypertension knowledge, medication adherence, and illness acceptance play critical roles in improving quality of life. These findings highlight the need for educational and emotional support interventions tailored to hypertensive patients.
1. INTRODUCTION
Hypertension is one of the major non-communicable diseases (NCDs), and cases of it are increasing worldwide. Hypertension causes premature death. A total of 1.28 billion adults are recorded to have hypertension, most of whom are residents of middle- to low-income countries [1]. Approximately 46% of adult hypertensive patients are unaware of their condition, while the remaining individuals are aware that they have hypertension. In Southeast Asia, the prevalence of hypertension varies, with Indonesia reporting a rate of approximately 34.1% among the adult population, which is higher than some neighboring countries such as Malaysia (30%) and Thailand (25%). In addition to affecting individual health, uncontrolled hypertension also imposes a significant economic burden on both patients and the national healthcare system. Previous studies have shown that the cost of treating diseases resulting from hypertension complications, such as stroke and coronary heart disease, continues to rise each year, especially in developing countries. Furthermore, the long-term complications of hypertension can lead to a decline in quality of life, lifelong dependence on medication, and an increase in premature mortality rates [2].
In Indonesia, the prevalence of hypertension among household members diagnosed by a doctor or currently taking antihypertensive medication is 8.84%. Among these hypertensive patients, 13.33% do not take any antihypertensive medication, 32.27% are nonadherent to medication, and 54.4% adhere to medication. The reasons for not taking medication include feeling healthy, irregular visits to health facilities, consumption of traditional medicine, forgetting to take medication, inability to afford medication, experiencing side effects from medication, and unavailability of hypertension medication in health facilities [3]. Feeling healthy is the most common reason for not taking the medication.
People with hypertension experience changes in their lifestyle and physical, psychological, and social interactions with others. This change also affects their quality of life. Therefore, a deeper understanding of the factors influencing the quality of life of hypertension patients is crucial for more effective prevention and management efforts. Several factors that affect the patients' quality of life include the individual’s level of knowledge of the disease, acceptance of the disease, adherence to medication [4], and their socio-demographic characteristics. Medication adherence is positively associated with quality of life for hypertension patients [5], while the acceptance of the disease could improve their quality of life [6]. Lastly, better knowledge about hypertension also has a significant effect on the quality of life of hypertension patients [7].
The quality of life of hypertensive patients is also associated socio-demographic characteristics of the respondents. A higher level of education should help improve the patient’s quality of life [8]. On the other hand, older age tends to reduce quality of life [9], as do higher body mass index (BMI) [10] and larger waist circumference. Therefore, it is important to consider respondents' characteristics when estimating the determinants of their quality of life.
Structural equation modelling (SEM) is a multivariate statistical analysis usually used to comprehensively see the correlation or significance between variables. SEM can be defined as a multivariate quantitative method used to explain the relationships among observed variables [11]. The SEM method is relevant for determining the factors that affect the quality of life of hypertension patients. To measure the latent variable, indicator variables are needed. This is because latent variables cannot be measured directly and require indicator variables that form this latent variable [12].
2. MATERIALS AND METHODS
2.1. Study Setting
This cross-sectional study was conducted to analyze the relationship between the level of knowledge, medication adherence, acceptance of hypertension patients, and respondent demographics. This study was conducted in Lhokseumawe City, Aceh Province, Indonesia, involving respondents from healthcare facilities in urban areas. The sample was representative of the urban hypertensive population, making the findings more relevant for regions with similar characteristics. The study was carried out from March to July 2023 with ethical approval obtained from the Ethics Committee of the Faculty of Nursing, Universitas Syiah Kuala (approval number: 113020301221). Respondents who met the inclusion criteria were selected using random sampling and provided informed consent by signing the consent form. The sample consisted of voluntary respondents who agreed to undergo examination and complete the researcher’s questionnaire, which may have introduced potential bias.
A total of 429 respondents participated in the data collection process, comprising 344 females with a mean age of 56.14 years and 85 males with a mean age of 59.47 years. Sex was recorded as part of demographic characteristics, but no sex-based subgroup analyses were conducted in this study. We have followed the SAGER (Sex and Gender Equity in Research) guidelines in our study, which included both male and female participants.
2.2. Analytic Strategy and Measures
Structural equation modelling (SEM) involves two types of variables: latent variables (unobserved variables) and manifest or indicator variables (observed variables). Latent variables are defined as variables that cannot be directly measured or observed but must be measured by breaking them down into several indicators. Latent variables consist of exogenous latent variables (independent variables) and endogenous latent variables (dependent variables) [11-14]. On the other hand, indicator variables can be directly measured and constitute the variables that make up the latent variables.
2.2.1. Exogenous Variables
Exogenous latent variables include knowledge about hypertension, medication adherence, acceptance of illness, and demographics. The hypertension knowledge variable consists of 22 question items [15]. The scores for the questions are given a value of 1 if the respondent answers correctly and 0 if the answer is wrong. There are five indicator variables in the knowledge about hypertension (α reliability 0.82): definition and diet (α reliability 0.92 to definition and 0.72 to diet), medical treatment (α reliability 0.59), medication adherence (α reliability 0.67), lifestyle (α reliability 0.77), and complications (α reliability 0.76) [16]. Higher values indicated better knowledge about hypertension. The medication adherence was examined using 8 question items of the Medication Adherence Scale (α reliability 0.83) [17, 18]. The answers to questions 1 to 7 were coded as 'yes' = 0 and 'no' = 1, while question 8 was scored on a scale from 1 to 5. A total score below 6 was considered low, a score of 6 to 8 was considered moderate, and a total score above 8 was considered high. A higher score indicated better adherence to medication [19].
Furthermore, the acceptance of illness variable consists of 8 questions where the respondent's answers follow a Likert scale (α reliability 0.85). A total score below 20 points was considered low, a total score of 20 to 30 points was moderate, and a total score over 30 was considered high [6]. Lastly, the respondent's demographic variable consisted of four indicators: education, age, body mass index, and waist circumference. These variables were measured on ratio scales, and a weighting was assigned to each indicator.
2.2.2. Endogenous Variable
The endogenous latent variable in this research is the quality of life. The quality of life variable comprises 26 question with respondents using a Likert scale (α reliability 0.95). These questions are combined into four indicators. There are four indicator variables in quality of life: physics (7 item questions), psychological (6 item questions), social relations (3 item questions), and environment (8 item questions) [20]. The values of each indicator, which contains several question items, are then averaged and rounded off.
2.3. Analytic Steps
The data analysis in this study was conducted using Microsoft Excel and AMOS software version 22. The stages of data analysis procedures carried out in this study are as follows:
2.3.1. Data Preparation
Data preparation began by performing data cleaning, categorizing, assigning a score weight to each indicator, and grouping several questionnaire items into an indicator for the exogenous latent variable and the endogenous variable.
2.3.2. Data Analysis
Data analysis was conducted using descriptive statistics and inferential statistics. Descriptive statistics aim to display or provide an overview of the data used through several methods, such as summary data, graphs, and diagrams. Inferential statistics are used to analyse the data with more advanced methods to reach a conclusion. In this study, the inferential statistics used were the structural equation modelling (SEM) method with the help of AMOS software version 22. Before hypothesis testing, several steps needed to be taken, such as developing a theoretical model, developing a path diagram, converting the path diagram to measurement and structural equations, testing assumptions, model fit, and modifying the model if necessary.
| Demography | Category | Frequency (n) | Percentage (%) |
|---|---|---|---|
| Sex | Male | 85 | 19,8 |
| Female | 344 | 80,2 | |
| Marital status | Marry | 424 | 98,8 |
| Unmarried | 5 | 1,2 | |
| Employment status | Work | 120 | 28,0 |
| Not working | 309 | 72,0 | |
| Age | Early adulthood (26-35 years) | 12 | 2,8 |
| Late adult (36-45 years) | 48 | 11,2 | |
| Early elderly (46-55 years) | 127 | 29,6 | |
| Late seniors (56-65 years) | 148 | 34,5 | |
| Seniors (> 65 Years Old) | 94 | 21,9 | |
| Education | College | 48 | 11,2 |
| SMA | 158 | 36,8 | |
| Graduated from elementary and junior high school | 202 | 47,1 | |
| Not going to school | 21 | 4,9 | |
| Body mass index | Underweight (< 18.5) | 23 | 5,4 |
| Normal weight (18.5-22.9) | 76 | 17,7 | |
| Weight loss risks (23-24.9) | 68 | 15,9 | |
| Obesity I (25-29.9) | 159 | 37,1 | |
| Obesity II (≥ 30) | 103 | 24,0 | |
| Waist circumference | Normal | 99 | 23,1 |
| Tidak normal | 330 | 76,9 |
3. RESULTS
Among the participants, 344 were female (80.2%) and 85 were male (19.8%). No statistical comparisons were made between male and female participants, as this was not within the scope of this study. Most hypertension patients in this study were female (80.2%), married (98.8%), and the majority of them did not work (72%). In addition, most of them were in the age range of 56 to 65 years (34.5%), followed by patients aged 46 to 55 years (29.6%). In terms of education, most patients had completed elementary school and junior high school (47.1%). Moreover, the body mass index (BMI) of the majority of patients was in the category of Obesity I (37.1%). A detail of descriptive statistics of the respondents' demographic can be found in Table 1.
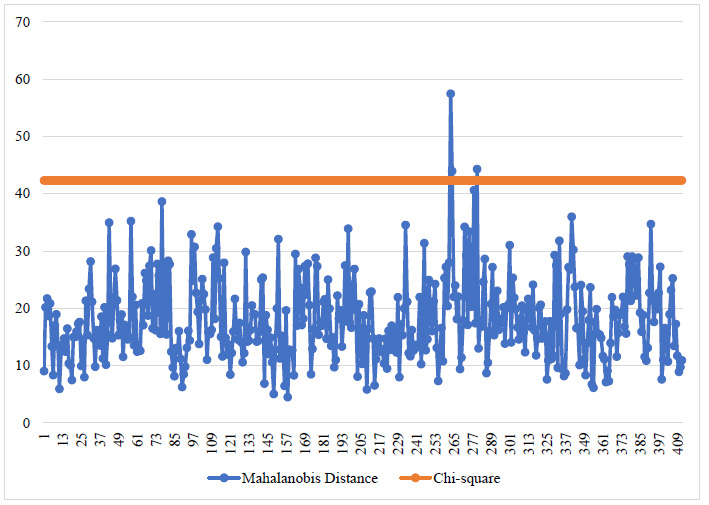
3.1. Multivariate Outlier Detection Visualization
Descriptive analysis using a multivariate outlier line graph is used to determine whether there are multivariate outliers in the research data. Multivariate outliers are detected by comparing the Mahalanobis distance value with the χ2(18;0,001) value, which is 42.312. Fig. (1) shows that three respondents have values above 42.312, indicating that the data are multivariate outliers.
3.1.1. Inferential Analysis
Structural equation modelling is an inferential statistical analysis used in this study. Before hypothesis testing, several steps need to be taken, such as developing a theoretical model, developing a path diagram, converting the path diagram into a measurement and structural equations, testing assumptions, checking model fit, and modifying the model if necessary.
3.1.2. Converting a Path Diagram into Model Equations
Based on the conceptual model that has been developed, the measurement model for each exogenous latent variable and endogenous latent variable, as well as the structural equation model equation (1), are obtained as follows:
1) Measurement Models
The measurement model can be seen in Table 2.
2) Structural Models
 |
(1) |
where γ is the estimated parameter value of the latent variable, and ζ is the error in the structural model.
3.1.3. Types of Input Matrices and Model Estimation
In AMOS version 22 software, the type of input matrix used is the covariance matrix, while the model estimation uses the maximum likelihood estimator (MLE). This is because, in this study, a sufficiently large sample of 429 was used, therefore, the model estimation employed by the structural equation modelling method is the MLE.
| Latent Variables | Measurement Model |
|---|---|
| Knowledge of hypertension (ξ1) | 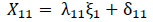 |
 |
|
 |
|
 |
|
 |
|
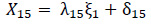
| Medication Adherence (ξ2) | 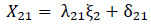 |
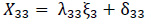
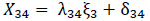
| Acceptance of illness (ξ3) | 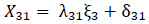 |
 |
|
 |
|
 |
|
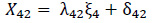
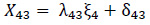
| Demographics of respondents (ξ4) | 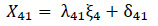 |
 |
|
 |
|
 |
|
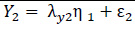
| Quality of life (η1) | 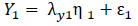 |
 |
|
 |
|
 |
3.2. Model Identification
The obtained value of degrees of freedom for the data is 126, which means that df > 0, specifically 126 > 0, indicating that the model identification falls under the overidentified model, making the model eligible for further testing.
3.2.1. Assumption Testing of SEM
Three assumptions must be met before further testing using the SEM method: sample size, normality of data, and outliers. As 429 samples were used in this study, it met the requirement for sample size when using MLE. The detection of outliers in the data is carried out in two stages: the first stage detects univariate outliers, and the second stage detects multivariate outliers. In univariate outlier detection, the data in each variable is examined using the standardized Z-score value, where the data is considered an univariate outlier if the Z-score value > 3. Seventeen observational data belong to univariate outliers, so it is necessary to eliminate those data. After elimination, the data is re-examined to see which data belongs to multivariate outliers. Multivariate outliers are detected using the Mahalanobis distance d2 value compared to χ2(18;0,001). If the obtained value of χ2(18;0,001) = 42.312 > d2 then the data belongs to a multivariate outlier, and vice versa. The testing result using AMOS software shows that three items of data belong to multivariate outliers, so these data must be eliminated to fulfill the assumption of being free from outliers.
Next, the assumption of normality of data that needs to be met in this study is multivariate normality [13]. Testing for multivariate normality can be observed in the critical ratio values obtained from the data's kurtosis, which has a cutoff value in the range of ± 1.96 for a significance level of 5% or ± 2.58 for a significance level of 1%. The results of testing for multivariate normality using AMOS software obtained a critical ratio value of multivariate kurtosis of 4.63. This result indicates that the data is not normally distributed multivariate because the obtained critical ratio value of multivariate kurtosis is not within the range of ± 1.96 or ± 2.58. Hence, it needs to be reviewed and re-eliminated towards data that approach multivariate outliers. There were 15 observation data eliminated; after elimination, the critical ratio (c.r.) value of multivariate kurtosis was obtained at 2.388, which was within the range of -2.58 ≤ c.r. ≤ 2.58, indicating that the data used is typically distributed multivariate, and further analysis can be conducted.
3.2.2. Model Fit of the Measurement
The suitability of the measurement model is assessed by testing validity and reliability. A validity test is used to see the correlation between indicator variables and their latent variables. In contrast, a reliability test is used to see the stability between indicator variables and their latent variables.
3.2.2.1. Validity Test
Two indicator variables do not meet validity with their latent variable. From the results, the indicator variables for knowledge about medical care and knowledge about complications have construct reliability values < 1.96, which are -0.823 < 1.96 and 1.467 < 1.96, respectively, and the P-values of the indicator variables are 0.410 > 0.05 and 0.142 > 0.05. Therefore, these two indicator variables are invalid and do not affect the latent variable, so they must be eliminated. In addition, there are three indicator variables with loading factors < 0.3, one on the acceptance of illness variable (ξ3) and two on the demographic variable (ξ4). These three indicator variables, difficulty in doing activities, body mass index, and waist circumference, have loading factor values of 0.16, -0.23, and 0.14, respectively. Therefore, these indicator variables need to be eliminated because they do not meet the validity of their latent variable.
3.2.2.2. Reliability Test
It is known that there is one latent variable that is not reliable for the construct reliability estimate (C.R.), namely the knowledge about the hypertension variable (ξ1) because the obtained value is < 0.6. Meanwhile, for the variance extracted estimate (VE), two latent variables are not reliable, namely the knowledge about hypertension variable (ξ1) and the demographic variable (ξ4), because the obtained values are smaller than the recommended value of ≥ 0.5. Although there are unreliable latent variables in this study, these variables do not need to be eliminated because the data used in this study are varied, and not all of them are measured on a Likert scale.
3.2.3. Overall Model Fit
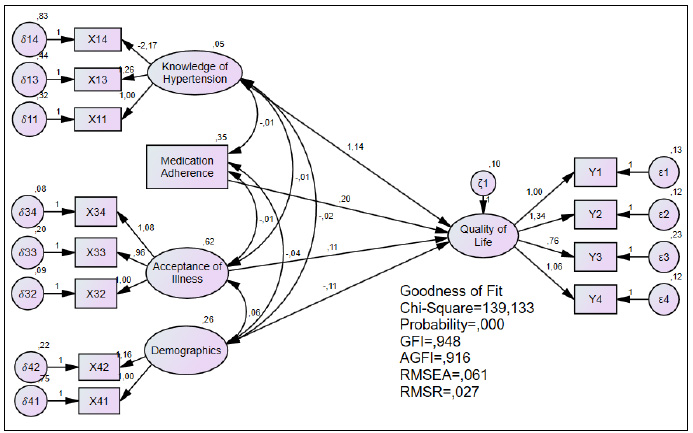
The estimated results of the overall model fit are evaluated based on five criteria including Chi-square, the Goodness of Fit Index (GFI), Adjusted Goodness of Fit Index (AGFI), the Root Mean Square Error of Approximation (RMSEA), and the Root Mean Square Residual (RMSR). The estimation results of these five criteria using AMOS software are shown in Table 3.
From the estimated values of the overall model, it can beobserved that the Chi-square value of the formed model is not good enough. This is because the Chi-square value is still relatively high and the P-value indicates a value < 0.05, indicating that the Chi-square criterion has not been met. Therefore, the model needs to be modified to meet the unmet criteria.
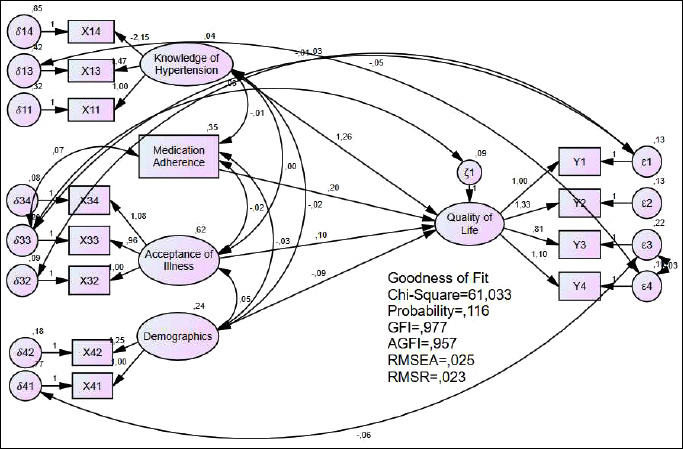
The estimated results of the overall model fit after modification are shown in Fig. (2a, b). Based on the estimated values, the Chi-square value obtained is 61.033, and the P-value is 0.116. This indicates that the Chi-square value in the modified model has decreased from the unmodified model. The P-value after the modification has a value > 0.05, indicating that the model meets the Chi-square criterion. In addition, the four other criteria – GFI, AGFI, RMSEA, and RMSR – also experienced changes. As shown in Fig. (2b), the GFI and AGFI values after modification have increased. In contrast, the RMSEA and RMSR values have decreased compared to the values before modification, indicating that the modified model is better to use than the unmodified model.
3.2.4. Structural Model Fit
The suitability of the structural model was performed by testing the exogenous latent variables (ξ) against the endogenous latent variable (η) in the study so that in the structural model suitability test, factors influencing the quality of life of hypertensive patients could be known.
Based on Table 4, it was found that the exogenous latent variables (ξ) that influence the endogenous latent variable (η) or the quality of life of hypertensive patients in Lhokseumawe City are knowledge about hypertension (ξ1), medication adherence (ξ2) and acceptance of the illness (ξ3). This can be observed from the value of | C.R. | > 1.96 and P-value below 0.05, indicating that the variables of knowledge about hypertension (ξ1), medication adherence (ξ2) and acceptance of the illness (ξ3) significantly influence the variable quality of life of hypertensive patients (η1). Meanwhile, the respondent's demographics (ξ4) did not have a significant effect on the quality of life (η1), as indicated by the value of | C.R. | < 1.96 and p-value above 0.05, indicating that the variable does not significantly affect the quality of life of hypertensive patients (η1) in Lhokseumawe City.
| Criterion | Estimation | Information |
|---|---|---|
| Chi-square |
χ2= 139,133 P-value = 0.001 |
Not good enough |
| GFI | 0,948 | Good |
| AGFI | 0,916 | Good |
| RMSEA | 0,061 | Good |
| RMSR | 0,027 | Good |
| Latent Variable Relationships | Estimate | Standard Error | Critical Ratio | P-value |
|---|---|---|---|---|
| Knowledge of hypertension → Quality of life | 1,257 | 0,374 | 3,357 | < 0.001 |
| Medication adherence → Quality of life | 0,201 | 0,044 | 4,595 | < 0.001 |
| Acceptance of the illness → Quality of life | 0,104 | 0,035 | 2,986 | 0,003 |
| Demographics of respondents → Quality of life | -0,091 | 0,067 | -1,364* | 0,173** |
4. DISCUSSION
This study aims to identify the factors that affect the quality of life of hypertensive patients in Indonesia. Descriptive data obtained in Table 1 shows that the older the age of a patient, the lower the education level, the higher the body mass index (BMI) and the higher the risk of developing hypertension. Additionally, it can also be observed that most of those affected by hypertension were married females who were generally unemployed. This was obtained from our study, where out of 429 samples, the majority of those affected by hypertension were elderly, uneducated, and had a BMI in the obese category. Previous studies [21] have found that factors contributing to hypertension include gender, age, employment status, and BMI in the obese category.
Increasing age and high BMI also contributed to hypertension [22-24], thus indicating a significant relationship between age and education and hypertensive patients' quality of life [9, 25]. However, we found no significant relationship between age and education with the quality of life of hypertensive patients. This is in accordance with previous studies [26], which show that age and education do not significantly affect quality of life.
In our structural equation modelling (SEM) method, there were 12 valid indicator variables representing their respective latent variables. The indicator variables representing hypertension knowledge were knowledge of hypertension and diet implementation, hypertension medication and its use, and lifestyle for hypertensive patients. The indicator variables representing the acceptance of the disease were the patient feeling unwanted by their surroundings due to their illness, the patient feeling dependent on others, and the patient lacking self-confidence. The indicator variables representing the demographic variables of the respondents were the age and education level of hypertensive patients. Finally, the indicator variables representing the quality of life of hypertensive patients were physical health, psychological health, social relationships, and the patient's environment (Supplementary Data).
Three factors that affect the quality of life of hypertensive patients in this study were knowledge of hypertension, compliance with medication, and acceptance of the disease. The resulting SEM model equation (2) from this study is as follows:
 |
(2) |
Based on the equation above, hypertension knowledge positively influences hypertension patients' quality of life. It can be observed that with every addition of one unit of knowledge about hypertension that the patient has, their quality of life will increase by 1.257. Therefore, the factor of knowledge about hypertension has a positive correlation where the higher the patient's knowledge of hypertension, the better their quality of life. This is in line with the research conducted by [7], which states that the level of knowledge about hypertension also significantly influences the quality of life of hypertension patients.
In addition, based on the equation, a positive relationship between adherence to hypertension medication and the patient's quality of life is also obtained, in line with an earlier report which suggests that a positive relationship between medication adherence and the quality of life of hypertension patients [4, 5]. In this study, with every addition of one unit of adherence to hypertension medication, the patient's quality of life should increase by 0.201, meaning that the more regularly hypertension patients consume their medication, the better their quality of life. However, it is different from studies [27] that did not find a relationship between medication adherence to the quality of life of hypertensive patients.
The third factor affecting hypertension patients' quality of life in this study is acceptance of the disease. In the equation, acceptance of the disease also positively influences hypertension patients' quality of life. The acceptance of the disease significantly affects patients' quality of life [6, 28], as well as the research in this study. From the equation, if the patient's acceptance of the disease increases by one unit, their quality of life will increase by 0.104. in other words, if hypertension patients fully accept their condition, their quality of life will improve.
This study concludes that the whole SEM model formed in this study meets the criteria for the goodness of fit (the model is good/acceptable). Three significant factors positively correlate with the quality of life of hypertension patients: knowledge about hypertension, adherence to medication, and acceptance of the disease being suffered.
5. LIMITATIONS
This study was conducted over a period of four months, which limited its ability to capture the progression of hypertension cases over time. It included only adult individuals in Lhokseumawe City diagnosed with hypertension, with an age range of 24 to 86 years. Consequently, children, adolescents, and elderly individuals over the age of 86 were not included. The sample consisted of voluntary respondents who agreed to undergo examination and complete the researcher’s questionnaire, which may have introduced potential bias, as participation was limited to individuals willing to be involved. Furthermore, the variables in this study were used to examine the relationships between individuals’ knowledge about hypertension, medication adherence, disease acceptance, demographics, and quality of life. While sex data were reported, this study did not perform sex- or gender-based analyses. Future research could explore potential sex or gender differences in knowledge, medication adherence, and quality of life in hypertensive patients.
CONCLUSIONS
This cross-sectional study aims to analyze the relationship between knowledge level, medication adherence, disease acceptance, and demographic characteristics with the quality of life of hypertension patients in Lhokseumawe City, Aceh Province, Indonesia. The findings indicate that the Structural Equation Modeling (SEM) used met the goodness-of-fit criteria, making it an acceptable and valid model. It was found that knowledge about hypertension, adherence to medication, and disease acceptance plays a significant role in improving patients' quality of life. These factors have a positive impact on the quality of life of hypertension patients, indicating that an increase in knowledge about hypertension, adherence to medication, and acceptance of the disease leads to an improvement in the quality of life of individuals with hypertension. However, due to the cross-sectional design of this study, causal relationships between variables cannot be fully established. Therefore, it is recommended that further research adopt a long-term study design and include multiple research centers (multicenter studies) covering various regions, including both urban and rural areas, to enhance the generalizability of the findings and provide a more comprehensive understanding of the factors affecting the quality of life of hypertension patients in Indonesia. Longitudinal studies are suggested to observe changes in the quality of life of hypertension patients over an extended period. Such studies could help clarify the causal relationships between knowledge level, medication adherence, disease acceptance, and the quality of life of patients. By conducting broader and more in-depth research, future findings are expected to provide a stronger basis for healthcare policies and the development of more effective intervention strategies to improve the quality of life of hypertension patients.
AUTHORS’ CONTRIBUTIONS
H.S: Conceptualization G.A: Data Analysis or Interpretation; Z.M.K, M.M: Validation; S.A, L.W: Data Collection; M.M: Study Concept or Design.
LIST OF ABBREVIATIONS
| X | = Indicators exogeneous latent variable |
| Y | = Indicators endogeneous latent variable |
| ε | = Errors measurements exogenous |
| δ | = Errors measurements endogenous |
| λ | = Value of loading factor between indicator variable and latent variable |
| ζ | = Errors endogeneous latent variable |
| X11 | = Definition and diet |
| X13 | = Medication adherance |
| X14 | = Lifestyle |
| X34 | = Insecure |
| X33 | = Dependency |
| X32 | = Unwanted |
| X42 | = Education |
| X41 | = Age |
| Y1 | = Physics |
| Y2 | = Psychology |
| Y3 | = Social relationship |
| Y4 | = Environment |
| SEM | = Structural Equation Modeling |
| NCDs | = Non-communicable diseases |
| BMI | = Body mass index |
| MLE | = Maximum likelihood estimator |
| c.r. | = Critical ratio |
ETHICS APPROVAL AND CONSENT TO PARTICIPATE
This study was reviewed and approved by the Ethics Committee of the Faculty of Nursing, Universitas Syiah Kuala, Indonesia (approval number: 113020301221).
HUMAN AND ANIMAL RIGHTS
All procedures performed in studies involving human participants were in accordance with the ethical standards of institutional and/or research committee and with the 1975 Declaration of Helsinki, as revised in 2013.
CONSENT FOR PUBLICATION
All participants or patients provided informed consent to participate in this study.
AVAILABILITY OF DATA AND MATERIALS
The data supporting the findings of the article is available in the Google Drive at https://drive.google. com/drive/folders/1kU7ooEunZLyLDIGBb0YGAb985Yftqq4v?usp=drive_link.
FUNDING
This study was funded and supported by the LPPM of Syiah Kuala University, Indonesia (grant number: 141/ UN11/SPK/PNBP/2022).
ACKNOWLEDGEMENTS
Declared none.

