All published articles of this journal are available on ScienceDirect.

A Machine Learning Approach to the Prediction of Malaria in Under-five Children: Analysis of the 2021 Nigerian Malaria Indicator Survey
Abstract
Background
Malaria remains a major cause of illness and death among children under five in Nigeria, despite efforts to control transmission. Accurate and reliable prediction of malaria outbreaks is crucial for health authorities to take timely measures. This study aims to identify the most robust machine learning classification algorithms for predicting the status of malaria in children under five (0-59 months).
Methods
The 2021 Nigeria Malaria Indicator Survey (NMIS) included 10,655 children under five who were tested for malaria using the Rapid Diagnostic Test (RDT). Various machine learning models were explored, including Decision Trees, K-Nearest Neighbor, Naïve Bayes, Random Forest, Support Vector Machines, and Survey Logistic Regression, and their performance was evaluated through metrics such as accuracy, AUC, balanced accuracy, F1-Score, negative predictive value, precision, sensitivity, and specificity.
Results
Random Forest (RF) is the most robust and balanced classification model due to its superior accuracy (79%), precision (77%), recall (62%), F1-score (69%), and AUC (80%). Support Vector Machine (SVM) also demonstrated strong performance, particularly in accuracy (74%) and AUC (80%). Survey Logistic Regression (SLR) and Decision Tree (DT) offered moderate results but fell short compared to RF and SVM, indicating the need for further optimization. Naive Bayes (NB) and K-Nearest Neighbors (KNN) had limitations, making them less reliable for this task.
Conclusion
In conclusion, the study reveals that RF and SVM are the best classification models for predicting malaria status in children under five years old. RF is reliable and balanced, while SVM is preferred for recall. SLR and DT show potential but require optimization. NB and KNN have significant performance gaps, making them less suitable. These findings will help policymakers and malaria intervention programs address key factors, enabling more targeted public health interventions to reduce the malaria burden on young children and improve the well-being of vulnerable populations in Nigeria.
1. INTRODUCTION
Malaria is a potentially fatal epidemic disease that is spread through parasites that are carried by mosquito bites. It is prevalent in many tropical and subtropical developing countries and continues to pose a major health challenge globally. The World Health Organization lists the disease as the sixth most common cause of mortality in underdeveloped nations, with sub-Saharan Africa having the highest rate of severity. As of 2021, there were 247 million reported malaria cases, leading to over 619,000 deaths, with an overwhelming 95% of these fatalities occurring in sub-Saharan Africa. The most vulnerable groups are pregnant women and children under five years old, who represent more than 80% of all malaria-related deaths [1].
Nigeria, with a population exceeding 230 million, is one of the countries in the sub-Saharan Africa region that reports the highest rate of malaria cases [2]. Historically, Nigeria has experienced widespread malaria for generations, leading to various approaches to combat it. The 20th century observed an increase in awareness of the broad prevalence of malaria, especially after independence in 1960, when health systems were still in the early stages of development.
During the period of the 1980s-1990s, malaria cases increased dramatically as a result of a number of issues, including a deficient healthcare system, rising pesticide resistance, and limited availability of efficient therapies like chloroquine. During the early 2000s, there was a notable increase in efforts to control malaria, particularly with the introduction of Insecticide-Treated Nets (ITNs), indoor residual spraying, and Artemisinin-based Combination Therapies (ACTs). However, Nigeria experienced the highest rates of malaria in the early 2000s, mostly as a result of growing resistance to antimalarial drugs like chloroquine. The World Health Organization (WHO) determined that malaria was the main cause of death in Nigeria during this time. In 2010, Nigeria continued to face a severe malaria epidemic that primarily affected children under five years of age, making it one of its biggest issues [1]. Nigeria had a large share of the malaria epidemic worldwide at this time, with a high number of cases and fatalities among this susceptible group. Increased efforts to prevent malaria have resulted in a little improvement in the situation. Seasonal peaks in malaria transmission and the return of cases, particularly during rainy seasons, continue to affect children under the age of five [3].
Nigeria alone accounts for about 26.8% of global malaria deaths, reflecting the heavy burden of the disease in the country. Over 38% of malaria deaths among children under five occur in Nigeria, translating to more than 95,000 fatalities annually in this age group. This situation represents a significant public health challenge that must be addressed, as the lives of these children are invaluable. Additionally, children under five are particularly vulnerable to malaria due to their underdeveloped immune systems [1, 3, 4]. There are cases of misdiagnosis resulting in incorrect diagnostic determinations. These cases can lead to false-negative predictions, which may lead to unnecessary administration of antibiotics and drugs, and in uncertain circumstances, severe malaria may advance. False positive predictions in incorrect diagnoses prompt the administration of antimalarial medications and drugs, which may induce side effects including lethargy, abdominal pain, diarrhoea, vomiting, and serious consequences [5]. The healthcare industry and medical professionals require robust and reliable predictive systems to address the persistent challenge of malaria misdiagnosis in children under five. Given the high stakes associated with false positives and false negatives, especially in vulnerable paediatric populations, integrating accurate, data-driven tools, such as machine learning models, has become essential to improve diagnostic precision and patient outcomes [6, 7].
Machine learning models (which can be supervised or unsupervised), also referred to as “ML” models, are methods for creating algorithms that learn from historical data to forecast future data [5]. Compared to traditional or classical regression models, Machine Learning (ML) models have demonstrated superior predictive accuracy and are more adept at handling a large number of possible predictors [8]. Traditional statistical models often fail to capture complex, nonlinear patterns in health data. ML models can offer improved predictive performance and flexibility, making them suitable for early malaria risk identification. ML has led to significant improvements in every aspect of the health system, from preventive care to post-treatment care, as a result of its implementation. For instance, compared to conventional methods, ML can diagnose diseases earlier. In healthcare, the application of ML models has emerged as a reliable tool that offers new opportunities for predicting the status of malaria in children under five. The purpose of this study is to identify the most robust machine learning classification algorithms for predicting malaria status in children under five based on the NMIS data, which includes individual socioeconomic and demographic characteristics. These models can analyze complex patterns across multiple variables, such as age, anaemia level, use of bed nets, and geographic location, that traditional methods may not fully capture [7, 9]. Integrating ML algorithms into NMIS data will offer insight into the malaria diagnostic process, especially for high-risk groups like children aged 6–59 months, thereby helping Nigeria significantly enhance diagnostic accuracy [10]. This, in turn, reduces misdiagnosis-related risks, improves patient outcomes, and supports more efficient use of healthcare resources. Furthermore, their scalability allows integration into digital health platforms for real-time decision-making, especially in resource-limited settings. This process supports clinical care and strengthens public health planning by identifying high-risk populations and informing targeted interventions. Thanks to the predictions made by the best-classified machine learning model, Nigeria's government, medical professionals, and hospitals would be better equipped to fight the malaria outbreak [7, 11-13].
2. MATERIALS AND METHODS
2.1. Data Source
The data included in this research originates from the Nigeria Malaria Indicator Survey (NMIS), a cross-sectional survey executed in 2021 aimed at estimating demographic and health indicators for malaria in the country. This study employed a two-stage stratified cluster design comprising 373 rural and 195 urban clusters in the initial stage. In the second phase, 14,185 homes were designated as sampling units, comprising 25 households from each metropolitan region and 25 households from each rural area. The study's target demographics comprised moms from randomly selected families aged 15-49 and children from randomly selected homes aged 6-59 months. The sample size of this study was 10,655 children under five years old who were tested for malaria using the Rapid Diagnostic Test (RDT). The results from the tests were examined using a binary response variable, which indicates whether a child under five has tested positive or negative for malaria.
2.2. Ethical Considerations
Ethical approval was not required since the NMIS data is a secondary dataset. The NMIS data is accessible in the public domain of the DHS website. No respondent-linked confidential information is present in the data.
2.3. Study Variables
The response variables in this study are children under five years old (6 to 59 months). Initially, the variables were tested for malaria using the Rapid Diagnostic Test (RDT), which is a binary variable. The explanatory or independent variables used in the study include age, gender, mother’s language, number of women in the household, number of children under five, household members, birth order number, region, residence, hemoglobin level, anaemia level, source of drinking water, type of toilet facility, children slept under a bed net, type of mosquito bed net(s), mosquito bed net for sleeping, and number of bed nets, household items, mother’s educational level, number of rooms used for sleeping, main floor material, main roof material, main wall material, availability of transportation, type of cookstove, type of cooking fuel, availability of energy source, and wealth index. Previous and numerous studies suggested the selection of these variables [9, 10, 14-17].
2.4. Data Preprocessing
Data preprocessing is a crucial step to ensure the accuracy, reliability, and usability of the dataset before applying machine learning models [18, 19]. This preprocessing ensured that the dataset was structured, clean, and balanced, enhancing the robustness of the ML classification models. Data preprocessing was done via STATA V.17.0 and SAS 9.4. First, variables such as country code, phase, and ultimate area unit were deleted from the dataset with 50% or more missing values [20]. Categorical variables—such as region, residence, mother’s language, and type of mosquito bed net—were encoded using one-hot or label encoding methods to make them suitable for machine learning algorithms. Continuous variables like hemoglobin level and number of household members were standardized or normalized where appropriate to ensure uniformity in scale [21]. Additionally, the issue of having too few positive or negative malaria cases was handled using resampling methods such as the Synthetic Minority Over-sampling Technique (SMOTE), which is an effective way to enhance classification accuracy in uneven health data [14, 15, 22-24].
2.5. Machine Learning Models
The purpose of this study was to find the best-classified machine learning model that can accurately predict malaria status in children under five. The final dataset was split into training and testing subsets using stratified sampling to maintain the class distribution. The data was split into two uneven parts: one larger, which contained 70% of the data for training, and one smaller, which contained 30% of the data for testing. Subsequently, a 10-fold Cross-Validation (CV) was used to evaluate and compare the classification performance of different machine learning models in predicting malaria status among children under five. Reviews of related studies on predicting malaria status among children under five contributed to the selection of the six ML models, and the quality and type of the dataset used were evaluated during the modeling process [9, 16, 25, 26]. The selected classification machine learning models include Survey Logistic Regression, Decision Trees, Random Forest, Support Vector Machines, Naïve Bayes, and K-Nearest Neighbor. The evaluation or performance metrics used for testing purposes include accuracy, balanced accuracy, sensitivity, specificity, precision, negative predictive value, F1-Score, and the Area Under the ROC Curve (AUC). The software used for analyses was R (version 9.1.0).
2.5.1. Survey Logistic Regression
Survey Logistic Regression (SLR) is an extension of a logistic regression model intended for binary or multi-class classification. In a survey setting, changes are made to include survey design features like stratification, clustering, and weighting to ensure that the results truly represent the target population [27]. These adjustments enhance the suitability of the survey data and ensure that the results accurately reflect population-level estimates. Due to the nature of the NMIS data, which is a cross-sectional survey conducted in 2021, the Survey Logistic Regression (SLR) was selected as a suitable classification model. Weighted loss functions were used in SLR to include sampling weights, making sure the predictions represent the whole population instead of just the sample [28-30].
SLR is used for a binary response variable, where it can be an occurring event (positive, which indicates the presence of malaria) or a non-occurring event (negative, which indicates the absence of malaria) [31]. Since the survey logistic regression equation incorporates the survey design features in the model, the dichotomous dependent variable was defined as Yhij, h=1, 2, …, H; i=1, 2, …, nh; j=1, 2, …, mhi, and xhij represneted the row vector of the explanatory variable for the jth unit in the ith cluster within the hth stratum. The probability of an event occuring, πhij=P(Yhij=1), was defined as the probability of having malaria.
The formula of survey logistic regression is defined as follows:
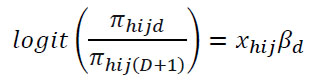 |
Where xhij is a covariate matrix, βd is a vector of unknown parameters and is the expected proportion of the category. The Pseudo-Maximum Likelihood Estimation (PMLE) was applied for unknown parameters of the model and to incorporate the survey design features in the model for unknown parameters [32, 33].
2.5.2. Decision Trees
Decision Trees (DT) is a well-known supervised machine learning method frequently utilized for classification and regression applications. It resembles a flowchart that adopts a tree structure, making it highly or easily interpretable and flexible. Since the decision tree represents a model of decisions in a tree structure, it consists of three types of nodes: the leaf nodes, the root node, and the internal nodes, which are commonly referred to as decision nodes. Each of the three nodes has its attributes, where the internal node represents a test on an attribute, each branch indicates the conclusion of the test, and each leaf node provides a class label or output value. DT are known to be non-parametric; this means that they make no distributional assumption about the underlying data. They are highly versatile and capable of handling categorical and numerical data [34-36].
2.5.3. Random Forest
Random Forest (RA) is among the most popular classification models in machine learning. This versatile ensemble algorithm is widely used to handle regression and classification data. It functions by creating and combining several decision trees derived from various bootstrap samples of the dataset. This process helps to enhance predictive accuracy and reduce the risk of overfitting. Employing this process allows the creation of a collection of uncorrelated trees (randomization techniques), each of which contributes to the final prediction to increase robustness and control overfitting [37, 38]. This procedure ensures that there is diversity among the multiple decision trees. One of the major key features of the random forest is that it is able to deal with high-dimensional datasets and handle missing data with minimal preprocessing. Another notable strength of RF is its capability to estimate feature importance. RF can show which features are most important by looking at how much they reduce impurity (like the Gini index or entropy) or by checking how changing their values affects the model's accuracy [35, 39].
2.5.4. Support Vector Machines
Support Vector Machines (SVM) are non-parametric supervised machine learning algorithms used for classification, regression, and outlier detection. SVM handles high-dimensional data and focuses on structural risk minimization. Its core concept involves identifying the optimal hyperplane for separable data and uses kernel tricks for non-linear data. By using kernel functions, SVM can map data into higher-dimensional spaces, making it easier to separate malaria-positive and malaria-negative cases [40].
2.5.5. Naïve Bayes
Naïve Bayes (NB) offers a straightforward, probabilistic approach to classification, often effective for high-dimensional data. Although the independence assumption between predictors may not fully apply here, NB could serve as a baseline model, particularly useful when many predictor variables are approximately independent [41].
2.5.6. K-Nearest Neighbors
K-Nearest Neighbors (KNN) is a non-parametric, lazy learning algorithm used for classification and regression tasks. It predicts data point labels by analyzing the labels of its k-nearest neighbors in the feature space. KNN is effective for smaller datasets and can adapt to complex decision boundaries. However, it is computationally intensive for large datasets. Proper selection of k-nearest neighbors is crucial for optimal performance. Additionally, the algorithm is sensitive to noisy and irrelevant features, making feature scaling and selection essential for its success [42-44].
2.5.7. Classification Metrics
The classification metrics selected for this study are due to the study’s objective and the nature of the dataset. Classification metrics are essential for ML model evaluation when dealing with classification tasks. The confusion matrix was employed as an evaluation metric for the ML models. A confusion matrix for a binary classification problem follows the structure of True Positive (TP), True Negative (TN), False Positive (FP), and False Negative (FN) [45]. Several key measurements can be found through the confusion matrix, such as Accuracy (ACC), Balance (BA), sensitivity (also known as recall or True Positive Rate–TPR), specificity (true negative rate or selectivity), precision (Positive Predicted Value–PPV), Negative Predicted Value (NPV), and F1-score. Another classification metric is the Receiver Operating Characteristic curve (ROC curve), also known as the Area Under the Curve (AUC), which is a graphical representation used for binary classification models [46, 47]. The formulas for the classification metrics are defined below:
Accuracy (ACC):
 |
Balanced Accuracy (BA):
 |
Sensitivity(Recall/True Positive Rate–TPR):
 |
Specificity (Selectivity/ True Negative Rate–TNR):
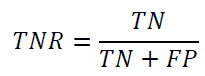 |
Precision (Positive Predicted Value–PPV):
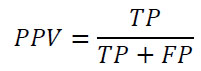 |
Negative Predicted Value (NPV):
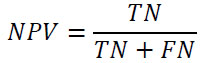 |
F1-Score:
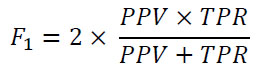 |
Subsequently, the AUC curve was used to compare the performance of the model graphically.
3. RESULTS
3.1. Data Statistics
In this study, information and background characteristics for children under five (0-59 months) are displayed in Table 1. It shows that the malaria status of children under five varies significantly across all the background characteristics. Out of 10,655 under-five children in the sample, 2,852 firstborn children tested positive for malaria, more than secondborn and upward; this means that the number of firstborn children testing positive for malaria is more than the other birth group order. Similarly, the anaemia level of a child under five is also a significant factor affecting malaria status. More under-five children who tested positive for malaria had a moderate anaemia level (2,238) compared to those with a mild anaemia level (868), those who were not anaemic (700), or those with a severe anaemia level (273). The mother’s educational status is also a significant factor affecting the malaria status. Under-five children born to a mother with no education tested positive for malaria more than those born to a mother with secondary (738), primary (559), or higher education (136). Under-five children who tested positive for malaria are found more in rural areas (3,286) compared to urban areas (790). This indicates that the area of residence significantly influences malaria status. Variables like mother’s language, wealth index, mosquito bed net for sleeping, type of bed nets, main floor material, type of cooking stove, main wall material, availability of transportation, main roof material, type of toilet facility, household items, source of drinking water, availability of energy source, and type of cooking fuel are significant factors affecting malaria status.
3.2. Model Performance
The primary goal of this analysis was to compare these six classified ML models’ (SLR, DT, RF, SVM, NB, and KNN) ability to predict the correct class and identify the strengths and weaknesses of each approach. The models were trained and tested using the 70% - 30% split. Each value in the Tables 2 and 3 confusion matrix contributes to the calculation of performance metrics, including accuracy, precision, sensitivity (recall), specificity, and others, which are essential for evaluating classification models.
| Variables (Categories) | Malaria Rapid Diagnostic Test (RDT) Status | |||
|---|---|---|---|---|
| Positive | Negative | Total | P-value | |
| Gender | 0.0731 | |||
| Male | 2,139 | 3,331 | 6,576 | |
| Female | 1,940 | 3,245 | 4,079 | |
| Birth order | <.0001 | |||
| 1st Order | 2,852 | 4,306 | 7,158 | |
| 2nd Order | 1,047 | 1,899 | 2,946 | |
| 3rd + Order | 180 | 371 | 551 | |
| Anaemia level | <.0001 | |||
| Mild | 868 | 1,910 | 2,778 | |
| Moderate | 2,238 | 1,847 | 4,085 | |
| Not anemic | 700 | 2,747 | 3,447 | |
| Severe | 273 | 72 | 345 | |
| Mother’s language | <.0001 | |||
| English | 51 | 136 | 187 | |
| Hausa | 1,624 | 1,689 | 3,313 | |
| Igbo | 317 | 972 | 1,289 | |
| Other | 1,793 | 3,071 | 4,864 | |
| Yoruba | 294 | 708 | 1,002 | |
| Mother’s educational level | <.0001 | |||
| Higher | 136 | 806 | 942 | |
| No Education | 2,646 | 2,791 | 5,437 | |
| Primary | 559 | 788 | 1,347 | |
| Secondary | 738 | 2,191 | 2,929 | |
| Wealth index | <.0001 | |||
| Middle | 889 | 1,372 | 2,261 | |
| Poorer | 1,068 | 1,034 | 2,102 | |
| Poorest | 1,182 | 1,003 | 2,185 | |
| Richer | 659 | 1,520 | 2,179 | |
| Richest | 281 | 1,647 | 1,928 | |
| Mosquito bed net for sleeping | <.0001 | |||
| Yes | 2,650 | 3,998 | 6,648 | |
| No | 1,429 | 2,578 | 4,007 | |
| Type of bed nets | <.0001 | |||
| No Bed Net | 2,340 | 4,042 | 6,382 | |
| Treated Bed Net | 1,695 | 2,455 | 4,150 | |
| Untreated Bed Net | 44 | 79 | 123 | |
| Residence | <.0001 | |||
| Urban | 790 | 2,310 | 3,100 | |
| Rural | 3,286 | 4,266 | 7,555 | |
| Region | <.0001 | |||
| North Central | 639 | 1,435 | 2,074 | |
| North East | 824 | 1,215 | 2,039 | |
| North West | 1,544 | 1,375 | 2,919 | |
| South East | 295 | 850 | 1,145 | |
| South South | 469 | 969 | 1,438 | |
| South West | 308 | 732 | 1,040 | |
| Main floor material | <.0001 | |||
| Improved | 1,793 | 4,309 | 6,102 | |
| Unimproved | 2,286 | 2,267 | 4,553 | |
| Main wall material | <.0001 | |||
| Improved | 1,880 | 4,566 | 6,446 | |
| Unimproved | 2,199 | 2,010 | 4,209 | |
| Main roof material | <.0001 | |||
| Improved | 3,258 | 5,652 | 8,910 | |
| Unimproved | 821 | 924 | 1,745 | |
| Household items | <.0001 | |||
| Television | 421 | 619 | 1,040 | |
| Radio | 719 | 1,426 | 2,145 | |
| Bed | 1,012 | 2,114 | 3,126 | |
| Other | 1,439 | 2,905 | 4,344 | |
| Availability of transportation | <.0001 | |||
| Car/truck | 174 | 704 | 878 | |
| Motorcycle/scooter | 1,201 | 2,072 | 3,273 | |
| Other | 873 | 5,631 | 6,504 | |
| Availability of energy source | <.0001 | |||
| Electricity | 887 | 2,005 | 2,892 | |
| Generator | 476 | 1,524 | 2,000 | |
| Other | 1,310 | 4,453 | 5,763 | |
| Source of drinking water | <.0001 | |||
| Improved | 2,667 | 5,279 | 7,946 | |
| Unimproved | 1,412 | 1,296 | 2,709 | |
| Type of toilet facility | <.0001 | |||
| Improved | 1,884 | 4,155 | 6,039 | |
| Unimproved | 2,195 | 2,421 | 4,616 | |
| Type of cooking fuel | <.0001 | |||
| Clean Fuel | 312 | 1,640 | 1,952 | |
| Liquid Fuel | 172 | 473 | 645 | |
| Solid Fuel | 3,595 | 4,463 | 8,058 | |
| Type of cooking stove | <.0001 | |||
| Clean Fuel Stove | 312 | 1,640 | 1,952 | |
| Liquid Fuel Stove | 146 | 412 | 558 | |
| Solid Fuel Stove | 3,621 | 4,524 | 8,145 | |
| ACTUAL CLASS | PREDICTION CLASS | ||
|---|---|---|---|
| SLR | - | Positive | Negative |
| Positive | 863 | 576 | |
| Negative | 352 | 1405 | |
| DT | Positive | Negative | |
| Positive | 711 | 656 | |
| Negative | 300 | 1529 | |
| RF | Positive | Negative | |
| Positive | 700 | 429 | |
| Negative | 204 | 1636 | |
| SVM | Positive | Negative | |
| Positive | 711 | 509 | |
| Negative | 318 | 1658 | |
| NB | Positive | Negative | |
| Positive | 600 | 669 | |
| Negative | 450 | 1477 | |
| KNN | Positive | Negative | |
| Positive | 460 | 630 | |
| Negative | 506 | 1600 | |
| SLR | DT | RF | SVM | NB | KNN | |
|---|---|---|---|---|---|---|
| Accuracy | 0.71 | 0.70 | 0.79 | 0.74 | 0.65 | 0.65 |
| Balance Accuracy | 0.70 | 0.68 | 0.76 | 0.71 | 0.62 | 0.59 |
| Precision | 0.71 | 0.70 | 0.77 | 0.69 | 0.57 | 0.48 |
| Sensitivity | 0.60 | 0.52 | 0.62 | 0.58 | 0.47 | 0.42 |
| Specificity | 0.80 | 0.84 | 0.89 | 0.84 | 0.77 | 0.76 |
| Negative Predictive Value | 0.71 | 0.70 | 0.79 | 0.77 | 0.69 | 0.72 |
| F1-Score | 0.65 | 0.60 | 0.69 | 0.63 | 0.52 | 0.45 |
| AUC | 0.73 | 0.72 | 0.80 | 0.80 | 0.69 | 0.70 |
Table 2 indicates that SLR achieved a high True Negative (TN) count of 1405, indicating strong performance in identifying negative cases. However, the False Negative (FN) count of 576 is relatively high, indicating that the model struggles to identify positive cases. DT received a higher True Negative (TN) count of 1529 and a lower False Positive (FP) count of 300 than SLR; however, the False Negative (FN) count of 656 is high, suggesting that it misses many positive cases. RF received the lowest False Positive (FP) count of 204 and the highest True Negative (TN) count of 1636, demonstrating excellent performance in predicting negatives. The False Negative (FN) count of 429 of the RF is moderate–better than most other models but not ideal. SVM demonstrated a high True Negative (TN) count of 1658 and a relatively low False Positive (FP) count of 318, along with a False Negative (FN) count of 509. This performance is moderate, indicating that it misses some positive cases. In the NB, the TN (1477) is reasonable, showing fair performance for negatives. However, it also demonstrated a high FN (669) and FP (450), indicating poor performance in both identifying positives. In the KNN, the TN (1600) is comparable to other models, indicating decent performance in identifying negatives. However, the FN (630) and FP (506) are high, reflecting poor sensitivity and precision.
This indicates that RF performs best with the lowest number of false negatives and false positives, making it least likely to misdiagnose malaria in either direction. Using a model like RF could improve diagnostic accuracy, minimizing both undertreatment (FN) and overtreatment (FP). Such an approach is critical in reducing both missed treatments and unnecessary medications, highlighting the importance of evaluating predictive models not just on accuracy but on their false negative and false positive rates, especially in high-stakes health settings.
From Table 3 and Fig. (1), the RF algorithm outperformed all the other models in most evaluation metrics, achieving the highest accuracy (79%), balanced accuracy (76%), precision (77%), sensitivity (62%), and F1-Score (69%), along with the highest Area Under the Curve (AUC = 80%). This indicates that it is effective at handling both false positives and false negatives, with a sensitivity score of 62%, meaning it can fairly detect positive malaria cases. In Fig. (1), the green bar for the RF algorithm stands out in all the performance metrics. It was followed by SVM, which also performed well across several metrics and stood as the second-best model overall. SVM exhibited moderate performance with an accuracy of 74%, precision of 69% tied with RF (AUC = 80%), and a high specificity (84%), indicating effectiveness in correctly identifying non-cases. SLR also performed well with an accuracy of 71%, a precision of 71%, and an F1-Score of 65%, showing that it performs reasonably well at detecting both positive and negative cases. DT, while showing slightly higher specificity (84%) than SLR, recorded a significantly lower sensitivity (52%), meaning it misses almost half of the true malaria cases. K-Nearest Neighbors (KNN) and Naive Bayes (NB) ranked the lowest across several metrics, with KNN achieving an accuracy of approximately 65% and NB trailing behind with the lowest precision (48%) and sensitivity (42%). The poor sensitivity of both models indicates a serious limitation in their ability to identify actual malaria cases, making them unreliable in predicting the malaria status in children under five. Overall, RF emerged as the most reliable and effective model, while KNN and NB were less effective in various performance aspects in predicting the malaria status in children under five.
3.3. Variable Importance
The RF algorithm was used to identify the most important variables associated with malaria status in children under five in the dataset. Fig. (2) shows the variable importance measured based on the RF algorithm. The results indicate in order the most important variables as level of anaemia, birth order, age in months, mother's language and educational level, wealth index, mosquito bed net for sleeping, type of mosquito bed net, number of bed nets in a household, residence, region, source of drinking water, main wall material, main roof material, type of toilet facility, type of cooking fuel, type of cooking stove, and households that may use wood, gas and other sources of energy.
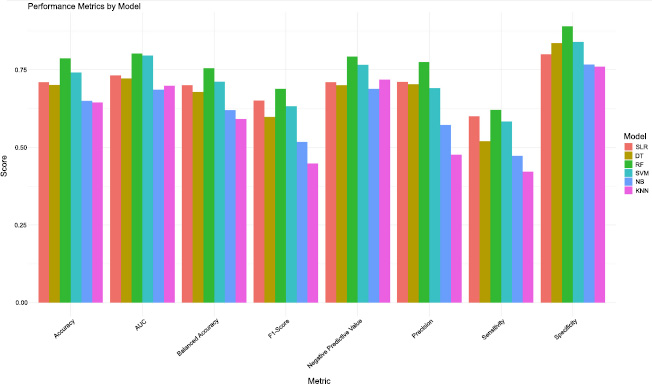
Performance metrics of the selected ML models.
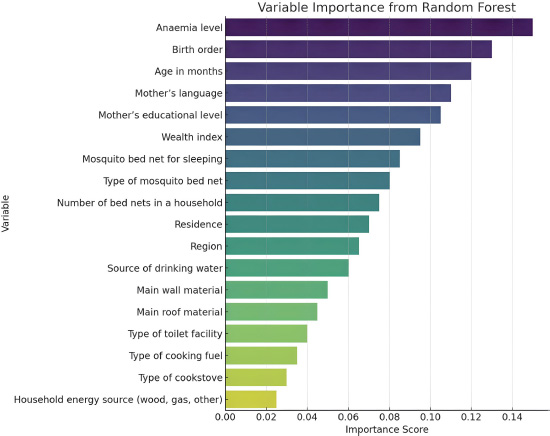
Variable importance measures from the RF algorithm.
4. DISCUSSION
This study demonstrates the application of machine learning techniques to forecast malaria status in children under five (0-59 months) in Nigeria. It is among the few studies that implemented ML algorithms to predict the malaria status in children under five using NDHS or NMIS data, making this work a notable contribution to the intersection of the public health industry. The results show that ML algorithms work better than traditional statistical methods at finding malaria cases, highlighting their increasing usefulness in medical diagnosis [48]. The findings are aligned with previous studies that have shown that ML algorithms can be used to predict the malaria status in children under five with higher accuracy [9, 16, 25, 26].
The RF algorithm showed the best overall performance compared to all the models tested, reaching the highest accuracy (79%), balanced accuracy (76%), precision (77%), specificity (89%), and a strong F1 score (69%). It also achieved the highest Area Under the Curve (AUC = 80%) alongside SVM, which demonstrates its ability to balance precision and sensitivity. This makes RF well-suited for tasks requiring consistent high performance across multiple metrics. Based on the AUC measures, all models in the study demonstrated decent performance. Furthermore, SVM was the second-best performing model, particularly with the second-highest Area Under the Curve (AUC) value of 80%, indicating strong discriminatory power. While SVM prioritizes recall and sensitivity, making it suitable for identifying positive cases in critical applications, it does so at the expense of precision [48-52]. SLR and DT deliver moderate results, with SLR performing slightly better in terms of sensitivity (60%) and balanced accuracy (70%). However, both models fall short of RF and SVM, especially in handling complex data patterns. NB has low sensitivity (47%) and precision (57%), probably because it assumes that features are independent, while KNN also exhibited low sensitivity (42%) and F1-score (45%), which limits its ability to handle complex data or incorrect settings [53-55].
RF achieved the highest true negative rate and the lowest false positive rate, which indicates strong specificity and improved sensitivity in detecting malaria cases. In comparison, models like Naive Bayes (NB) and K-Nearest Neighbours (KNN) had high rates of missing actual malaria cases and incorrectly identifying non-cases, which means they are not very reliable for detecting malaria. Survey Logistic Regression (SLR) and Decision Tree (DT) showed moderate specificity but struggled with high false negative rates, posing risks for undiagnosed malaria. RF emerged as the most promising model for minimizing misdiagnosis in children under five.
Overall, RF emerged as the top performer compared to the other ML algorithms in predicting malaria status in children under five, based on all of the performance metrics. However, SVM and SLR did perform moderately well in some of the performance metrics, meaning that they may also be effective in predicting the malaria status in children under five. The importance of evaluating the multiple models is crucial since the performance of these models varies depending on the type of problem being addressed and the type of dataset, due to which model performance is recommended to be performed. Additionally, the study also had some limitations based on the usage of the survey data, where the sampling weights may not have been fully integrated into all machine learning models, potentially introducing bias in the estimates. Moreover, findings may not generalize beyond Nigeria or similar low- and middle-income settings. Another limitation is that the data collection relied on self-reported information and field-collected data—such as the use of bed nets and details about households—which can lead to possible inaccuracies due to mistakes in reporting because of memory issues, or measurement mistakes, potentially affecting the quality of the data and impacting how well the model works.
CONCLUSION
The study aimed to identify the most effective and robust classification machine learning algorithms for predicting malaria status in children under five (0-59 months) in Nigeria. The findings revealed that classification machine learning algorithms are able to accurately predict malaria status in children under five. RF and SVM stand out as the top-performing models, with RF offering a balanced and reliable choice and SVM being preferable when recall is prioritized. SLR and DT show potential but may require optimization to compete with the leading models. Meanwhile, NB and KNN face significant performance gaps, making them less suitable for this dataset without substantial improvements. Looking ahead, future direction for work should focus on investigating techniques for reducing the dimensionality of data, model optimization, class weight adjustments, and ensemble learning. Future research should explore incorporating environmental and temporal data and evaluate model integration into real-time decision support systems for targeted malaria intervention. This can be explored using longitudinal analysis to track the trend of malaria status in children under five years of age.
AUTHORS’ CONTRIBUTIONS
The authors confirm contribution to the paper as follows: S.M.M.: Writing the paper; S.F.M.: Writing the review and editing;. All authors reviewed the results and approved the final version of the manuscript.
LIST OF ABBREVIATIONS
| ACC | = Accuracy |
| AUC | = Area Under the Curve |
| BA | = Balanced Accuracy |
| DT | = Decision Trees |
| FN | = False Negative |
| FP | = False Positive |
| KNN | = K-Nearest Neighbor |
| NB | = Naive Bayes |
| NPV | = Negative Predicted Value |
| NMIS | = Nigeria Malaria Indicator Survey |
| RF | = Random Forest |
| RDT | = Rapid Diagnostic Test |
| SVM | = Support Vector Machine |
| SLR | = Survey Logistic Regression |
| TN | = True Negative |
| TP | = True Positive |
| TPR | = True Positive Rate |
AVAILABILITY OF DATA AND MATERIALS
The data supporting the findings of the article are available in the Demographic and health surveys at The DHS Program - Nigeria: Malaria Indicator Survey (MIS), 2021.
ACKNOWLEDGEMENTS
Declared none.

