All published articles of this journal are available on ScienceDirect.

Spatial Distribution and Risk Factors Associated with Contraceptive Use among Women of Reproductive Age in Zambia
Abstract
Introduction
Contraceptive use is an essential process in enhancing the lives of individuals by assisting in birth spacing, lowering maternal mortality, and preventing sexually transmitted infections. This study aimed to investigate the spatial distribution and gain insight into the risk factors associated with the widespread contraceptive use among women of reproductive age in Zambia.
Methods
The research used a stratified sampling design to examine the 2018/2019 Zambia Demographic and Health Survey data. The spatial generalized linear mixed model was used to incorporate the random effects into the data and account for the spatial variability at the district level.
Results
The study found that age at first sex, woman’s age, education level, family size, household wealth index, marital status, number of living children, partner’s desire for more children, place of residence, preferred waiting time for the birth of another child, region, discussion about family planning at a health facility, and employment status were the risk factors associated with the widespread contraceptive use of women in Zambia. The smooth map revealed that Lusaka, Muchinga, Copperbelt, and Central provinces exhibit a high prevalence, while Western, Eastern, Southern, and Luapula provinces exhibit a low prevalence, and the Northern and North-Western regions exhibit a very low prevalence of contraceptive use.
Discussion
The findings of the study suggest targeted interventions, such as promoting good health and well-being, achieving gender equality, and ensuring quality education for all women in this country. The findings also suggest interventions to support Zambia's regional development, with particular attention to areas with low contraceptive prevalence. The findings reported are consistent with other research literature on contraceptive use. The cross-sectional nature of the data precludes addressing the cause-and-effect relationship, and longitudinal data are suggested for future studies to investigate this relationship.
Conclusion
The present study underscores the important risk factors contributing to whether a woman in Zambia uses contraceptives. The findings imply that the government departments, institutions, co-operating partners, implementing partners, and civil society organizations must work together to fulfill the government’s goals regarding family planning initiatives that prioritize providing universal access to sexual and reproductive health services, such as family planning, education, and information, while also incorporating reproductive health into national strategies.
1. INTRODUCTION
Contraceptive methods (also known as contraception) are any methods used to prevent pregnancy by interfering with ovulation, fertilization, and implantation. These methods are divided into modern contraceptive methods and traditional contraceptive methods. Men and women have been able to plan their childbearing during the previous three decades due to technological advancements, deciding whether and when to have their children using modern contraceptive methods [1]. Modern contraceptive methods include male and female sterilization, intrauterine devices (IUDs), hormonal methods (oral contraceptives, injections, hormone-releasing implants, skin patches, and vaginal rings), condoms, vaginal barrier methods (diaphragms, cervical cap, and spermicidal foams, jellies, creams, and sponges), and emergency contraception [2]. Traditional contraceptive methods include withdrawal (coitus interruptus), abstinence from sex, and lactation amenorrhea (women exclusively breastfeeding their newborns for six months postpartum). In many Sub-Saharan African nations, efforts by governments and non-governmental organizations to promote the right of women and men to be informed about, access, and utilize safe, inexpensive, and effective methods of fertility regulation have resulted in some improvement in contraceptive uptake [3]. Contraceptive use is essential to avoid pregnancy and sexually related health risks, especially in adolescent girls and unemployed women, saving women from dangerous pregnancies and unsafe abortions.
Contraceptive use helps prevent the deaths of about 2.7 million babies and pregnant women worldwide. This enables couples and individuals to exercise their freedom to choose freely and responsibly whether they want children, when they want them, and how many they should have [4, 5]. However, not all women use at least one of the methods of contraception. Around 225 million women do not use contraceptives, but they also do not want to get pregnant at the same time. The World Health Organization (WHO) has found that women who do not wish to become pregnant but do not use contraceptive methods to limit or delay their pregnancy have not met contraceptive needs [1]. In sub-Saharan Africa, unmet needs for contraceptives have resulted in 19 million unwanted pregnancies, 8 million unplanned births, 5 million abortions, 2 million miscarriages, 555,000 infant deaths, and the deaths of 255,000 newborns [6]. Several nations recognized the importance of family planning at the International Conference on Population and Development (ICPD) in 1994. They aimed to eliminate the unmet need for contraceptives, but the goal has not been achieved [1].
Contraceptive use has been marked as an essential strategy in enhancing the lives of women and infants. It has been proven to have the potential to lower maternal mortality by 32% by permitting women to postpone motherhood, space births, avoid accidental pregnancies and abortions, and restrict the number of their children once they have reached their favored family size [1, 5]. The use of contraceptives has not only been found to help reduce maternal and infant mortality rates, but they have also been shown to help reduce poverty and improve economic security for families, households, and communities through higher incomes, more significant wealth accumulation, and higher levels of education, and by allowing the government and families to spend less money on maternal and infant mortality and morbidity [3]. In this case, parents will have several children equal to their standard of living to enable them to provide a quality life in terms of health, education, and nutrition.
Zambia is a landlocked country situated on a high plateau in South-Central Africa. It takes its name from the Zambezi River, which drains a small portion of the country’s northern region [7]. The population of Zambia is relatively small compared to the country's area, and its growth rate is generally lower than that of neighboring countries. Zambia's population is estimated to be 15.9 million, with 60% living in rural areas and 40% in urban areas. Compared to women who live in urban areas, rural women have restricted access to health services, including family planning; about 40% of women in rural areas use modern contraceptives, which is a smaller proportion compared to 53% of women in urban areas [8]. However, knowledge of contraceptive use is nearly universal in this country; more than 99% of married women between the ages of 15 and 49 are aware of at least one method of contraception.
The pace of improvement in contraceptive use, knowledge, access, and affordability has been substantial in Zambia [3]. Among currently married women aged 15 to 49, the contraceptive prevalence rate is 50%, with 48% using any modern method and 2% using traditional methods. Furthermore, 44% of sexually active unmarried women use any contraceptive method, 43% use any modern method, and 1% use traditional methods.
Literature studies have reported that the use of contraceptives is influenced by different factors, including demographic, environmental/ecological, and socioeconomic factors. Some studies further found that within these factors, woman's age, education level, employment status, marital status, place of residence, household wealth index, and number of living children are the common factors associated with the use of contraceptives [4, 9-11]. Most of the research literature has been focused on the use of modern contraceptives, while traditional ones are also utilized by women. Research literature [12] demonstrated that Zambia has experienced a slow but steady increase in contraceptive prevalence and a slight decline in the total fertility rate over the past 20 years.
The current study aims to determine the distribution of modern and traditional contraceptive use among women and the factors contributing to the increase in contraceptive use in Zambia. To our knowledge, no study has been carried out in Zambia with the above objectives. The literature is hoped to help the government, public health institutions, and policymakers enhance their knowledge of the distribution and factors associated with contraceptive use, which, in turn, will help improve contraceptive use among women in Zambia.
2. MATERIALS AND METHODS
2.1. Source of Data
The current study utilized cross-sectional data from a sample of 13,683 respondents in the 2018 Zambia Demographic and Health Survey (ZDHS). The data in the study is the sixth in a series of Demographic and Health Surveys in Zambia; the prior studies were held in 1992, 1996, 2001-02, 2007, and 2013-14. The data collection was conducted from 18th July, 2018 to 24th January, 2019 using a stratified two-stage sample design. In the first stage of sampling, clusters of enumeration areas were selected. A total of 545 clusters were constructed within each sampling stratum, with enumeration areas selected using probability proportional to size (PPS) based on the design frame. The second stage of the cluster sampling design involved the selection of households within each cluster for the survey through systematic sampling. A household listing procedure was conducted using the sampling frame of selected clusters, with an average of 133 households found in each cluster. A fixed number of 25 households were selected from each cluster using an equal probability systematic selection approach. Further to this sample, all women aged 15-49 who stayed the night before the survey at the household as permanent residents or visitors were eligible to be interviewed. From the interviewed households, 14,189 women aged 15-49 were identified as eligible for individual questionnaires. A total of 13,683 women were given the questionnaires, yielding a response rate of 96%. More details on the data collection and sampling methods are available in a study conducted previously [13].
2.2. Response Variable
The primary variable of interest in the study was contraceptive use status in women. A woman is said to be a contraceptive user if she utilizes at least one of the available contraceptive methods (modern or traditional). Thus, the binary response variable indicates whether a woman is using any contraceptive method. This variable is coded as “1” and “0” for a contraceptive user and a non-contraceptive user, respectively.
2.3. Explanatory Variables
The explanatory variables selected in the study were categorized into variable characteristics or factors, such as socio-economic, geographical, environmental, or demographic characteristics. The variable selection was based on an extensive review of existing research on contraceptive use to identify variables that had been previously studied, aligning with the theoretical framework, and conducting exploratory data analysis to identify correlations between variables. The socio-economic factors included religion (Catholic, Protestant, Muslim, Other), household wealth index (poorest, poorer, middle, richer, richest), woman’s employment status (employed, unemployed), heard of family planning (yes, no), visited by a fieldworker in the last 24 months (yes, no), discussion about family planning at a health facility (yes, no), knowledge of sexually transmitted infections (yes, no), and know about contraception side effects (yes, no). The geographical factors included region (Central, Copperbelt, Eastern, Luapula, Lusaka, Muchinga, Northern, North-Western, Southern, Western) and place of residence (urban and rural). The demographic factors included age at first cohabitation (continuous), age at first sex (<15 years, 15-24 years, 25-34 years, 35+ years), age of a partner (continuous), age of a woman (continuous), decision maker for using contraceptives (mainly respondent, mainly husband/partner, joint decision, other), decision maker on woman’s healthcare (respondent alone, respondent and partner, respondent and other person, partner, someone else, other), education level of a partner (no education, primary, secondary, higher, do not know), education level of a woman (no education, primary, secondary, higher), family size (continuous), marital status of a woman (never in a union, married/living with a partner, widowed, divorced, no longer living together/separated), number of living children (0, 1-2, 3-4, 5+), partner’s desire for more children (both wants the same, partner wants more, partner wants fewer, do not know), preferred waiting time for the birth of another child (<12 months, 1 year, 2 years, 3 years, 4 years, 5 years, 6+ years, immeasurable, do not know), and woman’s desire for more children (never had sex, wants within 2 years, wants within 2+ years, unsure timing, undecided, wants no more, sterilized/declared infecund). The above variables were chosen based on the literature [1, 3-5, 8, 9, 11, 14-21].
2.4. Statistical Methods
The current study employed a quantitative analysis approach, and data were analyzed using spatial generalized linear mixed models to account for both fixed and random effects, as well as spatial variability.
2.5. Model Structure
The model form of the spatial generalized linear mixed model is given by:
 |
(1) |
The spatial autocorrelation is assumed to depend on the distance instead of the location of responses, so that the covariance between observations y(si) and y(sj) at different locations is given by:
 |
(2) |
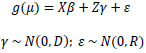
Where c(.) is a function of the distance h = si - sj between two locations [22, 23]. It is assumed that this covariance has a constant mean that is second-order stationary, i.e., E[y(si)]=E[y(sj)] Furthermore, to include the location si, it is assumed that (i) y(si|γ) is conditionally independent of any location with mean E[y(si|γ)] = μ(si) and (ii) The distribution of s is defined by γ [24]. Consider a generalized linear model (GLM) case classically formulated as g(μ) = Xβ, where X is a design matrix. To include spatial processes, assume (i) and (ii) [25]. Thus, a model with spatial random effects is given as:
 |
(3) |
Where X and Z are the design matrices, and the random effect at the location si is normally distributed with mean=0 and variance = γ(θ). Moreover, the spatial correlation parametrized by θ is γ(θ), and the error terms are also normally distributed with mean = 0 and variance = σε2I, where I is the identity matrix. Literature has suggested that several functions could be used to describe spatial dependency. However, in geostatistics, spatial correlation is generally described by three main functions: (i) Semivariogram (also known as variogram), (ii) Correlogram, and (iii) Covariance [25]. The variogram is the most commonly used function in geostatistics for fitting spatial correlation models, and the current study utilizes this function.
2.6. Spatial Autocorrelation Analysis
Accounting for spatial variability requires investigating the autocorrelation among residuals. The purpose of investigating residual autocorrelation is to enable the researcher to account for autocorrelation, maintain the normality assumption, and remove any structural errors from the final model. Moran’s I coefficient and Geary’s contiguity ratio [26, 27] are the two standard techniques applied when investigating the presence of spatial autocorrelation. Moran’s I coefficient evaluates the distribution of the given data and generates a single value output ranging from -1 to +1 to evaluate spatial autocorrelation. The value around -1 suggests the scattered distribution of data, values around 0 indicate a random data distribution, and values around +1 indicate a clustered data distribution [26, 28].
Geary’s contiguity ratio statistic is another measure of spatial autocorrelation that examines the similarity of the pair of attributes and produces an output value ranging from 0 to 2, where an output of 0 suggests maximum autocorrelation, 1 suggests the absence of spatial autocorrelation, and a value of 2 suggests a strong negative autocorrelation [27]. In addition to these statistics, the scatter plot and the structure of the empirical semivariogram can be constructed and examined.
2.7. Spatial Prediction
Spatial prediction (also known as spatial forecasting or spatial modeling) is a process of prediction that is used in spatial analysis and involves using data from known locations to predict the value of a variable at unobserved locations (Si, for i = 1, 2, 3,..., n). In research, it is standard practice to measure one or more quantities at certain geographical locations to predict the observed values in unsampled locations [29]. Geographic information systems (GIS) are typically used for spatial analysis as they offer tools for generating feature statistics and performing geoprocessing tasks like data interpolation [24]. Kriging has long been used in spatial prediction to forecast one variable at a time using data from the same kind of variable. Kriging provides the best interpolation technique based on regression against observed values of neighboring spatially covariant-weighted data points. It offers several benefits, such as mitigating the impact of data clustering, granting individual points within a cluster a lower weight than isolated data points, providing a variable estimate, guaranteeing the availability of estimation error, which serves as a foundation for stochasticity, and enabling the simulation of potential outcomes [30]. Ordinary kriging was used in this study to predict variables in unsampled locations. The observed statistical features of the data were combined using the ordinary kriging approach. The partial sill corresponds to the most considerable variability in the absence of spatial dependence, and the strength of the statistical correlation is measured as a function of distance, where spatial correlation declines [31].
2.8. Analysis
The analysis in this study was carried out using the Proc GLIMMIX procedure from SAS Enterprise by fitting a generalized linear mixed model to the data. Several covariance structures were considered, namely linear, spherical, exponential, Gaussian, powered exponential, and Matern. ArcGIS Pro was used to produce a smooth map showing the contraceptive use prevalence patterns at the district level for each region of Zambia.
3. RESULTS
3.1. Descriptive Analysis
Table 1 gives a summary of the descriptive statistics of the categorical background characteristics of the respondents. The frequencies and percentages of women using and not using contraceptives are presented in Table 1. Out of the 13,683 women from the sample, 35.18% used at least one type of contraceptive method, and 64.82% were non-users. It was observed that the prevalence of using contraceptives among women was highest in the Eastern region, with 4.96% of users, and the lowest in the Western region, with 2.20% of users. As presented in Table 1, 14.14% of women from urban areas used contraceptives, whereas 21.04% of women from rural areas used contraceptives. It was observed that 2.62% of the women using contraceptives had no education, 19.65% had primary education, 13.46% had secondary education, and 2.15% had higher education. Furthermore, 5.94% of women using contraceptives were Catholic, 28.71% were Protestant, 0.23% were Muslim, and 0.31% were from other religions.
| Background Characteristics | User N (%) | Non-user N (%) |
|---|---|---|
| Contraceptive use status | 4814 (35.18) | 8869 (64.82) |
| Region | ||
| Central | 485 (3.54) | 912 (6.67) |
| Copperbelt | 551 (4.03) | 1064 (7.78) |
| Eastern | 678 (4.96) | 858 (6.27) |
| Luapula | 421 (3.08) | 993 (7.26) |
| Lusaka | 676 (4.94) | 1099 (8.03) |
| Muchinga | 477 (3.49) | 706 (5.16) |
| Northern | 380 (2.78) | 859 (6.28) |
| North-Western | 394 (2.88) | 687 (5.02) |
| Southern | 451 (3.30) | 896 (6.55) |
| Western | 301 (2.20) | 795 (5.81) |
| Place of residence | ||
| Urban | 1935 (14.14) | 3578 (26.15) |
| Rural | 2879 (21.04) | 5291 (35.67) |
| Education level of women | ||
| No education | 359 (2.62) | 786 (5.74) |
| Primary | 2319 (16.95) | 3898 (28.49) |
| Secondary | 1842 (13.46) | 3714 (27.14) |
| Higher | 294 (2.15) | 471 (3.44) |
| Religion | ||
| Catholic | 813 (5.94) | 1538 (11.24) |
| Protestant | 3928 (28.71) | 7210 (52.69) |
| Muslim | 31 (0.23) | 30 (0.22) |
| Other | 42 (0.31) | 91 (0.67) |
| Household wealth index | ||
| Poorest | 926 (6.77) | 1918 (14.02) |
| Poorer | 959 (7.01) | 1718 (12.56) |
| Middle | 1030 (7.53) | 1653 (12.08) |
| Richer | 957 (6.99) | 1602 (11.71) |
| Richest | 942 (6.88) | 1978 (14.46) |
| Marital status | ||
| Never in union | 573 (4.19) | 3748 (27.39) |
| Married/living with a partner | 3741 (27.34) | 3856 (28.18) |
| Widowed | 63 (0.46) | 336 (2.46) |
| Divorced | 310 (2.27) | 673 (4.92) |
| No longer living together/ separated | 127 (0.93) | 256 (1.87) |
| Age at first sex | ||
| <15 years | 927 (6.77) | 3137 (22.93) |
| 15 - 24 years | 3834 (28.02) | 5632 (41.16) |
| 25 - 34 years | 53 (0.39) | 99 (0.72) |
| 35+ years | 0 (0.00) | 1 (0.01) |
| Woman’s desire for more children | ||
| Never had sex | 0 (0.00) | 0 (0.00) |
| Wants within 2 years | 439 (3.21) | 1106 (8.08) |
| Wants after 2+ years | 1796 (13.13) | 2182 (15.95) |
| Wants, unsure of timing | 430 (3.14) | 2502 (18.29) |
| Undecided | 247 (1.81) | 613 (4.48) |
| Wants no more | 1750 (12.79) | 2268 (16.58) |
| Sterilized/Declared infecund | 152 (1.12) | 198 (1.45) |
| Decision maker for using contraception | ||
| Mainly woman | 11 (0.08) | 23 (0.17) |
| Mainly partner | 689 (5.16) | 1256 (9.4) |
| Joint decision | 500 (3.74) | 876 (6.56) |
| Other | 3606 (26.99) | 6401 (47.9) |
| Woman’s employment status | ||
| Unemployed | 2251 (16.45) | 5281 (38.60) |
| Employed | 2563 (18.73) | 3588 (26.22) |
| Education level of the partner | ||
| No education | 262 (1.96) | 565 (4.23) |
| Primary | 1714 (12.83) | 3330 (24.92) |
| Secondary | 2160 (16.17) | 3510 (26.27) |
| Higher | 501 (3.75) | 824 (6.17) |
| Do not know | 169 (1.26) | 327 (2.45) |
| Decision maker of women’s healthcare | ||
| Woman alone | 1925 (14.41) | 3442 (25.76) |
| Woman and partner | 1972 (14.76) | 3464 (25.92) |
| Woman and another person | 0 (0) | 0 (0) |
| Partner alone | 892 (6.68) | 1618 (12.11) |
| Someone else | 14 (0.1) | 23 (0.17) |
| Other | 3 (0.02) | 9 (0.07) |
| Knowledge of STI | ||
| No | 32 (0.23) | 138 (1.01) |
| Yes | 4782 (34.95) | 8731 (63.81) |
| Heard of family planning | ||
| No | 3633 (26.55) | 6945 (50.76) |
| Yes | 1181 (8.63) | 1924 (14.06) |
| Number of living children | ||
| 0 children | 183 (1.34) | 3325 (24.30) |
| 1 - 2 Children | 1775 (12.97) | 2526 (18.46) |
| 3 - 4 Children | 1463 (10.69) | 1444 (10.55) |
| 5+ Children | 1393 (10.18) | 1574 (11.50) |
| Visited by a fieldworker in the last 12 months | ||
| No | 4073 (29.77) | 7812 (57.09) |
| Yes | 741 (5.42) | 1057 (7.72) |
| Discussed about contraceptive use at the health facility | ||
| No | 2340 (17.51) | 5241 (39.22) |
| Yes | 2466 (18.46) | 3315 (24.81) |
| Partner's desire for more children | ||
| Both want the same | 2000 (14.97) | 3119 (23.34) |
| Partner wants more | 1201 (8.99) | 2168 (16.23) |
| Partner wants fewer | 423 (3.17) | 676 (5.06) |
| Do not know | 1182 (8.85) | 2593 (19.41) |
| Know about contraception side effects | ||
| No | 1074 (8.04) | 1862 (13.94) |
| Yes | 3732 (27.93) | 6694 (50.10) |
| Preferred waiting time for the birth of another child | ||
| < 12 months | 531 (3.97) | 1296 (9.50) |
| 1 year | 282 (2.11) | 302 (2.26) |
| 2 years | 561 (4.20) | 586 (4.39) |
| 3 years | 588 (4.40) | 695 (5.2) |
| 4 years | 336 (2.51) | 434 (3.25) |
| 5 years | 768 (5.75) | 917 (6.86) |
| 6+ years | 318 (2.38) | 589 (4.41) |
| Immeasurable | 1219 (9.12) | 3435 (25.71) |
| Do not know | 203 (1.52) | 329 (2.46) |
Table 2 shows the minimum, median, and maximum values of the continuous background characteristics used in the study. It was observed that the minimum age of cohabitation for women in the study was 10 years, the median was 19 years, and the maximum age was 44 years. Moreover, the minimum age of the partner was 15 years, the median was 37 years, and the maximum was 95 years. Moreover, the minimum age of a woman was 15 years, the median was 27 years, and the maximum was 49 years. Furthermore, the minimum family size of a woman was 0, the median was 2, and the maximum was 14.
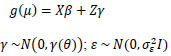
The constructed empirical semivariogram is displayed in Fig. (1). It was observed that the distance between clusters increased, and the distribution of the semivariogram was not uniform. Thus, inferences could be made about an indication of surface trend.
| Variable | Minimum | Median | Maximum |
|---|---|---|---|
| Age at first cohabitation | 10 | 19 | 44 |
| Age of a partner | 15 | 38 | 95 |
| Age of a woman | 15 | 27 | 49 |
| Family size | 0 | 2 | 14 |
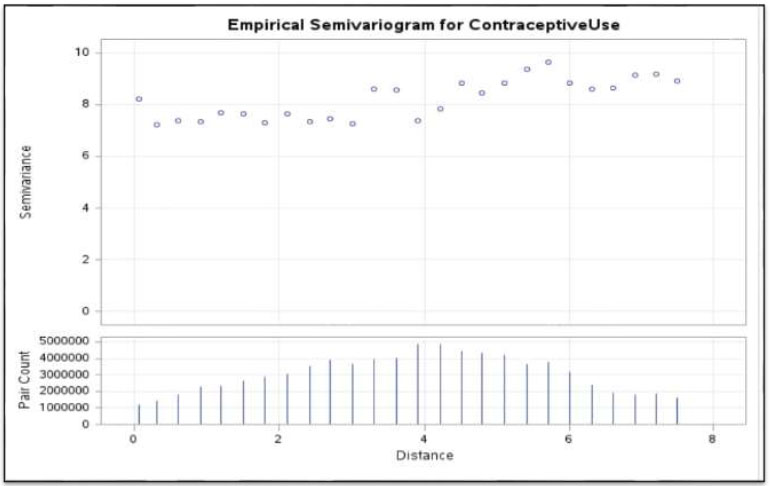
Fig. (2). displays the scatter plot of the contraceptive use data observed in Zambia. The plots suggest a distribution that is not indicative of a uniform distribution, but rather an indication of the random spread of the response. Therefore, direct inferences about the existence of surface trends in the data can be made.
The current study analyzed various explanatory variables to investigate their impact on women’s contraceptive use using a spatial generalized linear mixed model. The results are presented in Table 3. The level of significance used in the analysis was 5%. Women who had their first sexual intercourse between the ages of 15 and 24 were found to be 1.208 times more likely to use contraceptives compared to those who initiated sexual activity before the age of 15 (P-value = 0.0006). Similarly, women who had their first sexual intercourse between the ages of 25 and 34 were 1.605 times more likely to use contraceptives compared to those who initiated sexual activity before the age of 15 (P-value = 0.0304). Additionally, for each one-year increase in a woman’s age, the likelihood of contraceptive use decreases by a factor of 0.948 (P-value < 0.0001). A woman without any education was 0.527 times less likely to use contraceptives compared to a woman with higher education (P-value < 0.0001). A woman with only primary education was 0.738 times less likely to use contraceptives than a woman with higher education (P-value = 0.0123). Furthermore, for each additional person in a woman's family, the chance of her using contraceptives increases by 1.096 (P-value < 0.0001).
Empirical semivariogram of contraceptive use from the Zambia demographic and health survey.
Scatter plot for contraceptive use data from the Zambia demographic and health survey.
| Indicator | Estimate | S. E | aOR | P-value |
|---|---|---|---|---|
| Intercept | -0.1187 | 0.6205 | 0.8484 | |
| Age at first sex (ref = < 15 years) | ||||
| 15 - 24 years | 0.1887 | 0.05510 | 1.208 | 0.0006 |
| 25 - 34 years | 0.4731 | 0.2185 | 1.605 | 0.0304 |
| 35+ years | -4.9046 | 29.9776 | 0.007 | 0.8700 |
| Age of a woman | -0.05292 | 0.005339 | 0.948 | <0.0001 |
| Education level of a woman (ref = Higher education) | ||||
| No education | -0.6415 | 0.1412 | 0.527 | <0.0001 |
| Primary education | -0.3043 | 0.1202 | 0.738 | 0.0113 |
| Secondary education | -0.1266 | 0.1107 | 0.881 | 0.2530 |
| Family size | 0.09126 | 0.02209 | 1.096 | <0.0001 |
| Household wealth index (ref = Richest) | ||||
| Poorest | -0.3504 | 0.1114 | 0.704 | 0.0017 |
| Poorer | -0.2227 | 0.1045 | 0.800 | 0.0331 |
| Middle | -0.03532 | 0.09331 | 0.965 | 0.7051 |
| Richer | 0.009896 | 0.07846 | 1.010 | 0.8996 |
| Marital status of a woman (ref = Living with partner/married) | ||||
| Never in union | 0.6920 | 0.2260 | 0.640 | 0.0022 |
| Widowed | -1.5637 | 0.4263 | 0.183 | 0.0002 |
| Divorced | -0.1595 | 0.2135 | 0.514 | 0.4551 |
| No longer living together/separated | -0.1388 | 0.3332 | 0.444 | 0.6771 |
| Number of living children (ref = No children) | ||||
| 1 - 2 Children | 1.5460 | 0.5681 | 5.963 | 0.0065 |
| 3 - 4 Children | 2.3734 | 0.5683 | 11.897 | <0.0001 |
| 5+ Children | 2.4397 | 0.5774 | 14.152 | <0.0001 |
| Partner’s desire for more children (ref = Both want same) | ||||
| Partner wants more | -0.07458 | 0.05507 | 0.928 | 0.1757 |
| Partner wants fewer | 0.009029 | 0.08110 | 1.009 | 0.9114 |
| Do not know | -0.2727 | 0.05435 | 0.761 | <0.0001 |
| Place of residence (ref = Urban) | ||||
| Rural | -0.1982 | 0.07474 | 0.820 | 0.0080 |
| Preferred waiting time for the birth of another child (ref = <12 months) | ||||
| 1 Year | 1.1960 | 0.1278 | 1.190 | <0.0001 |
| 2 Years | 0.4953 | 0.1305 | 0.937 | 0.0001 |
| 3 Years | 0.2304 | 0.1265 | 0.886 | 0.0687 |
| 4 Years | 0.2188 | 0.1404 | 0.850 | 0.1192 |
| 5 Years | 0.1544 | 0.1215 | 0.615 | 0.2038 |
| 6+ Years | 0.1523 | 0.1425 | 0.628 | 0.2851 |
| Immeasurable | 0.3958 | 0.1104 | 0.920 | 0.0003 |
| Do not know | 0.2130 | 0.1676 | 0.863 | 0.2037 |
| Region (ref = North-Western) | ||||
| Central | -0.07713 | 0.1279 | 0.926 | 0.5465 |
| Copperbelt | -0.1069 | 0.1281 | 0.899 | 0.4039 |
| Eastern | 0.2149 | 0.1259 | 1.240 | 0.0879 |
| Luapula | -0.5457 | 0.1305 | 0.579 | <0.0001 |
| Lusaka | 0.08663 | 0.1268 | 1.090 | 0.4944 |
| Muchinga | 0.1429 | 0.1341 | 1.154 | 0.2863 |
| Northern | -0.4868 | 0.1330 | 0.615 | 0.0003 |
| Southern | -0.3245 | 0.1283 | 0.723 | 0.0114 |
| Western | -0.4397 | 0.1361 | 0.644 | 0.0012 |
| Discussed about family planning at a health facility (ref = Yes) | ||||
| No | -0.2175 | 0.04352 | 0.805 | <0.0001 |
| Woman’s employment status (ref = Employed) | ||||
| Unemployed | -0.2265 | 0.04591 | 0.797 | <0.0001 |
A woman from the poorest household was 0.704 times less likely to use contraceptives than a woman from the richest household (P-value = 0.0017). Similarly, a woman from a poorer household was 0.800 times less likely to use contraceptives compared to a woman from the richest household (P-value = 0.0331). Additionally, a woman who has never been in a union was 0.640 times less likely to use contraceptives than a woman who was married or living with a partner (P-value = 0.0022). A widowed woman was 0.183 times less likely to use contraceptives than a woman who was married or living with a partner (P-value = 0.0002). On the other hand, a woman with 1-2 living children was 5.963 times more likely to use contraceptives than a woman with no children (P-value 0.0065). A woman with 3-4 living children was 11.897 times more likely to use contraceptives than a woman with no children (P-value <0.0001). A woman with 5+ living children was 14.152 times more likely to use contraceptives compared to a woman with no children (P-value <0.0001).
Moreover, a woman who did not know their partner's desire for more children was 0.761 times less likely to use contraceptives than a woman who had the same desire for more children with a partner (P-value <0.0001). A woman living in rural areas was 0.819 times less likely to use contraceptive methods compared to a woman living in urban areas (P-value = 0.0076). A woman who preferred to wait 1 year for the birth of another child was 1.190 times more likely to use contraceptives compared to a woman who preferred to wait < 12 months (P-value <0.0001). On the other hand, a woman who preferred to wait 2 years for the birth of another child was 0.937 times less likely to use contraceptives compared to a woman who preferred to wait < 12 months (P-value = 0.0001). Additionally, a woman who preferred to wait a non-numeric period for the birth of another child was 0.920 times less likely to use contraceptives than a woman who preferred to wait < 12 months for the birth of another child (P-value = 0.0003).
As presented in Table 3, a woman from the Luapula region was 0.579 times less likely to use contraceptives than a woman from the North-Western region (P-value < 0.0001). Similarly, a woman from the Northern region was 0.615 times less likely to use contraceptives compared to her counterparts in the North-Western region (P-value = 0.0003). In the Southern region, a woman was 0.723 times less likely to use contraceptives than a woman in the North-Western region (P-value = 0.0114). A woman from the western region was 0.644 times less likely to use contraceptives compared to a woman in the North-Western region (P-value = 0.0012). Additionally, a woman who did not discuss family planning at a health facility was 0.805 times less likely to use contraceptives than a woman who did (P-value < .0001). Lastly, an unemployed woman was 0.797 times less likely to use contraceptives compared to an employed woman (P-value < 0.0001).
3.2. Interaction Effects
The current study examined various two-way interaction effects and found that the number of living children and a woman’s desire for more children, as well as the marital status of a woman and her preferred waiting time for the birth of another child, were significant. The expected probabilities of the joint effects between a woman's desire for more children and the number of living children are shown in Fig. (3). It was observed that a woman with no children had a lower likelihood of using contraceptives regardless of the desire for more children. Furthermore, a woman with no children and who wanted more but was unsure of the timing was observed to have a lower likelihood of using contraceptives. Moreover, a woman who had at least three children was more likely to utilize contraceptives than a woman who had at most 1 or 2 children, regardless of her desire for more children.
Fig. (4) shows the association between the preferred waiting period for the birth of another child and marital status. (Fig. 4) illustrates a high likelihood of contraceptive use among women who have never been married, as well as across all categories of preferred waiting time before the birth of another child. This likelihood of contraceptive use was found to be higher among married women across all categories of preferred waiting time for the birth of another child. Furthermore, widowed women had a lower likelihood of contraceptive use throughout their preferred waiting times for the birth of another child. A woman who has never been in a union, married, or widowed, and who would rather wait a year to have another child, had a higher likelihood of using contraceptives than other women. For a divorced woman, the possibility of contraceptive use throughout the recommended waiting period was also similar. Additionally, a woman who wished to wait three years for the birth of another child and was separated from her partner was more likely to take contraceptives.
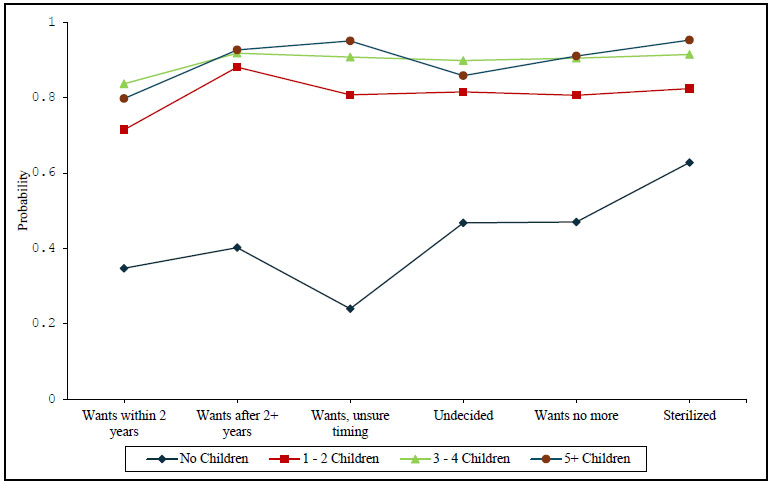
The likelihood of contraceptive use by the number of living children and women's desire for more children.
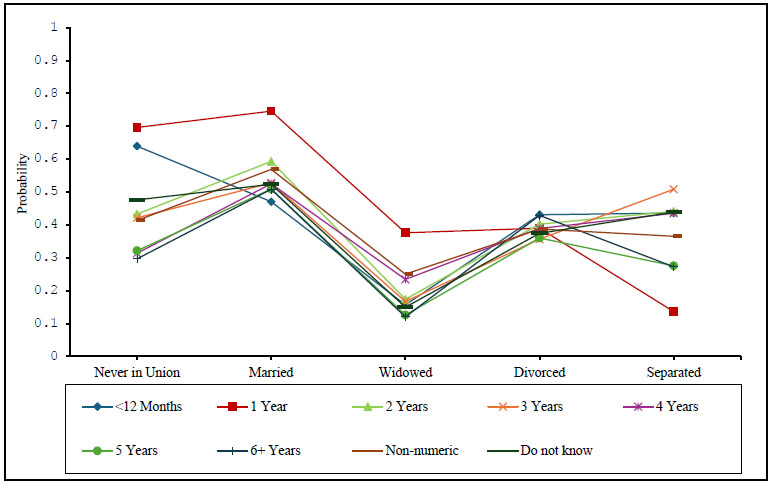
The likelihood of contraceptive use by marital status and preferred waiting time for the birth of another child.
3.3. Smooth Map
The outcomes of the spatial prediction process, as determined by interpolation using the ordinary kriging approach, are shown in Fig. (5). This graph illustrates the variation in district and region-specific contraceptive usage prevalence throughout Zambia. Contraceptive use was found to be similar among women who were closer to each other than it was among those who were more distant. In various parts of the same region, the prevalence of using contraceptives was very low, low, moderate, and high. This can be verified by the four distinct colors that this figure displays. It was noted that the prevalence of contraceptive use was very low, and almost non-existent in areas such as Lusaka, Muchinga, Eastern, and Central. Fig. (5) displays the distribution of contraceptive use in Zambia at the district level. Contraceptive use was very low in the North-Western and Northern regions. The Western, Eastern, Southern, and Luapula regions exhibited a low prevalence of contraceptive use, whereas Lusaka, Muchinga, Copperbelt, and Central indicated a high prevalence.
4. DISCUSSION
The current study assessed the spatial distribution and risk factors associated with contraceptive use among women of reproductive age in Zambia using the 2018 Demographic and Health Survey data conducted in this country. Generally, the study found 35.18% of women in this country to be using at least one of the available contraceptive methods. The study further revealed contraceptive use to be more common in women who began having sexual intercourse at a later age in life than in those who began at a younger age. However, the study identified women who began sexual intercourse at ages younger than the reproductive age (<15 years), highlighting a serious concern for the government and policymakers of Zambia, as these early experiences may indicate instances of sexual abuse or coercion. To our knowledge, no research has so far studied this variable. The findings of this study revealed that variations influence contraceptive use in women in factors, such as education level, wealth index, and place of residence. It was found that women with no education, from rural areas, and from the poorest households were less likely to use contraceptives. Similar findings regarding at least one of these factors have also been reported in other research studies [3-6, 8, 11].
The findings of this study revealed that contraceptive use is determined by demographic factors, such as family size and the number of live children. This study's findings revealed that a woman with a larger family or more living children was more inclined to use contraceptives. It was
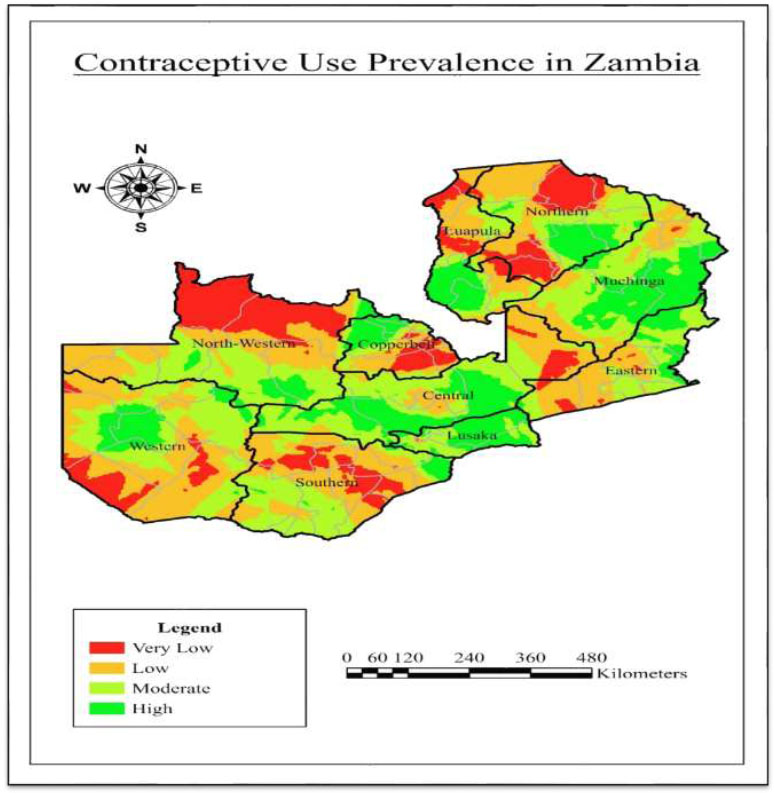
Prevalence of contraceptive use in Zambia.
discovered that older females were less inclined to use contraception. The use of contraceptives was discovered to be impacted by a woman's desired interval between the births of her children. Discussing family planning at healthcare centers was also found to impact women's utilization of contraceptives. Research results indicated that women who discussed family planning were more inclined to utilize contraceptives. Contraceptive use was less common among unmarried women or those not cohabiting. This finding aligns with the results of previous research works [4, 18, 19].
The current study also assessed the two-way interaction effects. It was found that the number of living children and a woman’s desire for more children were significantly associated with contraceptive use. The findings of this study revealed that contraceptive use by a woman increased with an increase in the number of living children, regardless of her desire for more children. The finding further revealed that an interaction between marital status and preferred waiting time for the birth of another child was significantly associated with contraceptive use. The findings revealed a high likelihood of contraceptive use among married women who wished to wait a shorter period for the birth of another child, while the likelihood of using contraceptives varied for unmarried women. To the best of our knowledge, neither of these interaction effects has been studied in any previous research literature.
CONCLUSION AND RECOMMENDATIONS
The main objective of this study was to spatially model, investigate, and gain insight into the factors associated with the widespread contraceptive use among women in Zambia. The findings of this study revealed that the critical factors associated with women's contraceptive use in Zambia were age at first sex, age of women, education level, family size, household wealth index, marital status, number of living children, partner’s desire for more children, place of residence, preferred waiting time for the birth of another child, region, discussion about family planning at a health facility, and employment status. The findings of this study also reported that the two-way interaction effects between the number of living children and a woman's desire for more children, as well as marital status and preferred waiting time for the birth of another child, were significantly associated with contraceptive use among women in Zambia.
The findings of the present study underscore the important factors contributing to the choice of whether a woman decides to use contraceptives. These factors suggest the need for targeted interventions in rural development and support for social welfare initiatives that provide poor communities with access to formal and informal education. In addition, the interventions need to enhance access to programs that educate and facilitate discussions, exchanges of ideas, and experiences among women of reproductive age in this country on family planning and the use of contraceptives. The policymakers and government of Zambia have previously launched several initiatives to boost the use of contraceptives in this nation. Based on the findings of this study, it has been noted that the prevalence of contraceptive use among women between 15 and 49 years is about 35.2%. This indicates an increase compared to a previous study [19] based on the 2013-14 DHS dataset. Nevertheless, this study also recommends targeted interventions in Zambia’s regional development, particularly in areas, such as the Northern and North-Western regions, where contraceptive use remains very low.
The findings of this study imply that the government departments, institutions, co-operating partners, implementing partners, and civil society organizations must work together to fulfill the government’s goals regarding family planning initiatives that prioritize providing universal access to sexual and reproductive health services, such as family planning, education, and information, while also incorporating reproductive health into national strategies. Furthermore, recent interventions in sub-Saharan Africa that could be adapted for Zambia have focused on innovative and integrated approaches to promote contraceptive use. One key approach has been the development of youth-friendly health services (YFHS), designed to address the unique needs of teenagers and young adults. These services prioritize confidentiality, respect for cultural differences, and easy access, which has led to a rise in contraceptive use among young people [32].
Governments and non-governmental organizations (NGOs) must collaborate to establish mobile clinics and digital platforms that provide information and access to contraceptives, particularly in remote or underserved areas, leveraging technology to overcome traditional barriers [33]. Another effective strategy is to have awareness campaigns, and mass media coverage also plays a vital role in changing perceptions about contraception. In Sub-Saharan Africa, radio shows and TV commercials have been designed to tackle local myths and misunderstandings related to contraception. Demand generation, advocacy, and community mobilization have effectively raised awareness, particularly among young people, and have changed social attitudes toward family planning [34]. Research literature has found these interventions to change attitudes towards and promote contraceptive use in different countries in Sub-Saharan Africa. Therefore, the government of Zambia and policymakers may consider these interventions to promote contraceptive use in the country.
By identifying effective interventions for contraceptive use, the Zambian government and policymakers can help the country meet several of the Sustainable Development Goals (SDGs), including promoting good health and well-being, achieving gender equality, and ensuring quality education. This approach would ultimately lessen the gaps in health, education, and economic opportunities for individuals and communities in this country. These interventions might include improving access to contraceptives, which are crucial for reproductive health, lowering maternal mortality rates, and preventing unintended pregnancies. Additionally, providing access to contraceptives enables women to make informed choices about their reproductive health, education, and involvement in the economy. This not only helps reduce teenage pregnancies but also allows girls to pursue their education. As a result, families can break the cycle of poverty and invest more in their children's education, leading to better educational outcomes.
STUDY LIMITATIONS
The study used cross-sectional data, which could not address the cause-and-effect relationship. Longitudinal data are suggested for future studies to address this cause-and-effect relationship.
AUTHORS’ CONTRIBUTIONS
All authors have accepted the responsibility for the content of the manuscript and its submission. They have reviewed the results and approved the final version of the manuscript.
LIST OF ABBREVIATIONS
| IUDs | = Intrauterine devices |
| ICPD | = International conference on population and development |
| ZDHS | = Zambia demographic and health survey |
| PPS | = Probability proportional to size |
| GIS | = Geographic information systems |
| YFHS | = Youth-friendly health services |
| SDGs | = Sustainable development goals |
ETHICAL STATEMENT
The study utilized secondary data from the 2018 Zambia Demographic and Health Survey (ZDHS). The survey was conducted by the Zambia Statistics Agency, in collaboration with the Ministry of Health, the University Teaching Hospital Virology Laboratory (UTH-VL), and the Department of Population Studies at the University of Zambia (UNZA). The permission to use this de-identified data was granted through the DHS program.
AVAILABILITY OF DATA AND MATERIALS
The data set used in this study is freely available to all users with permission to access and use the data at https://dhsprogram.com/data/dataset/Zambia_Standard-DHS_2018.cfm?flag=1.
ACKNOWLEDGEMENTS
The authors acknowledge the support of the Zambia Statistics Agency, the Ministry of Health, the University Teaching Hospital Virology Laboratory, the Department of Population Studies at the University of Zambia, and the National Steering Committee.

