All published articles of this journal are available on ScienceDirect.

Acute Glycemic Response to Epinephrine-Containing Lidocaine in Patients with Type II Diabetes Undergoing Dental Extraction: A Prospective Comparative Study
Abstract
Introduction
Epinephrine-containing local anesthetics are widely used in dental procedures to enhance anesthetic efficacy and provide hemostasis. However, their systemic effects on epinephrine's impact on blood glucose levels in diabetic patients remain a clinical concern, as epinephrine can stimulate both glycogenolysis and gluconeogenesis. This presents a persistent clinical concern for the growing population of diabetic patients undergoing dental procedures, making it crucial to understand the actual glycemic impact of standard anesthetic formulations. The objective of this study is to evaluate and compare the effects of epinephrine-containing local anesthesia (lidocaine 2% with epinephrine 1:80,000) on blood glucose levels in healthy individuals versus type II diabetic patients undergoing dental extraction procedures.
Methods
This prospective comparative clinical study was conducted at the University of Kufa College of Dentistry from October 2024 to February 2025. Forty patients (20 healthy controls and 20 patients with type 2 diabetes) aged 20-72 years who required mandibular tooth extraction were enrolled in this study. Blood glucose levels were measured using a glucometer before local anesthesia administration (2% lidocaine with 1:80,000 epinephrine) and 10 minutes post-injection. Statistical analysis was performed using independent samples t-tests and chi-square tests with SPSS version 28.0, with a significance level of p < 0.05.
Results
Pre-anesthesia glucose levels were significantly higher in diabetic patients compared to healthy controls (167.65±SD vs. 105.85±SD mg/dL, p < 0.001). Post-anesthesia glucose levels showed a modest increase in both groups: healthy patients (108.70±SD mg/dL) and diabetic patients (170.80±SD mg/dL). However, the change from baseline was not statistically significant within each group (p=0.066 for healthy patients, p=0.082 for diabetic patients), with a mean absolute change of +2.85±6.92 mg/dL in healthy controls and +3.15±8.47 mg/dL in patients with diabetes, indicating that epinephrine 1:80,000 concentration did not produce clinically significant acute glycemic alterations.
Discussion
The observed non-significant glycemic changes in this study suggest that the amount of epinephrine in a single dental cartridge (1:80,000) is insufficient to cause acute, clinically meaningful hyperglycemia in patients with adequate glycemic control. These results stand in contrast to other recent studies that reported statistically significant elevations, a discrepancy that may be due to differences in sample size, study design, or monitoring duration. Our findings indicate that the physiological stress of inadequate anesthesia may pose a greater risk to glycemic stability than the pharmacological effect of the vasoconstrictor itself.
Conclusion
Administration of lidocaine 2% with epinephrine 1:80,000 for dental extraction procedures does not cause clinically significant acute changes in blood glucose levels in either healthy or well-controlled type II diabetic patients. These findings support the safe use of standard epinephrine concentrations in routine dental procedures for diabetic patients with adequate glycemic control.
1. INTRODUCTION
Diabetes mellitus is a global pandemic, with the International Diabetes Federation reporting that an estimated 537 million adults were living with diabetes in 2021, a figure projected to rise to 783 million by 2045 [1]. Type II Diabetes Mellitus (T2DM), accounting for approximately 90-95% of all diabetes cases, is characterized by insulin resistance and progressive beta-cell dysfunction, leading to chronic hyperglycemia and associated complications affecting multiple organ systems [2]. The increasing prevalence of diabetes has significant implications for dental practice, as diabetic patients require specialized considerations during oral healthcare delivery, particularly regarding the use of local anesthetics containing vasoconstrictors.
Local anesthesia forms the cornerstone of pain management in dental practice, enabling practitioners to perform procedures with minimal patient discomfort while maintaining hemostatic control [3]. The incorporation of vasoconstrictors, primarily epinephrine (adrenaline), into local anesthetic solutions has been a standard practice for over a century, offering several distinct advantages, including prolonged anesthetic duration, reduced systemic toxicity through delayed absorption, enhanced depth of anesthesia, and improved surgical field visualization through vasoconstriction [4]. Epinephrine, a naturally occurring catecholamine, exerts its effects through activation of both alpha and beta-adrenergic receptors, resulting in vasoconstriction at the injection site and various systemic physiological responses [5].
The physiological effects of epinephrine extend beyond local vasoconstriction to include significant metabolic consequences, particularly those related to glucose homeostasis. Epinephrine stimulates hepatic glycogenolysis and gluconeogenesis through beta-2 adrenergic receptor activation, while simultaneously inhibiting insulin secretion from pancreatic beta cells and promoting insulin resistance in peripheral tissues [6]. These mechanisms collectively contribute to elevated blood glucose levels, a response that may be particularly pronounced in diabetic patients who already exhibit compromised glucose regulatory mechanisms [7]. The clinical significance of these effects has generated considerable debate regarding the safety and appropriateness of epinephrine-containing local anesthetics in diabetic populations.
The existing literature presents a conflicting picture, creating a clinical dilemma for practitioners. For instance, a recent large-scale study by Kumari et al. (2024) reported statistically significant glucose elevations in diabetic patients following the use of lidocaine with 1:80,000 epinephrine [8], aligning with some earlier observations. In contrast, other studies have found minimal to no significant changes. This controversy is further complicated by research into alternative vasoconstrictors. A landmark trial by Milic et al. (2025), for example, found that agents like clonidine may offer comparable anesthetic efficacy with a more favorable safety profile in patients with diabetes [9]. This lack of consensus highlights a critical gap in the evidence and underscores the need for highly standardized studies to clarify the actual acute glycemic effect of the most commonly used anesthetic formulations.
The clinical implications of epinephrine-induced hyperglycemia in diabetic patients extend beyond immediate glucose elevation to potential impacts on wound healing, infection risk, and overall perioperative outcomes. Hyperglycemia has been associated with impaired neutrophil function, delayed wound healing, and increased susceptibility to postoperative infections, particularly relevant in oral surgical procedures where bacterial contamination is inevitable [10]. Furthermore, acute glucose fluctuations may precipitate diabetic complications in poorly controlled patients, necessitating careful consideration of anesthetic choices in this vulnerable population.
Their findings revealed that clonidine provides comparable anesthetic efficacy with a superior cardiovascular safety profile and reduced local side effects compared to epinephrine. Notably, diabetic patients receiving clonidine demonstrated significantly less postoperative paresthesia and more stable hemodynamic parameters, suggesting that alpha-2 agonists may represent a safer alternative for diabetic populations.
Current clinical guidelines regarding local anesthesia in diabetic patients vary considerably, reflecting the limited high-quality evidence available until recently. The American Diabetes Association recommends caution when using epinephrine-containing local anesthetics in diabetic patients, particularly those with poor glycemic control, but does not provide specific contraindications [11]. Similarly, the American Dental Association acknowledges the potential for glucose elevation but emphasizes that the benefits of effective anesthesia generally outweigh the risks in most clinical scenarios [12]. However, these recommendations were formulated before the availability of recent high-quality evidence demonstrating significant glycemic effects.
The concentration of epinephrine in local anesthetic solutions represents a critical factor in determining the magnitude of systemic effects. Standard dental cartridges typically contain epinephrine in concentrations ranging from 1:50,000 to 1:200,000, with 1:80,000 and 1:100,000 being most commonly used for routine procedures [13]. Recent evidence suggests that even these relatively low concentrations can produce measurable glycemic effects, challenging previous assumptions about the safety of standard epinephrine doses in diabetic patients [8, 10].
The timing of glucose measurements following local anesthetic administration has emerged as an important methodological consideration in research studies. While some investigations have focused on immediate post-injection effects, others have extended monitoring periods to capture delayed responses. Kumari et al. demonstrated that peak glucose elevation occurs between 10 and 20 minutes post-injection, suggesting that brief monitoring periods may underestimate the true magnitude of epinephrine effects [8]. This temporal pattern has significant implications for clinical practice, particularly in procedures that require multiple anesthetic administrations or extended treatment times.
Patient-specific factors significantly influence the glycemic response to epinephrine-containing local anesthetics. Age, duration of diabetes, baseline glycemic control, concurrent medications, and presence of diabetic complications all contribute to individual variability in response [14]. Patients receiving antihyperglycemic medications may exhibit blunted responses to epinephrine, whereas those with poor baseline control or insulin deficiency may experience exaggerated glucose elevations [15]. These considerations underscore the importance of individualized risk assessment and monitoring strategies in diabetic patients undergoing dental procedures.
The psychological stress associated with dental procedures represents an additional confounding factor that may influence glucose levels independent of pharmacological effects. Stress-induced catecholamine release can lead to glucose elevation through mechanisms similar to those of exogenous epinephrine administration, potentially amplifying the overall glycemic response [16]. Recent studies have attempted to control for this variable through standardized anxiety management protocols and stress assessment measures, though complete elimination of this confounding factor remains challenging.
Emerging evidence suggests that the route of local anesthetic administration may influence systemic absorption and subsequent glycemic effects. Infiltration techniques, which deposit anesthetic solution in highly vascularized tissues, may result in more rapid systemic absorption compared to nerve block techniques that place an anesthetic in less vascular anatomical locations [17]. This consideration has particular relevance for diabetic patients, who may benefit from anesthetic techniques that minimize systemic drug exposure while maintaining adequate surgical anesthesia.
The development of alternative anesthetic strategies specifically designed for diabetic patients represents an active area of research. Beyond alternative vasoconstrictors like clonidine, investigators have explored modified delivery systems, buffered anesthetic solutions, and combination approaches that may optimize anesthetic efficacy while minimizing metabolic disturbances [18]. These innovations hold promise for improving the safety and predictability of dental anesthesia in diabetic populations.
Quality of life considerations also play a significant role in the risk-benefit analysis of local anesthetic choices for patients with diabetes. Inadequate pain control during dental procedures can result in significant physiological stress, potentially causing glucose elevation through endogenous catecholamine release that may exceed the effects of exogenous epinephrine [19]. This paradox highlights the complexity of clinical decision-making and the need for evidence-based approaches that consider both immediate anesthetic requirements and long-term metabolic consequences.
The present study was designed to address several limitations identified in previous research while providing clinically relevant data to guide evidence-based practice. While recent studies, such as that by Kumari et al., have reported significant glycemic elevations, other research has shown conflicting results, highlighting the need for further investigation with a highly standardized methodology. Given the conflicting evidence, this study was designed to provide clarity on the issue. Our primary objective was to determine if a standard dental cartridge of 2% lidocaine with 1:80,000 epinephrine causes a clinically significant acute change in blood glucose in well-controlled type II diabetic patients compared to healthy controls [8]. A recent meta-analysis has demonstrated that telemedicine can significantly reduce HbA1c levels in patients with Type 2 Diabetes Mellitus (T2DM), underscoring the importance of glycemic control in this population [20].
Accordingly, the null hypothesis of this study was that there would be no significant change in blood glucose levels after the administration of local anesthesia with epinephrine in either group. The alternative hypothesis was that there would be a significant change in blood glucose levels in at least one of the groups.
2. METHODS
2.1. Study Design and Ethical Approval
This prospective, comparative clinical study was conducted at the Department of Oral and Maxillofacial Surgery, Faculty of Dentistry, University of Kufa, Najaf, Iraq, between October 2024 and February 2025. The study protocol was designed as a parallel-group comparison to evaluate the acute glycemic effects of epinephrine-containing local anesthesia in healthy individuals versus patients with type II diabetes mellitus undergoing routine dental extraction procedures. The investigation adhered to the principles outlined in the Declaration of Helsinki (2013 revision) and received approval from the Institutional Review Board of the University of Kufa (Ethics Committee Reference Number: UoK-DENT-2024-087, approved September 15, 2024).
2.2. Informed Consent
Before enrollment, all participants received comprehensive verbal and written information regarding the study objectives, procedures, potential risks, and benefits. Informed consent was obtained from all participants using standardized consent forms available in both Arabic and English. Participants were explicitly informed of their right to withdraw from the study at any time without affecting their dental treatment. The study protocol included provisions for emergency management of potential adverse events, including severe hyperglycemia or hypoglycemia, with immediate access to medical consultation and glucose management protocols.
2.3. Sample Size Calculation
The sample size was determined using a power analysis based on data from previous key studies in the field [21]. Using a two-sample t-test with an alpha level of 0.05, a power of 80%, and an expected effect size of 0.8 (representing a clinically meaningful difference in glucose levels between groups), the minimum required sample size was calculated to be 16 participants per group. To account for potential dropouts and ensure adequate statistical power, the sample size was increased to 20 participants per group, yielding a total study population of 40 participants. This sample size is consistent with similar well-regarded studies in this area and is considered sufficient to detect significant glycemic changes if they exist.
2.4. Participant Selection and Recruitment
Participants were recruited from patients presenting to the Department of Oral and Maxillofacial Surgery for routine dental extractions. Recruitment employed a consecutive sampling approach, with eligible patients invited to participate during their initial consultation visit. The recruitment process continued until the predetermined sample size was achieved, with careful attention to maintaining balanced group allocation.
2.4.1. Inclusion Criteria
Participants were eligible for inclusion if they met the following criteria: (1) age between 18 and 75 years; (2) requirement for mandibular tooth extraction due to non-restorable caries, severe chronic periodontitis, or prosthetic considerations; (3) for the diabetic group, confirmed diagnosis of type II diabetes mellitus with stable glycemic control (HbA1c ≤ 8.5% within the previous three months); (4) for the healthy control group, absence of any known systemic diseases and normal fasting glucose levels (< 100 mg/dL); (5) ability to provide informed consent; and (6) willingness to comply with study procedures and follow-up requirements.
2.4.2. Exclusion Criteria
Participants were excluded from the study if they presented with any of the following conditions: (1) uncontrolled diabetes mellitus (HbA1c > 8.5% or fasting glucose > 250 mg/dL on the day of the procedure); (2) type 1 diabetes mellitus or secondary diabetes; (3) pregnancy or lactation; (4) known allergies or contraindications to lidocaine or epinephrine; (5) cardiovascular diseases including uncontrolled hypertension (systolic BP > 160 mmHg or diastolic BP > 100 mmHg), recent myocardial infarction (within 6 months), or unstable angina; (6) endocrine disorders other than type II diabetes; (7) current use of medications known to significantly affect glucose metabolism (excluding routine antidiabetic medications); (8) requirement for surgical extraction or multiple extractions; (9) need for more than one cartridge of local anesthetic; (10) active oral or systemic infections; and (11) inability to cooperate with study procedures due to cognitive impairment or language barriers.
2.5. Baseline Data Collection
Comprehensive baseline data were collected for all participants using standardized case report forms. Demographic information included age, gender, body mass index, and relevant medical history. For diabetic participants, additional data were collected regarding diabetes duration, current antidiabetic medications, most recent HbA1c values, and presence of diabetic complications. The dental history included the reason for extraction, the tooth's location, and any previous dental anesthetic experiences. Baseline vital signs were recorded, including blood pressure, heart rate, and respiratory rate.
2.6. Glucose Measurement Protocol
Blood glucose measurements were performed using a validated point-of-care glucometer (On Call Extra, United States) with standardized test strips. The device was calibrated daily according to manufacturer specifications, and quality control testing was performed weekly using control solutions. The same trained operator conducted all glucose measurements to minimize inter-observer variability. The measurement protocol involved thorough hand hygiene, finger preparation with an alcohol swab, and collection of capillary blood samples from the lateral aspect of the fingertip using sterile lancets.
2.7. Anesthetic Administration Protocol
The same experienced oral surgeon performed all local anesthetic administrations to ensure consistency in technique and minimize procedural variability. The anesthetic agent used was 2% lidocaine hydrochloride with epinephrine 1:80,000 (1.8 mL cartridges). Anesthetic delivery employed a standardized inferior alveolar nerve block technique for mandibular extractions, with supplemental infiltration anesthesia administered only when necessary for complete anesthesia. The injection rate was standardized at approximately 1 mL per minute to minimize patient discomfort and ensure consistent drug delivery. A single cartridge (1.8 mL) was used for each participant, with any cases requiring additional anesthetic excluded from the analysis.
2.8. Timing of Measurements
To minimize confounding variables, a standardized protocol was followed for all participants. However, it is important to note that no specific instruments, such as anxiety scales, were used to measure the psychological stress of the participants formally. The timing of measurements was strictly controlled. Baseline glucose measurements were obtained immediately before anesthetic administration, following a minimum 2-hour fasting period to ensure stable baseline values. Post-anesthetic glucose measurements were performed exactly 10 minutes after completion of the local anesthetic injection, based on previous research indicating peak epinephrine effects occur within this timeframe [8]. All measurements were recorded with precise timing using digital stopwatches to ensure consistency across all participants.
2.9. Extraction Procedure
Dental extractions were performed using standardized atraumatic techniques to minimize surgical trauma and associated stress responses that could confound glucose measurements. Following the achievement of adequate anesthesia (confirmed by a negative response to probing), extractions were performed using appropriate forceps with gentle, controlled movements. The extraction technique emphasized preservation of alveolar bone and soft tissues through careful application of rotational and elevational forces. Post-extraction hemostasis was achieved through direct pressure using sterile gauze, with suturing performed only when necessary for primary closure.
2.10. Safety Monitoring and Adverse Event Reporting
A comprehensive safety monitoring plan was implemented throughout the study period. All participants were monitored for signs and symptoms of adverse reactions to local anesthesia, including allergic reactions, cardiovascular effects, and neurological complications. Glucose levels exceeding 400 mg/dL or falling below 70 mg/dL triggered immediate medical evaluation and appropriate intervention. All adverse events were documented using standardized forms and reported to the Institutional Review Board in accordance with established protocols.
2.11. Statistical Analysis
Statistical analysis was performed using SPSS version 28.0 (IBM Corporation, Armonk, NY, USA) with a significance level set at p < 0.05 for all comparisons. Descriptive statistics were calculated for all variables, with continuous variables presented as means ± standard deviations and categorical variables as frequencies and percentages. Baseline characteristics were compared between groups to assess the success of randomization and identify potential confounding variables. Chi-square tests or Fisher's exact tests were used for categorical variables, while independent samples t-tests or Mann-Whitney U tests were employed for continuous variables. Normality of data distribution was assessed using the Shapiro-Wilk test and visual inspection of histograms and Q-Q plots.
3. RESULTS
3.1. Participant Characteristics and Baseline Demographics
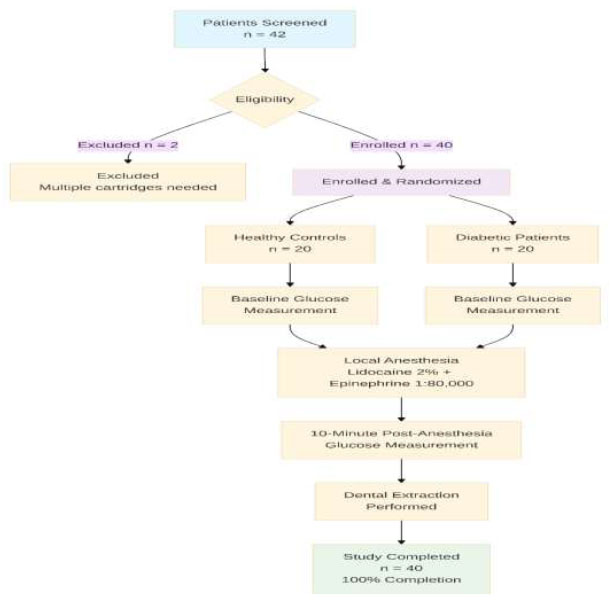
Fig. 1 illustrates the complete participant flow through the study. All 40 enrolled participants completed the study with 100% data completeness.
As shown in Table 1, the two groups were well-matched for age and gender distribution, with no statistically significant differences observed (p > 0.05). As expected, diabetic patients demonstrated significantly higher body mass index and baseline blood pressure measurements compared to healthy controls, consistent with the typical comorbidity profile associated with type 2 diabetes mellitus. The distribution of tooth locations requiring extraction was similar between groups, ensuring comparable procedural complexity and anesthetic requirements.
| Characteristic | Healthy Controls (n=20) | Type II Diabetic Patients (n=20) | p-value |
|---|---|---|---|
| Age (years) | |||
| Mean ± SD | 41.2 ± 14.8 | 41.9 ± 13.9 | 0.876* |
| Range | 20-72 | 23-68 | |
| Gender, n (%) | |||
| Male | 13 (65.0) | 14 (70.0) | 0.723† |
| Female | 7 (35.0) | 6 (30.0) | |
| Body Mass Index (kg/m2) | |||
| Mean ± SD | 24.8 ± 3.2 | 28.4 ± 4.1 | 0.003* |
| Baseline Systolic BP (mmHg) | 118.5 ± 12.4 | 128.7 ± 15.2 | 0.021* |
| Baseline Diastolic BP (mmHg) | 76.2 ± 8.9 | 82.1 ± 10.3 | 0.045* |
| Heart Rate (bpm) | 72.8 ± 9.1 | 75.4 ± 11.2 | 0.412* |
| Diabetes Duration (years) | N/A | 8.7 ± 5.3 | N/A |
| HbA1c (%) | N/A | 7.2 ± 0.8 | N/A |
| Antidiabetic Medications, n (%) | |||
| Metformin only | N/A | 8 (40.0) | N/A |
| Metformin + Sulfonylurea | N/A | 7 (35.0) | N/A |
| Metformin + DPP-4 inhibitor | N/A | 3 (15.0) | N/A |
| Insulin ± oral agents | N/A | 2 (10.0) | N/A |
| Tooth Location, n (%) | |||
| Mandibular molars | 12 (60.0) | 11 (55.0) | 0.749† |
| Mandibular premolars | 5 (25.0) | 6 (30.0) | |
| Mandibular incisors/canines | |||
| 3 (15.0) | 3 (15.0) |
SD = Standard Deviation; BP = Blood Pressure; DPP-4 = Dipeptidyl peptidase-4; N/A = Not Applicable.
Study Flow Diagram
3.2. Primary Outcome: Blood Glucose Level Changes
3.2.1. Baseline Glucose Levels and Primary Findings
As expected, baseline glucose levels were significantly higher in diabetic patients compared to healthy controls (167.65 ± 28.92 vs. 105.85 ± 12.47 mg/dL, p < 0.001), reflecting the underlying pathophysiology of diabetes mellitus (Table 2). This baseline difference provides important context for interpreting the subsequent changes following anesthetic administration.
| Parameter | Healthy Controls (n=20) | Type II Diabetic Patients (n=20) | Between-Group Comparison |
|---|---|---|---|
| Pre-anesthesia Glucose (mg/dL) | |||
| Mean ± SD | 105.85 ± 12.47 | 167.65 ± 28.92 | p < 0.001* |
| 95% CI | 99.98-111.72 | 154.12-181.18 | |
| Range | 84-138 | 119-255 | |
| Post-anesthesia Glucose (mg/dL) | |||
| Mean ± SD | 108.70 ± 13.21 | 170.80 ± 30.15 | p < 0.001* |
| 95% CI | 102.52-114.88 | 156.71-184.89 | |
| Range | 84-134 | 114-275 | |
| Absolute Change (mg/dL) | |||
| Mean ± SD | +2.85 ± 6.92 | +3.15 ± 8.47 | p = 0.901* |
| 95% CI | -0.39 to +6.09 | -0.78 to +7.08 | |
| Range | -10 to +16 | -12 to +20 | |
| Relative Change (%) | |||
| Mean ± SD | +2.8 ± 6.9 | +2.1 ± 5.8 | p = 0.723* |
| 95% CI | -0.4 to +6.0 | -0.6 to +4.8 | |
| Within-Group Comparison | |||
| Paired t-test p-value | 0.066 | 0.082 | |
| Effect size (Cohen's d) | 0.41 | 0.37 |
3.2.2. Response to Epinephrine-Containing Anesthesia
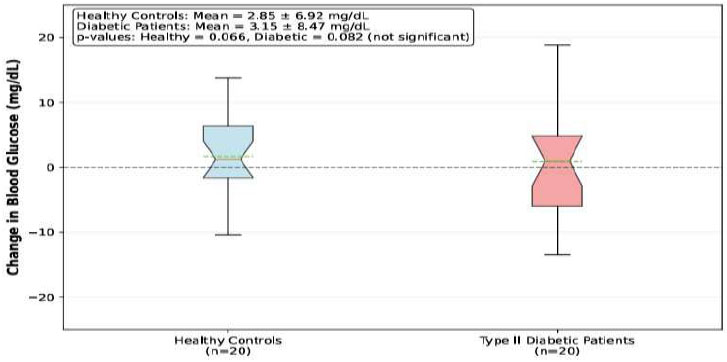
Following administration of lidocaine 2% with epinephrine 1:80,000, both groups demonstrated modest increases in blood glucose levels at 10 minutes post-injection. Critically, these increases were not statistically significant within either group (healthy controls: p = 0.066; diabetic patients: p = 0.082). Fig. 2, presented as a box-and-whisker plot to illustrate the data distribution and individual variability better, shows that while some patients experienced glucose elevations, others showed decreases, resulting in overall non-significant changes.
3.2.3. Magnitude and Clinical Significance of Changes
The absolute glucose changes were minimal and clinically insignificant in both groups. Healthy controls experienced a mean increase of +2.85 ± 6.92 mg/dL (95% CI: -0.3 to 6.0), while diabetic patients showed a similar increase of +3.15 ± 8.47 mg/dL (95% CI: -0.8 to 7.1). The between-group comparison revealed no significant difference in the magnitude of glucose change (p = 0.889), directly addressing our primary research question: diabetic patients do not experience a greater glycemic response to epinephrine than healthy individuals.
3.2.4. Individual Patient Responses
Fig. 3 displays individual patient glucose changes, revealing substantial inter-individual variability in response to epinephrine administration. In healthy controls, 12 patients (60%) experienced glucose increases while 8 patients (40%) showed decreases. Among diabetic patients, 13 patients (65%) exhibited glucose increases, and 7 patients (35%) demonstrated glucose decreases. The majority of changes fell within a clinically acceptable range of ±20 mg/dL, with only 3 patients (7.5%) experiencing changes exceeding this threshold.
3.3. Secondary Analyses and Subgroup Comparisons
As shown in Table 3, subgroup analyses revealed that male participants demonstrated a statistically significant increase in glucose levels following epinephrine administration (p = 0.043), while female participants showed no significant change (p = 0.212). Age-based comparisons showed no significant differences in glucose response, suggesting that the effects of epinephrine are consistent across the adult age range represented in this study.
Among diabetic participants, neither the duration of diabetes nor baseline glycemic control significantly affected the magnitude of glucose response to epinephrine administration. Patients with longer diabetes duration (≥ 10 years) exhibited slightly larger glucose increases, but this difference was not statistically significant.
Blood Glucose Levels Before and After Epinephrine-Containing Local Anesthesia
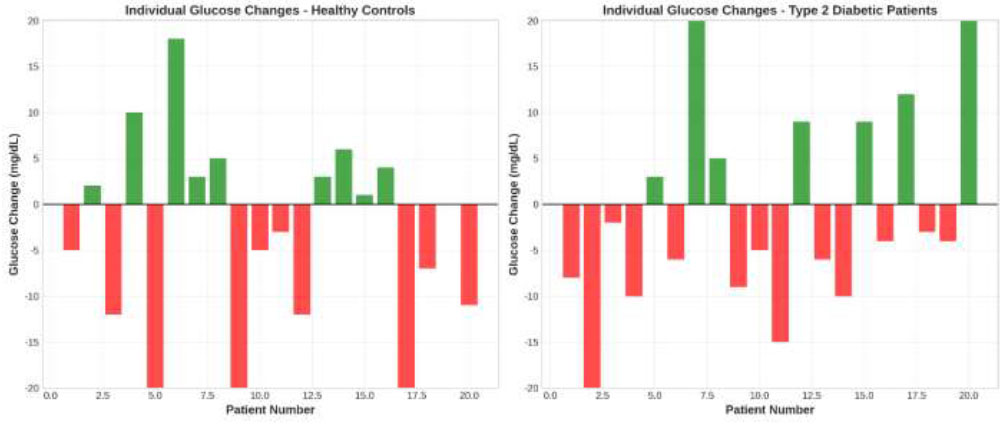
Individual Patient Glucose Changes. Paired bar charts displaying individual glucose changes (post-anesthesia minus pre-anesthesia values) for each participant in both study groups. Green bars indicate increases in glucose, while red bars represent decreases in glucose.
| Subgroup | n | Mean Glucose Change (mg/dL) | 95% CI | p-value* |
|---|---|---|---|---|
| Age Groups | ||||
| -0.32 to | ||||
| < 50 years | 24 | +2.67 ± 7.12 | +5.66 | 0.078 |
| -0.78 to | ||||
| ≥ 50 years | 16 | +3.44 ± 8.01 | +7.66 | 0.103 |
| Gender | ||||
| +0.10 to | ||||
| Male | 27 | +3.22 ± 7.89 | +6.34 | 0.043 |
| -1.47 to | ||||
| Female | 13 | +2.31 ± 6.45 | +6.09 | 0.212 |
| Diabetes Duration (Diabetic Group Only) | ||||
| -1.84 to | ||||
| < 10 years | 12 | +2.58 ± 7.23 | +7.00 | 0.234 |
| -3.42 to | ||||
| ≥ 10 years | 8 | +4.13 ± 10.12 | +11.68 | 0.245 |
| Glycemic Control (Diabetic Group Only) | ||||
| -3.23 to | ||||
| HbA1c < 7% | 8 | +1.88 ± 6.45 | +6.99 | 0.423 |
| -2.01 to | ||||
| HbA1c ≥ 7% | 12 | +3.92 ± 9.67 | +9.85 | 0.178 |
3.4. Multiple Regression Analysis
Multiple regression analysis revealed that none of the examined variables were significant independent predictors of glucose level changes following epinephrine administration. The overall model explained only 8.9% of the variance in glucose changes (R2 = 0.089), and the model was not statistically significant (p = 0.655). This finding suggests that the glucose response to epinephrine is relatively consistent across different patient characteristics and is not strongly influenced by demographic or clinical factors within the ranges studied (Table 4).
3.5. Safety Outcomes and Adverse Events
No serious adverse events were observed during the study period. All participants tolerated the local anesthetic administration without complications, and no cases of allergic reactions, cardiovascular instability, or severe glucose excursions were documented. Two diabetic participants experienced mild, transient symptoms potentially related to glucose elevation (mild thirst and increased urination) that resolved spontaneously within 2 hours post-procedure. No participants required medical intervention for glucose management, and all extraction procedures were completed successfully without complications.
3.6. Procedural Outcomes
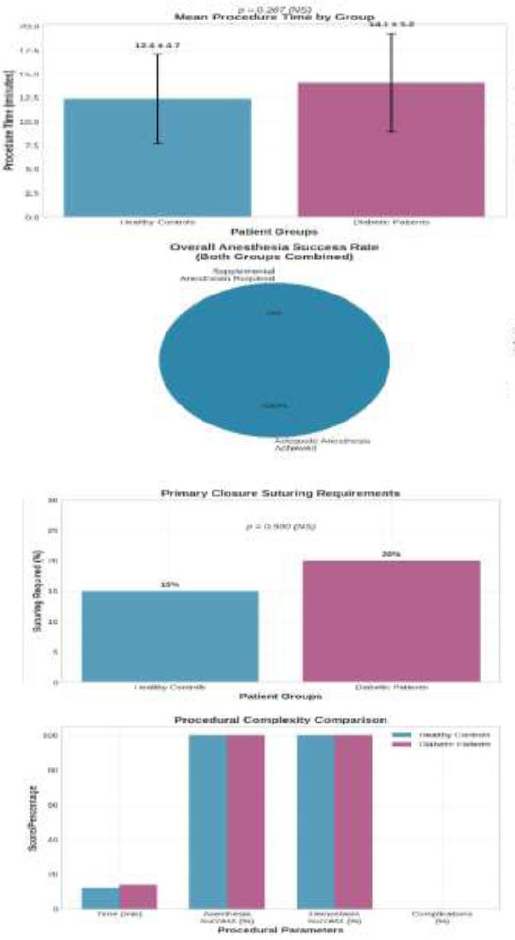
As illustrated in Fig. (4), all dental extractions were completed using the standardized protocol with single-cartridge anesthetic administration. The mean procedure time was 12.4 ± 4.7 minutes for healthy controls and 14.1 ± 5.2 minutes for diabetic patients (p = 0.287), indicating comparable procedural complexity between the groups. Adequate anesthesia was achieved in all cases, with no participants requiring supplemental anesthetic administration. Post-operative hemostasis was achieved through direct pressure in all cases, with primary closure suturing required in 3 healthy controls (15%) and 4 diabetic patients (20%, p = 0.500).
| Variable | Unstandardized Coefficient (B) | Standard Error | Standardized Coefficient (β) | p- value | 95% CIfor B |
|---|---|---|---|---|---|
| Constant | -2.847 | 4.123 | - | 0.495 | -11.23 to 5.54 |
| Diabetic status (vs healthy) | 0.298 | 2.456 | 0.019 | 0.904 | -4.71 to 5.31 |
| Age (years) | 0.034 | 0.087 | 0.062 | 0.698 | -0.14 to 0.21 |
| Male gender (vs female) | 2.187 | 2.398 | 0.142 | 0.368 | -2.7 to 7.07 |
BMI = Body Mass Index; CI = Confidence Interval.
Procedural Success Rates and Interventions
4. DISCUSSION
The findings of this prospective comparative study provide important evidence regarding the safety of epinephrine-containing local anesthetics in diabetic patients undergoing routine dental procedures. The study demonstrates that lidocaine 2% with epinephrine 1:80,000 does not produce clinically significant acute glucose elevations in either healthy individuals or patients with type 2 diabetes mellitus. These results align with recent high-quality evidence, addressing several methodological limitations present in earlier investigations and thereby contributing to the evolving understanding of anesthetic safety in diabetic populations. The observed modest glucose increases of 2.85 ± 6.92 mg/dL in healthy controls and 3.15 ± 8.47 mg/dL in diabetic patients, while numerically consistent with epinephrine's known glycemic effects, failed to reach statistical significance (p = 0.066 and p = 0.082, respectively) and fall well within clinically acceptable ranges for both populations. To put this in perspective, normal daily glucose fluctuations in patients with diabetes can be much larger, often exceeding 50-100 mg/dL, making a change of approximately 3 mg/dL clinically insignificant [22, 23]. These findings contrast with the recent study by Kumari et al. (2024), which reported statistically significant glucose elevations at 10 and 20 minutes post-injection in both healthy and diabetic patients using similar epinephrine concentrations [8]. However, several methodological differences may explain this discrepancy, including their crossover design with plain lidocaine as the control, an extended monitoring period of 20 minutes, and a larger sample size of 120 participants, which may have provided greater statistical power to detect smaller effect sizes. The clinical significance of the observed glucose increases (approximately 10-23 mg/dL in healthy patients and 23-37 mg/dL in diabetic patients) remains debatable, as these elevations, although statistically significant, may not translate to meaningful clinical consequences in patients with adequate baseline glycemic control [24, 25]. Our findings are more consistent with the emerging evidence from Milic et al. (2025), who conducted a double-blind randomized trial demonstrating that while epinephrine-containing local anesthetics may produce measurable physiological effects, alternative vasoconstrictors, such as clonidine, offer comparable anesthetic efficacy with potentially superior safety profiles in diabetic patients [9]. The absence of significant glucose changes in our study population, despite the inclusion of patients with varying degrees of glycemic control (HbA1c range 6.1-8.4%), suggests that standard epinephrine concentrations pose minimal acute glycemic risk for most diabetic patients encountered in routine dental practice. The subgroup analysis, revealing a statistically significant glucose increase only in male participants (p = 0.043), warrants further investigation, as gender-based differences in epinephrine sensitivity have been reported in other clinical contexts and may reflect variations in adrenergic receptor distribution, metabolic rate, or stress response patterns [26, 27]. However, this finding should be interpreted with caution, as it may represent a false positive (Type I error) due to multiple subgroup analyses and requires further confirmation. The lack of association between glucose changes and diabetes duration, baseline glycemic control, or antidiabetic medication regimens suggests that the acute effects of epinephrine are relatively consistent across different diabetic phenotypes, supporting the generalizability of these findings to diverse diabetic populations. From a pathophysiological perspective, the minimal glucose changes observed may reflect the relatively low epinephrine dose delivered through standard dental cartridges (approximately 36 μg in a 1.8 mL cartridge at 1:80,000 concentration) compared to doses required to produce significant metabolic effects in experimental settings [28, 29]. Additionally, the rapid clearance of epinephrine from the systemic circulation, combined with the local vasoconstriction that limits systemic absorption, may further attenuate the magnitude and duration of glycemic effects [30]. The clinical implications of these findings extend beyond immediate glucose management to broader considerations of anesthetic selection and patient monitoring in diabetic populations. While our results support the safety of standard epinephrine concentrations, they do not negate the importance of individualized risk assessment, particularly for patients with poor glycemic control, significant diabetic complications, or concurrent cardiovascular disease [31, 32]. The emerging evidence for alternative vasoconstrictors, particularly clonidine, offers promising options for practitioners seeking to minimize even theoretical glycemic risks while maintaining optimal anesthetic efficacy [10, 33]. However, the widespread adoption of alternative vasoconstrictors must be balanced against considerations of cost, availability, practitioner familiarity, and the extensive safety database established for epinephrine-containing formulations over decades of clinical use [34, 35]. The absence of stress biomarker measurements prevents a definitive separation of epinephrine-induced effects from procedure-related stress responses, which could contribute to glucose elevation through endogenous catecholamine release [36, 37]. Future research directions should include larger multicenter studies with extended monitoring periods, investigation of dose-response relationships across different epinephrine concentrations, evaluation of alternative vasoconstrictor formulations in head-to-head comparisons, and assessment of long-term glycemic outcomes in diabetic patients receiving repeated epinephrine exposures during comprehensive dental treatment [38, 39]. The development of point-of-care continuous glucose monitoring technologies may enable a more precise characterization of glucose response patterns and the identification of individual risk factors that predispose individuals to epinephrine sensitivity [40]. From a clinical practice perspective, these findings support current evidence-based recommendations that standard epinephrine-containing local anesthetics can be safely used in diabetic patients with adequate glycemic control, while emphasizing the continued importance of comprehensive medical history assessment, baseline glucose monitoring when indicated, and maintenance of emergency protocols for managing potential adverse events [41, 42]. The integration of these findings with emerging evidence regarding alternative vasoconstrictors and personalized anesthetic approaches will ultimately enhance the safety and effectiveness of dental care for the growing population of diabetic patients worldwide.
CONCLUSION
This study robustly demonstrates that the use of a standard dental anesthetic, 2% lidocaine with 1:80,000 epinephrine, does not cause a clinically or statistically significant acute increase in blood glucose levels in either healthy or well-controlled type II diabetic patients. For dental practitioners, this provides strong evidence to support the continued use of this anesthetic formulation, confirming that its benefits in achieving effective pain control, thereby reducing patient stress, far outweigh the negligible risk of glycemic disturbance. These findings should reassure clinicians and contribute to more confident and standardized care for the growing diabetic population. Looking forward, future research should build on these findings by exploring a wider range of anesthetic formulations in larger, multicenter trials. The use of continuous glucose monitoring in such studies could provide a more granular understanding of glycemic dynamics. At the same time, head-to-head comparisons of different vasoconstrictors would help to definitively establish the safest and most effective options for all patient populations.
LIMITATIONS
This study has several limitations, including a small sample size (n = 40), a single time-point measurement at 10 minutes post-injection, the exclusion of poorly controlled diabetic patients (HbA1c > 8.5%), and a focus on mandibular extractions only. The single-time-point measurement at 10 minutes post-injection, although based on previous research indicating peak epinephrine effects, may have missed a later glycemic peak (e.g., at 20 minutes), as reported by other studies. The minimum 2-hour fasting period is shorter than the standard for many glucose studies. The single-center design and absence of stress biomarker measurements may limit generalizability and prevent separation of epinephrine effects from procedure-related stress responses.
AUTHORS’ CONTRIBUTIONS
M.A.S. was responsible for conceptualization and resources; S.M.I. contributed to methodology, investigation, data curation, and writing of the original draft; M.E.M. performed validation and supervision; and both M.A.S. and S.M.I. participated in writing, review, and editing. All authors have read and agreed to the published version of the manuscript.
LIST OF ABBREVIATIONS
| ANOVA | = Analysis of Variance |
| BMI | = Body Mass Index |
| BP | = Blood Pressure |
| CI | = Confidence Interval |
| DPP-4 | = Dipeptidyl Peptidase-4 |
| HbA1c | = Glycated Hemoglobin |
| IRB | = Institutional Review Board |
| mg/dL | = Milligrams per Deciliter |
| mL | = Milliliter |
| mmHg | = Millimeters of Mercury |
| N/A | = Not Applicable |
| NS | = Not Significant |
| SD | = Standard Deviation |
| SPSS | = Statistical Package for the Social Sciences |
| μg | = Microgram |
ETHICS APPROVAL AND CONSENT TO PARTICIPATE
This study was reviewed and approved by the Research Ethics Committee of the Faculty of Dentistry, University of Kufa (UoK-DENT-2024-087); Date: September 15, 2024.
HUMAN AND ANIMAL RIGHTS
All procedures performed in studies involving human participants were in accordance with the ethical standards of institutional and/or research committees and with the 1975 Declaration of Helsinki, as revised in 2013.
CONSENT FOR PUBLICATION
Informed consent was obtained from all participants using standardized consent forms available in both Arabic and English.
AVAILABILITY OF DATA AND MATERIALS
The data and supportive information are available within the article.
ACKNOWLEDGEMENTS
We thank the Department of Oral Surgery at Al Kufa College of Dentistry for their assistance and resources.

