All published articles of this journal are available on ScienceDirect.

Adolescent BMI: The Importance of Intrinsic and Extrinsic Factors
Abstract
Objectives:
Research shows that weight trends in adolescence persist into adulthood, but do the same factors contribute to weight in adolescence as in adulthood? Are extrinsic factors presumably more important than intrinsic characteristics? This study identifies the correlation between BMI and various intrinsic and extrinsic factors and evaluates their relative importance in BMI development. It compares the primary determinants for adolescents (12-20 years old) and adults (21+ years old).
Methods:
Using 15 years of panel data, generalized linear models, we assessed the impact of extrinsic-environmental, biological, geographic and household-and intrinsic-sexual activity, substance use, desire to lose weight, etc.-characteristics on adolescent and adult BMI. Multinomial logit models tested the contribution of these characteristics to weight categories.
Results:
Race and age were the most significant BMI correlates at all ages. This remains true for weight classification as well. For young adolescents, intrinsic factors are highly deterministic, while extrinsic factors play no role. As adolescents age into adults, intrinsic factors continue to be deterministic, while extrinsic covariates also emerge as deterministic. Intrinsic determinates of significance include age of first sexual encounter, tobacco experimentation, perspective on general health, and desire to lose weight (or stay the same weight).
Conclusion:
While biological/genetic attributes are the largest determinants of BMI at every age, intrinsic factors play a larger role in adolescent BMI development than adults. As individuals age, intrinsic determinants remain important, but extrinsic characteristics contribute significantly to weight classification. Thus, the weight determinants differ between adolescents and adults suggesting different methods of policy intervention be used for adolescents and adults.
1. INTRODUCTION
Research shows that weight trends associated with Body Mass Index (BMI) perpetuate throughout life-overweight children become overweight adults-leading to high percentages of overweight individuals at all ages. Despite the persistence of high percentages of overweight individuals, research has not yet identified the cause of unhealthy weight in adolescence. A variety of social, environmental, and genetic factors have been linked to overweight, but no study has identified how/ways adolescent and adult weight development differs [1]. This study focuses on identifying whether intrinsic, extrinsic, or both types of factors significantly correlate with Body Mass Index (BMI) and whether these relationships change as adolescents age.
This paper assesses the intrinsic and extrinsic determinants of BMI using a 15-year panel (duration 1997 to 2011) from the National Longitudinal Survey of Youth 1997 (NLSY97). The analysis questions the relative strength of these relationships, how they vary over time, and it consists of three stages. First, analysis of covariance (ANCOVA) tests the strength of the relationship between BMI and selected intrinsic factors. Second, multilevel Generalized Linear Models (GLM) evaluate the relationship between adolescents age 12 to 20, and adults age 21 to 32 using BMI [1] and intrinsic and extrinsic covariates. Finally, multinomial logit regressions test the relationship between weight category (normal weight, overweight, obese) and the intrinsic/extrinsic factors.
Section I discusses what is known about BMI. Section II includes a description of the data and estimation methodology. Section III presents the estimation results from all three analyses. Results are discussed in Section IV, and Section V briefly concludes the primary findings.
1.1. Evidence from Related Literature
Previous research has explored the relationship between adolescent BMI and parental behavior, household circumstances, and inherited attribute [2]. As this analysis shows, BMI growth rates vary significantly by genetic and environmental characteristics, but racial and ethnic growth trajectories show significant heterogeneity-both before and after achievement of full growth [3, 4]. Freedman, Khan, and Sedula [5] showed black youth to have the highest BMI growth, but Markowitz and Cosminsky [6] find the highest rates of obesity among Hispanic [7]. The data used in this analysis finds that Hispanics are the heaviest group among males, but blacks are the heaviest among females. Considerable race, sex, and age differences have been shown to exist between overweight individuals and socioeconomic status, but these disparities have weakened over time [8].
Economists found that household characteristics impact BMI through food availability, income expenditure on food, and behavior [9]. Participation in food programs, nutrient intake, and income varies by household, and each of these factors impact weight [10]. Higher weights have been found among rural and southern residents, but they vary by race [11]. While moving to an urban area often results in weight loss, individuals with high BMIs are unlikely to move to, or live within, these areas [12]. Environmental effects are generally small, but neighborhood characteristics can minorly impact a child’s weight [13].Food prices at the local level could impact adolescent weight by altering the household budget constraint [14, 15].
Consistent with the findings in this study, research shows that maternal employment is positively related to childhood weight [16-19] as is maternal education [2, 3, 20, 21]. Overweight mothers increased the probability of adolescents being overweight-as did parents having low-levels of education [9]. Parents who perceive their neighborhood to be unsafe typically restrict their children's outdoor activities; and this correlation directly impacts BMI trajectories of adolescents [22].
While much research has been done to study the impact of observable factors, few researchers have explored unobservable, intrinsic characteristics. Meta et al. [23] explored the relationship between self-motivation, exercise motivation, and eating self-regulation, and they found that increased self-determination and exercise motivation lead to eating self-regulation and weight control within women. Individuals who managed their weight successfully were more likely to limit consumption of beverages sweetened with sugar, to decrease sedentary activity, to increase physical activity, and to increase their commitment to healthy lifestyle behaviors [24-26]. Adolescents who successfully lost weight were more likely to strictly control their eating and to monitor their weight [26, 27].
Other behavioral studies show high correlations between sexual activity and weight and body perception [28, 29]. Cigarette smoking is often an indicator of risk aversion, health habits and personal awareness adults, smoking is correlated with a greater risk of obesity, but few studies assess the impact of cigarette smoking on adolescents [30]. An individual’s expressed desire to lose or gain weight is neither correlated with behavior nor with unhealthy weight [31]; yet associations vary in relation to gender. There is, however, a strong relationship between an individual’s perception of his or her health and clinically-measured health indicators. Some research shows health perception to be a predictor of behavioral and physical outcomes [32, 33]
Qualitative studies addressing the issue of adolescent weight found that motivational factors for weight loss/management were intrinsic (e.g., desire for better health, desire to improve self-worth, desire for the approval of peers) rather than extrinsic [34, 35]. Support from parents has proven to be critical in personal health particularly among minority groups [36-38], but results vary by gender.
Much research has explored adolescent and adult BMI, but little research has directly questioned how the BMI correlates change as individuals age. Adult overweight and obesity has been associated with major technological, life style, eating, and activity characteristics [16, 39, 40], but strong relationships were not found among children and youth and lifestyle factors. Skipping breakfast is associated with health-compromising behaviors in both adults and adolescents [41], but shared household(s) was not controlled.
This study differs from previous analyses in several ways. First, it includes key intrinsic and extrinsic covariates in a single, large-scale, analysis. Second, it utilizes a nationally representative sample of longitudinal data for all covariates including observations for gender, race, and ethnicity. Third, it tests for differences within adolescent and adult BMI determination, and it evaluates how the strength of the covariate relationships varies with age.
2. MATERIALS AND METHODS
BMI is highly correlated with body fat and can be used to classify individuals as underweight, healthy weight, at risk of being overweight, or overweight using a nationally accepted rubric [42]. Among adults, BMI appears to be a satisfactory measure of body fat [43] especially if comparing across race and ethnicity [44]. Among adolescents, the CDC child and adolescent BMI thresholds are used to categorize individuals by weight status. Thresholds, expressed as percentiles, are designed to capture the category the individual would be in upon reaching young adulthood (if staying within the same BMI percentile).
For adolescents under 20, normal or healthy weight status is based on BMI between the 5th and 85th percentile. After age 20, BMI is interpreted using standard weight status categories, and normal weight equals BMI between 18.5 and 24.9. The standard weight status categories associated with BMI ranges for adults are shown in the following Table 1 along with the adolescent percentiles.
| Weight Status Category | Adolescent Percentile Range | Adult BMI Values |
|---|---|---|
| Age | 3-19 years | 20+ years |
| Underweight | Less than the 5th percentile | Below 18.5 |
| Normal or Healthy Weight | 5th percentile to less than the 85th percentile | 18.5 to 24.9 |
| Overweight | 85th to less than the 95th percentile | 25.0 – 29.9 |
| Obese | Equal to or greater than the 95th percentile | 30.0 and Above |
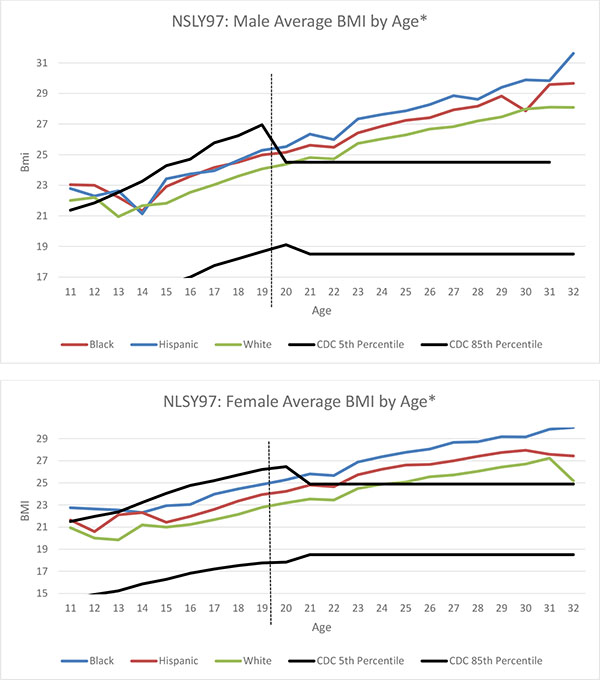
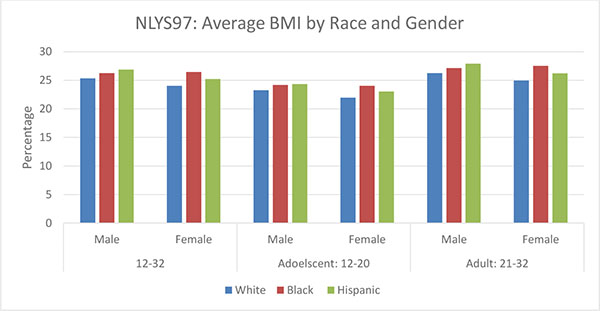
Fig. (1) shows average BMI for male and female racial and ethnic subgroups by age (measured in months. In the NLSY97, gender is self-assigned by respondents as either “male” or “female” in the first year of the survey assignment remains unchanged The two black lines represent the 5th and 85th percentiles for ages below 20 and BMI 18.5 and 24.9 for ages 20 and above. Therefore, the lines are parallel after age 20. The lines are disjointed due to changes in the way the CDC defines healthy weight for adolescents’ and adults’ BMI. Minority groups have higher BMI at all ages. Hispanic males and black females display higher BMI levels and steeper growth (Fig. 2) consistent with other studies [45, 46]. The proportion of underweight has also decreased among all groups, but BMI levels remain persistently high.
To maintain a balanced panel, the sample used in all three analyses only includes respondents with a BMI value in each year of the panel. While measurement and misspecification error is a concern in self-reported data, the data was cleaned to remove errant, inconsistent, and illogical values of height and weight. If BMI values were missing due to omitted height, height was imputed from nearby observations. Full height is achieved at relatively early ages; thus, imputations were unlikely to bias the sample which consisted of 4,205 individuals. Means are listed in Table 2. Minimum BMI is 12.5-underweight-and maximum BMI value is 55-overweight or obese-with an average of 25 and 26 for men and women respectively. BMI increases with growth and weight gain; however, rates differ by race and gender [47].
| Gender | Variable | N | Mean | Std Dev | Min | Max |
|---|---|---|---|---|---|---|
| Male | BMIt | 29,786 | 25.83 | 5.21 | 14.1 | 54.8 |
| Aget | 29,786 | 272.64 | 51.95 | 146 | 387 | |
| Black | 29,786 | 0.22 | 0.41 | 0 | 1 | |
| Hispanic | 29,786 | 0.19 | 0.39 | 0 | 1 | |
| Household Sizet | 29,783 | 3.51 | 1.67 | 1 | 19 | |
| Poverty/Income Ratiot | 21,341 | 380.97 | 376.92 | 0 | 3227 | |
| Urbant | 29,786 | 0.75 | 0.44 | 0 | 1 | |
| Northeast1997 | 29,786 | 0.16 | 0.37 | 0 | 1 | |
| Southt | 29,786 | 0.36 | 0.48 | 0 | 1 | |
| Age Sexual Activityt | 19,194 | 15.82 | 2.69 | 5 | 24 | |
| General Health Scoret | 29,780 | 1.98 | 0.91 | 1 | 5 | |
| Years Smokingt | 25,860 | 2.19 | 2.68 | 0 | 11 | |
| Stay Samet | 22,912 | 0.34 | 0.47 | 0 | 1 | |
| Lose Weightt | 29,620 | 0.30 | 0.46 | 0 | 1 | |
| Eating Disordert | 20,527 | 0.05 | 0.21 | 0 | 1 | |
| Mothers Education Less than High School1997 | 27,738 | 0.19 | 0.39 | 0 | 1 | |
| Mothers Education High School1997 | 27,738 | 0.36 | 0.48 | 0 | 1 | |
| Underweightt | 793 | 2.66 | - | - | - | |
| Normal Weightt | 14,233 | 47.78 | - | - | - | |
| Overweightt | 9,198 | 30.88 | - | - | - | |
| Obeset | 5,562 | 18.67 | - | - | - | |
| Female | BMIt | 27,830 | 24.86 | 5.72 | 12.5 | 54.9 |
| Aget | 27,830 | 271.81 | 52.10 | 147 | 385 | |
| Black | 27,830 | 0.25 | 0.43 | 0 | 1 | |
| Hispanic | 27,830 | 0.19 | 0.39 | 0 | 1 | |
| Household Sizet | 27,829 | 3.64 | 1.72 | 1 | 15 | |
| Poverty/Income Ratiot | 19,950 | 348.02 | 359.69 | 0 | 3227 | |
| Urbant | 27,830 | 0.77 | 0.42 | 0 | 1 | |
| Northeast1997 | 27,830 | 0.16 | 0.36 | 0 | 1 | |
| Southt | 27,830 | 0.38 | 0.49 | 0 | 1 | |
| Age Sexual Activityt | 16,870 | 16.34 | 2.12 | 5 | 24 | |
| General Health Scoret | 27,827 | 2.17 | 0.93 | 1 | 5 | |
| Years Smokingt | 23,433 | 1.88 | 2.52 | 0 | 11 | |
| Stay Samet | 22,531 | 0.26 | 0.44 | 0 | 1 | |
| Lose Weightt | 27,755 | 0.54 | 0.50 | 0 | 1 | |
| Eating Disorder t | 18,523 | 0.06 | 0.24 | 0 | 1 | |
| Mothers Education Less than High School1997 | 26,393 | 0.20 | 0.40 | 0 | 1 | |
| Mothers Education High School1997 | 26,393 | 0.34 | 0.47 | 0 | 1 | |
| Underweight | 1,559 | 5.60 | - | - | - | |
| Normal Weight | 15983 | 57.43 | - | - | - | |
| Overweight | 5,657 | 23,199 | - | - | - | |
| Obese | 4,631 | 16.64 | - | - | - |
Table 2 also includes mean statistics of intrinsic and extrinsic characteristics. Average respondent age (measured in months) is 272 months (22 years). Ages ranged from 146 to 204 months (12 to 17 years) in 1997 and 300 to 387 months (25 to 32 years) in 2011. Average age is 272 months (22 years). Average household size is 3.5 persons, but it decreases with age. Roughly 75 percent of the sample resides in an urban area, compared to 80 percent of the US population [48]. Dummy variables, northeast and south, control for regional differences, and the income/poverty ratio accounts for income level. Ratios below 1 indicate an income below poverty, while ratios of one or greater indicate income at least at the poverty level. The average ratio in the sample is between five and six-above poverty level. Maternal education is translated into two dummy variables: less than high school and high school completion. Less than 20 percent of mothers have less than a high school education, while 35 percent have completed high school.
Five intrinsic characteristics are used in the analysis-age of first sexual activity, number of years since first tobacco use, desired weight change action, and general health perception. The average age of the first sexual encounter is slightly under 16 years for males and slightly over 16 years for females. The indicatory for tobacco use measures the number of years since the respondent first used tobacco. Responses range from 0 to 11 years with an average between two and three years-implying that most respondents first tried tobacco in their mid to late teens. The NLSY97 captures desired weight action using a respondent selection of 1- Lose Weight, 2- Gain Weight, 3- Stay the same weight, and 4- Not Trying to Do Anything about My Weight. Analysis uses two dummy variables: lose weight and stay the same weight. Thirty percent of males want to maintain weight, and 30 percent hope to lose weight. Over half of females want to lose weight, and 25 percent want to maintain their current weight. Finally, perception of respondents’ health is measured using five descriptive options: 1- Excellent, 2- Very Good, 3- Good, 4- Fair, and 5- Poor. Average male and female response was two-indicating very good health.
These data are analyzed with three different statistical techniques-ANCOVA, GLM, and Hierarchical logistic regressions-each was performed separately for men and women.
3. RESULTS
Data came from the first 15 rounds of the NLSY97-a longitudinal panel that follows a sample of 8,984 American youth from 1997 to 2011. After 2011, the survey became biennial. While 2013 and 2015 are available, the sample focused only on those consecutive survey years.
BMI-the dependent variable-was calculated from self-reported height and weight. To calculate BMI, respondents needed a height and weight value. To maintain a panel balance, respondents without a BMI in each year were removed. Remaining data was cleaned using a series of flags to indicate errant, inconsistent, or illogical height and weight values. If height was missing, it was imputed from nearby observations whenever possible. Since full height is likely achieved early in the sample for most respondents, imputations did not likely bias data. Summing the flags, and removing errant values, left 4,205 respondents.
3.1. Stage I Analysis of Covariance (ANCOVA)
First, analysis of covariance (ANCOVA) examined the relationship between intrinsic factor covariates and BMI. ANCOVA gauged the association between BMI and intrinsic factors while accounting for variation in other respondent traits. Age of first sexual experience, general health, desire to lose weight, desire to stay the same weight, and number of years since first experimenting with cigarettes varied positively as BMI increased (Table 3). Most intrinsic factors had significant p-values for adolescents and adults (except for eating disorder).
| NLSY97: Intrinsic Factor ANCOVA by Gender | ||||||
| Male | ||||||
| Age | 12-32 | 12-20 | 21-32 | |||
| - | Chi-Square | Pr > ChiSq | Chi-Square | Pr > ChiSq | Chi-Square | Pr > ChiSq |
| - | 16239.56 | <.0001 | 193.97 | <.0001 | 15365.81 | <.0001 |
| Effect | F Value | Pr > F | F Value | Pr > F | F Value | Pr > F |
| Age (months) | 659.5 | <.0001 | 25.53 | <.0001 | 533.78 | <.0001 |
| Age Sex | 7.61 | 0.0059 | 6.39 | 0.0118 | 8.36 | 0.0039 |
| General Health Score | 19.31 | <.0001 | 1.53 | 0.2171 | 25 | <.0001 |
| Years Smoking | 16.09 | <.0001 | 15.78 | <.0001 | 12.49 | 0.0004 |
| Eating Disorder | 0.06 | 0.8124 | 0.05 | 0.8241 | 0 | 0.959 |
| Lose Weight | 677.45 | <.0001 | 170.29 | <.0001 | 681.47 | <.0001 |
| Stay the Same Weight | 162.34 | <.0001 | 38.11 | <.0001 | 166.42 | <.0001 |
| Female | ||||||
| Age | 12-32 | 12-20 | 21-32 | |||
| - | Chi-Square | Pr > ChiSq | Chi-Square | Pr > ChiSq | Chi-Square | Pr > ChiSq |
| - | 16513.59 | <.0001 | 592.51 | <.0001 | 15565.5 | <.0001 |
| Effect | F Value | Pr > F | F Value | Pr > F | F Value | Pr > F |
| Age (months) | 686.51 | <.0001 | 30.76 | <.0001 | 579.92 | <.0001 |
| Age Sex | 7.56 | 0.006 | 1.01 | 0.3143 | 6.95 | 0.0085 |
| General Health Score | 42.88 | <.0001 | 8.98 | 0.0028 | 40.97 | <.0001 |
| Years Smoking | 6.82 | 0.0091 | 1.58 | 0.2099 | 4.87 | 0.0274 |
| Eating Disorder | 0.48 | 0.4868 | 0.04 | 0.8408 | 0.64 | 0.4249 |
| Lose Weight | 757.35 | <.0001 | 121.44 | <.0001 | 725.05 | <.0001 |
| Stay the Same Weight | 254.33 | <.0001 | 30.53 | <.0001 | 252.09 | <.0001 |
| Dependent Variable: lnBMIt | ||||||
3.2. Stage II GLM: Adolescent, Adult Comparison
The second stage of analysis employed Generalized Linear Models (GLM) to simultaneously evaluate all extrinsic and intrinsic attributes. GLM was a flexible generalization of ordinary linear regression that allowed for random effects, fixed effects, and error distributions other than normal. In accordance with the American Academy of Pediatrics, separate models were run for adolescents-those age 12 to 20-and adults-those age was 21 to 32 [49-52] (Table 4).
Other researchers have shown that parental influences play a role in weight development among adolescents, but gender differences skew their relative importance [53] found. Separate age regressions (Tables 5 and 6) explore differences in BMI determinants among adolescent and adults. The age effect is large and positive for the younger age groups, but it decreases for adults-suggesting that BMI increases faster in adolescence than adulthood. No extrinsic characteristics significantly impact adolescent BMI. Age of first sexual experience and years since first tobacco use are negatively related to BMI-the longer adolescents refrain from sex or smoking, the lower their BMI. Desire to lose or maintain current weight are positive-indicating that adolescents with higher BMI report a desire to lose or maintain weight.
| NLSY97: BMI Regression for Adolescents by Gender | ||||
|---|---|---|---|---|
| - | Male | Female | ||
| - | Ages 12-20 | Ages 12-20 | ||
| - | Model Fit | |||
| AIC | -444.69 | - | -418.14 | - |
| Gen. Chi2 | 1.83 | - | 1.43 | - |
| N | 9012 | - | 8579 | - |
| Results | ||||
| Variable | Parameter | Std Err | Parameter | Std Err |
| Intercept | 2.84*** | 0.217 | 2.54*** | 0.198 |
| Aget | 0.0024*** | 0.001 | 0.0019*** | 0.001 |
| Black | 0.0064 | 0.020 | 0.11*** | 0.021 |
| Hispanic | 0.02 | 0.022 | 0.024 | 0.023 |
| Household Sizet | -0.003 | 0.004 | -0.0011 | 0.004 |
| Poverty/Income Ratiot | -0.0058 | 0.007 | -0.00158 | 0.005 |
| Urbant | -0.0016 | 0.016 | -0.0089 | 0.017 |
| Northeastt | 0.011 | 0.020 | 0.013 | 0.023 |
| Southt | -0.0026 | 0.017 | 0.019 | 0.018 |
| Age Sext | -0.012*** | 0.004 | -0.0051 | 0.004 |
| General Healtht | -0.0099 | 0.007 | 0.021*** | 0.007 |
| Years Smokingt | -0.024*** | 0.006 | -0.002 | 0.007 |
| Stay Same Weightt | 0.088*** | 0.016 | 0.11** | 0.026 |
| Lose Weightt | 0.208*** | 0.016 | 0.24*** | 0.027 |
| Eating Disordert | -0.034 | 0.049 | 0.026 | 0.030 |
| Mother's Education Less than HSt | -0.015 | 0.020 | 0.036 | 0.023 |
| Mother's Education HSt | -0.033* | 0.017 | 0.025 | 0.018 |
| Dependent Variable: lnBMIt | ||||
| Source: NLSY 1997 | - | - | - | |
| Statistical Significance: * (0.10), ** (0.05), *** (0.01) | ||||
| NLSY97: BMI Regression for Adults by Gender | ||||
|---|---|---|---|---|
| - | Male | Female | ||
| - | Ages 21-32 | Ages 21-32 | ||
| - | Model Fit | |||
| AIC | -19504.7 | - | -15740.1 | - |
| Gen. Chi2 | 29.94 | - | 37.53 | - |
| N | 8760 | - | 8190 | - |
| Results | ||||
| Variable | Parameter | Std Err | Parameter | Std Err |
| Intercept | 2.972*** | 0.028 | 2.789*** | 0.038 |
| Aget | 0.0009*** | 0.000 | 0.00099*** | 0.000 |
| Black | 0.020* | 0.010 | 0.102*** | 0.012 |
| Hispanic | 0.035*** | 0.011 | 0.032** | 0.013 |
| Household Sizet | 0.0016*** | 0.001 | 0.0023*** | 0.001 |
| Poverty/Income Ratiot | -0.00066 | 0.001 | -0.0007 | 0.001 |
| Urbant | 0.00045 | 0.002 | 0.0053* | 0.003 |
| Northeastt | 0.0022 | 0.006 | 0.0047 | 0.007 |
| Southt | 0.012*** | 0.004 | -0.0002 | 0.005 |
| Age Sext | -0.0022 | 0.002 | -0.003 | 0.002 |
| General Healtht | 0.0064*** | 0.001 | 0.0089*** | 0.001 |
| Years Smokingt | -0.0022*** | 0.001 | 0.00025 | 0.001 |
| Stay Same Weightt | 0.034*** | 0.003 | 0.081*** | 0.006 |
| Lose Weightt | 0.085*** | 0.003 | 0.150*** | 0.006 |
| Eating Disordert | 0.011 | 0.009 | 0.0047 | 0.011 |
| Mother's Education Less than HSt | 0.015 | 0.012 | 0.043*** | 0.014 |
| Mother's Education HSt | 0.016* | 0.009 | 0.018* | 0.011 |
| Dependent Variable: lnBMIt | ||||
| Source: NLSY 1997 | - | - | - | |
| Statistical Significance: * (0.10), ** (0.05), *** (0.01) | ||||
These intrinsic characteristics remain significant for adults, but several extrinsic characteristics emerge as significant as well. In addition to race/ethnicity and age, the covariates for household size, southern residence, urban housing, and low maternal education are all positively associated with BMI. The emergence of these extrinsic factors, in addition to intrinsic factors, suggests different processes involved in adolescent and adult BMI determination compared to adolescent BMI. Adult BMI is determined by a large number of internal, external, and environmental factors, while adolescent BMI is only determined by a small number of covariates.
3.3. Stage III Multinomial Logit: Adolescent, Adult Comparison
Finally, the third stage estimates hierarchical logistic regressions for adolescents and adults. These models evaluate the relative importance of intrinsic and extrinsic characteristics on weight category determinations: underweight, normal weight, overweight, and obese. The logit analysis uses weight category as the dependent variable and estimates reflect likelihood relative to normal weight. Results are listed in Table 6.
| Multinomial Logit: Weight Category Estimates by Age and Gender | |||||||
|---|---|---|---|---|---|---|---|
| - | Male | Female | |||||
| - | Ages 12-20 | Ages 12-20 | |||||
| - | Model Fit | ||||||
| Criterion | Intercept Only | Intercept and Covariates | Intercept Only | Intercept and Covariates | |||
| AIC | 6342.626 | 5102.27 | 5765.216 | 4810.782 | |||
| -2 Log L | 6336.63 | 5000.27 | 5759.216 | 4708.782 | |||
| - | Chi-Square | Pr > ChiSq | Chi-Square | Pr > ChiSq | |||
| Likelihood Ratio | 1050.4337 | <.0001 | - | - | |||
| Results | |||||||
| Variable | Estimate | Std Err | Pr > ChiSq | Estimate | Std Err | Pr > ChiSq | |
| Intercept | Under | -3.8352 | 2.9542 | 1.6855 | 0.9407 | 2.02 | 0.2169 |
| Over | -4.6207*** | 0.9344 | 24.4537 | -6.3905*** | 1.0861 | 34.6191 | |
| Obese | -10.3903*** | 1.3802 | 56.6693 | -23.6786 | 241.7 | 0.0096 | |
| Aget | Under | -0.0114 | 0.0108 | 1.1136 | -0.00874 | 0.00758 | 1.3282 |
| Over | 0.0148*** | 0.00326 | 20.5721 | 0.0112*** | 0.00349 | 10.2212 | |
| Obese | 0.0208*** | 0.00447 | 21.5431 | 0.0242*** | 0.00433 | 31.1976 | |
| Black | Under | 0.4746 | 0.3818 | 1.5454 | -1.4563*** | 0.338 | 18.5639 |
| Over | 0.1905 | 0.1307 | 2.1257 | 0.757*** | 0.1448 | 27.3139 | |
| Obese | 0.547** | 0.1814 | 9.0958 | 1.5201*** | 0.1683 | 81.6024 | |
| Hispanic | Under | 0.3611 | 0.5165 | 0.4886 | -1.4062* | 0.4174 | 11.3506 |
| Over | 0.0847 | 0.1391 | 0.3704 | -0.0621 | 0.1496 | 0.1721 | |
| Obese | 0.0334 | 0.1865 | 0.0321 | 0.379** | 0.175 | 4.6901 | |
| Household Sizet | Under | -0.227** | 0.1066 | 4.5317 | -0.0138 | 0.066 | 0.0439 |
| Over | -0.0337 | 0.0301 | 1.2532 | 0.00961 | 0.0326 | 0.0868 | |
| Obese | 0.0616 | 0.04 | 2.3661 | 0.06 | 0.0388 | 2.3921 | |
| Poverty/Income Ratiot | Under | 0.084 | 0.1438 | 0.3411 | -0.0962 | 0.0947 | 1.0305 |
| Over | 0.0287 | 0.0442 | 0.422 | -0.0682 | 0.0463 | 2.1713 | |
| Obese | 0.067 | 0.0622 | 1.1594 | -0.0807 | 0.0568 | 2.0151 | |
| Urbant | Under | -1.1057*** | 0.31 | 12.7182 | 0.3978 | 0.3036 | 1.7163 |
| Over | -0.2033* | 0.1133 | 3.2206 | -0.1793 | 0.1261 | 2.0202 | |
| Obese | -0.3479* | 0.156 | 4.973 | -0.1645 | 0.1572 | 1.0957 | |
| Northeastt | Under | 0.00662 | 0.5521 | 0.0001 | -0.0703 | 0.3231 | 0.0473 |
| Over | 0.1209 | 0.1357 | 0.7942 | 0.1994 | 0.1543 | 1.67 | |
| Obese | -0.3531 | 0.2031 | 3.0226 | -0.0454 | 0.206 | 0.0486 | |
| Southt | Under | 0.7253 | 0.3577 | 4.1117 | 0.1936 | 0.2589 | 0.5588 |
| Over | -0.0977 | 0.1082 | 0.8159 | 0.00591 | 0.1196 | 0.0024 | |
| Obese | 0.1007 | 0.1447 | 0.485 | 0.2083 | 0.143 | 2.1232 | |
| Age Sext | Under | 0.2521*** | 0.0794 | 10.0765 | 0.0678 | 0.0661 | 1.0523 |
| Over | -0.0497*** | 0.0205 | 5.9106 | -0.0332 | 0.0273 | 1.4847 | |
| Obese | -0.0617*** | 0.0284 | 4.7014 | -0.0851** | 0.0319 | 7.1124 | |
| General Healtht | Under | 0.1116 | 0.1669 | 0.447 | 0.1748 | 0.1214 | 2.0737 |
| Over | 0.0673 | 0.055 | 1.4992 | 0.2647*** | 0.0584 | 20.5614 | |
| Obese | 0.2767*** | 0.0732 | 14.2925 | 0.6545*** | 0.0683 | 91.8812 | |
| Years Smokingt | Under | 0.1623 | 0.1073 | 2.288 | -0.1924** | 0.0908 | 4.4894 |
| Over | -0.1278*** | 0.0322 | 15.7156 | -0.0888** | 0.0369 | 5.785 | |
| Obese | -0.2951*** | 0.0461 | 40.9897 | 0.0275 | 0.043 | 0.4083 | |
| Stay Same Weightt | Under | -2.7077*** | 0.6036 | 20.1261 | -2.1557*** | 0.2708 | 63.3712 |
| Over | 1.3328*** | 0.1214 | 120.5813 | 1.4004*** | 0.4812 | 8.4689 | |
| Obese | 3.3359*** | 0.5165 | 41.7145 | 13.0705 | 241.7 | 0.0029 | |
| Lose Weightt | Under | -1.9159*** | 0.7355 | 6.785 | -4.1514*** | 0.3909 | 112.7952 |
| Over | 2.7017*** | 0.1363 | 392.8267 | 3.1936*** | 0.4706 | 46.057 | |
| Obese | 6.047*** | 0.514 | 138.4273 | 16.0169 | 241.7 | 0.0044 | |
| Eating Disordert | Under | 0.5649 | 0.6712 | 0.7084 | 0.6163* | 0.3611 | 2.9131 |
| Over | -0.3835 | 0.2963 | 1.6754 | -0.6031** | 0.2518 | 5.737 | |
| Obese | -0.3346 | 0.4197 | 0.6354 | 0.1904 | 0.2381 | 0.6393 | |
| Mother's Education Less than HSt | Under | 0.2867 | 0.4071 | 0.4959 | 0.2031 | 0.3554 | 0.3266 |
| Over | 0.1784 | 0.1365 | 1.7078 | 0.32** | 0.161 | 3.9476 | |
| Obese | 0.5073*** | 0.1857 | 7.4638 | 0.6169* | 0.1831 | 11.3557 | |
| Mother's Education HSt | Under | -0.2784* | 0.3646 | 0.583 | 0.1659 | 0.2624 | 0.4001 |
| Over | 0.0418 | 0.1077 | 0.1507 | 0.3781*** | 0.1163 | 10.5709 | |
| Obese | 0.3534* | 0.1484 | 5.6705 | 0.2704** | 0.1445 | 3.5047 | |
| - | Ages 21-32 | Ages 2132 | |||||
| - | Model Fit | ||||||
| Criterion | Intercept Only | Intercept and Covariates | Intercept Only | Intercept and Covariates | |||
| AIC | 13930.1 | 10868.6 | 13090.505 | 10643.3 | |||
| -2 Log L | 13924.1 | 10766.6 | 13084.505 | 10541.3 | |||
| - | Chi-Square | Pr > ChiSq | Chi-Square | Pr > ChiSq | |||
| Likelihood Ratio | 3157.5016 | <.0001 | 2543.1765 | <.0001 | |||
| Results | |||||||
| Variable | Estimate | Std Err | Pr > ChiSq | Chi-Square | - | Pr > ChiSq | |
| Intercept | Under | -4.7046* | 2.4852 | 3.5836 | -2.1641 | 1.7735 | 1.4889 |
| Over | -3.6836*** | 0.5554 | 43.9922 | -7.0743*** | 0.6726 | 110.6288 | |
| Obese | -8.8757*** | 0.7326 | 146.7752 | -9.1216*** | 0.861 | 112.2483 | |
| Aget | Under | 0.00031 | 0.00683 | 0.0021 | 0.000947 | 0.00464 | 0.0417 |
| Over | 0.00569*** | 0.00148 | 14.8516 | 0.00609*** | 0.00149 | 16.7313 | |
| Obese | 0.0119*** | 0.00178 | 44.5584 | 0.0063*** | 0.00162 | 15.1989 | |
| Black | Under | -0.5226 | 0.422 | 1.5338 | -1.2774*** | 0.3186 | 16.0758 |
| Over | 0.4099*** | 0.0983 | 17.3809 | 1.001*** | 0.1063 | 88.6017 | |
| Obese | 0.6889*** | 0.1211 | 32.3716 | 1.4663*** | 0.1114 | 173.2655 | |
| Hispanic | Under | -0.5491 | 0.5182 | 1.1226 | -0.3487 | 0.3581 | 0.9479 |
| Over | 0.4018*** | 0.1004 | 16.0021 | 0.1093 | 0.1001 | 1.1933 | |
| Obese | 0.2496** | 0.1223 | 4.1634 | 0.0453 | 0.1084 | 0.1747 | |
| Household Sizet | Under | 0.0316 | 0.1083 | 0.0854 | 0.0479 | 0.0708 | 0.4587 |
| Over | 0.042* | 0.0242 | 3.0137 | 0.0727** | 0.0251 | 8.3979 | |
| Obese | 0.0917*** | 0.0285 | 10.3734 | 0.1389*** | 0.0262 | 28.1078 | |
| Poverty/Income Ratiot | Under | -0.0738 | 0.158 | 0.2182 | 0.1178 | 0.1064 | 1.2247 |
| Over | 0.1058*** | 0.0367 | 8.3129 | -0.101*** | 0.0388 | 6.7868 | |
| Obese | 0.056 | 0.0454 | 1.5211 | -0.1586*** | 0.0419 | 14.3262 | |
| Urbant | Under | -0.0983 | 0.3466 | 0.0804 | 0.1953 | 0.2822 | 0.4791 |
| Over | -0.0829 | 0.0845 | 0.9621 | 0.092 | 0.0878 | 1.0989 | |
| Obese | -0.258* | 0.1045 | 6.099 | 0.023 | 0.0951 | 0.0585 | |
| Northeastt | Under | -12.3565 | 154.8 | 0.0064 | -0.2392 | 0.3242 | 0.5443 |
| Over | -0.0794 | 0.1053 | 0.568 | 0.00136 | 0.1043 | 0.0002 | |
| Obese | 0.0701 | 0.1273 | 0.3034 | -0.1765 | 0.1177 | 2.2479 | |
| Southt | Under | -0.1582 | 0.3331 | 0.2257 | 0.0621 | 0.2529 | 0.0603 |
| Over | -0.2435** | 0.079 | 9.5065 | 0.0958 | 0.0816 | 1.3786 | |
| Obese | -0.2477** | 0.0968 | 6.5407 | 0.1637* | 0.0881 | 3.4513 | |
| Age Sext | Under | 0.1281* | 0.0663 | 3.7357 | 0.0609 | 0.0544 | 1.2514 |
| Over | -0.0347*** | 0.0136 | 6.481 | 0.0273 | 0.0167 | 2.6697 | |
| Obese | -0.0585*** | 0.0165 | 12.5977 | -0.0272 | 0.0176 | 2.3817 | |
| General Healtht | Under | 0.3624* | 0.1721 | 4.4342 | 0.0178 | 0.1157 | 0.0237 |
| Over | 0.1187*** | 0.0413 | 8.248 | 0.2682*** | 0.0421 | 40.5659 | |
| Obese | 0.5829*** | 0.0498 | 136.8514 | 0.715*** | 0.045 | 252.0977 | |
| Years Smokingt | Under | -0.1237* | 0.0574 | 4.6461 | -0.0667 | 0.0412 | 2.6252 |
| Over | -0.041*** | 0.0115 | 12.6499 | 0.0213* | 0.0127 | 2.8208 | |
| Obese | -0.0954*** | 0.0141 | 45.5112 | 0.033*** | 0.0137 | 5.7993 | |
| Stay Same Weightt | Under | -2.8231*** | 0.6061 | 21.694 | -3.3665*** | 0.2943 | 130.8794 |
| Over | 1.5282*** | 0.0952 | 257.4656 | 1.925*** | 0.3583 | 28.8596 | |
| Obese | 3.0937*** | 0.2918 | 112.3833 | 2.6788*** | 0.6054 | 19.5819 | |
| Lose Weightt | Under | -2.7625*** | 1.0201 | 7.3328 | -4.9968*** | 0.4073 | 150.5402 |
| Over | 3.0787*** | 0.1097 | 787.6142 | 3.8651*** | 0.3538 | 119.3175 | |
| Obese | 6.087*** | 0.2932 | 430.9459 | 5.7169*** | 0.5966 | 91.8367 | |
| Eating Disordert | Under | -1.1278 | 1.0384 | 1.1796 | 1.0863*** | 0.3419 | 10.0953 |
| Over | -0.032 | 0.1637 | 0.0382 | -0.255* | 0.154 | 2.7406 | |
| Obese | -0.4061* | 0.2084 | 3.7967 | -0.2312 | 0.1627 | 2.0192 | |
| Mother's Education Less than HSt | Under | 0.7915** | 0.4057 | 3.8061 | -0.7077* | 0.3631 | 3.7977 |
| Over | 0.5222*** | 0.1067 | 23.9636 | 0.2091* | 0.1123 | 3.4669 | |
| Obese | 0.5441*** | 0.1313 | 17.1747 | 0.5909*** | 0.1151 | 26.337 | |
| Mother's Education HSt | Under | -0.3318 | 0.395 | 0.7056 | -0.1701 | 0.2577 | 0.4358 |
| Over | 0.1274 | 0.0783 | 2.645 | 0.3247*** | 0.081 | 16.0598 | |
| Obese | 0.3706*** | 0.0954 | 15.1043 | 0.1873** | 0.0897 | 4.3664 | |
| Dependent Variable: Weight Category (underweight, normal weight, overweight, obese) | |||||||
| Reference group: Normal Weight | |||||||
| Source: NLSY 1997 | |||||||
| Statistical Significance: * (0.10), ** (0.05), *** (0.01) | |||||||
Since the normal weight category was chosen as the reference category, the models reflect categories of underweight relative to normal weight, overweight relative to normal weight, and obese relative to normal weight. Therefore, each estimate must be considered in terms of both the parameter it corresponds to and the model to which it belongs. The standard interpretation of the multinomial logit is that, for a unit change in the predictor variable, the logit of outcome relative to the referent group is expected to change by its respective parameter estimate-given the other variables in the model are held constant. If age increases by one month, the probably that a male age 12-20 is underweight decreases by -0.0114 ceteris parabis relative to normal weight.
4. DISCUSSION
It is important to consider the nature of the data when reviewing the results. BMI is based on self-reported height and weight data. Self-reported height and weight data are consistently over- and under-estimated, respectively. With this in mind, the interpretation of multinomial estimates is not entirely intuitive, but the significance pattern of the multinomial logit resembles that of the GLM specification. Age and race/ethnicity are highly correlated with adolescent weight category-with lower probabilities that minority races appear in lower weight status categories. Intrinsic characteristics such as general health perception, years since first tobacco use, age at first sexual encounter, and desire to maintain or lose weight are highly correlated with weight categories. Interestingly, desire to maintain or lose weight are associated with lower probabilities of being underweight and higher probabilities of being overweight and obese. This indicates that respondents were aware of their weight and desired to attain a healthier body size. Finally, obese respondents had lower probabilities of favorable general health score (as would be expected).
While the intrinsic factors remain significant among adults, extrinsic characteristics, including household size, region of residence, income to poverty ratio, and maternal education, appear significant. Overweight and obese respondents are more likely to have large households and lower income ratio than those of normal weight. Higher probabilities of low level(s) of maternal education exist for overweight/obese adults. While having had an eating disorder was insignificant in earlier GLM models, logit estimates for both adolescent and adult females reflect significantly higher probabilities of underweight respondents with eating disorders and significantly lower probabilities of overweight respondents with eating disorder histories. These results appear substantial and significant for both age categories.
CONCLUSION
Using 15 years of data from NLSY97, longitudinal analysis assesses the impact of extrinsic-environmental, biological, geographic, and household-and intrinsic-sexual activity, substance use, desire to lose weight, etc.-characteristics on BMI. GLMs including fixed and random effects assess the relationship between these factors and BMI separately for both adolescents and adults. Results suggest that race and age are the largest BMI correlates at all ages. Multinomial logit models show that intrinsic factors are highly correlated with adolescent weight category. Overweight and obese respondents are more likely to express desire to lose weight than normal weight adolescents are, but underweight females are more likely to have suffered from an eating disorder than their normal weight counterparts. These intrinsic attributes, along with several household and geographic characteristics, determine adult weight categories.
Intrinsic factors are the most deterministic for adolescent BMI. Age of first sexual encounter, tobacco experimentation, perspective on general health, and weight-related desires to lose or stay the same weight are highly correlated with adolescent BMI and weight classification. As respondents become adults, intrinsic factors remain important, but several extrinsic characteristics also appear significant.
Results indicate that BMI correlates differ for adolescents and adults-suggesting that the BMI development process changes with age. While BMI is only influenced by a small number of factors for youth/adolescents, adult BMI is more complex, and it is influenced by a variety of household, environmental, demographic, and personal characteristics. These results imply that adolescents and adults would require different treatments for being overweight-therefore explaining why conventional policy interventions aimed at high BMI groups have been unsuccessful. More effective programs targeting adolescents should focus on internal, less tangible, characteristics.
FUNDING DISCLOSURE
The author reports no monetary interests in the publication of this manuscript. No external funding was used in the research contained herein.
ETHICS APPROVAL AND CONSENT TO PARTICIPATE
Not applicable.
HUMAN AND ANIMAL RIGHTS
No animals/humans were used for the studies that are bases of this research.
CONSENT FOR PUBLICATION
Not applicable.
CONFLICT OF INTEREST
The author certifies that he/she has NO affiliations with or involvement in any organization or entity with any financial interest (such as honoraria; educational grants; participation in speakers’ bureaus; membership, employment, consultancies, stock ownership, or other equity interest; and expert testimony or patent-licensing arrangements), or non-financial interest (such as personal or professional relationships, affiliations, knowledge or beliefs) in the subject matter or materials discussed in this manuscript.
ACKNOWLEDGEMENTS
Declared none.

