All published articles of this journal are available on ScienceDirect.

Comparative Analysis of the Survival Status and Treatment Outcome of Under-five Children Admitted with Severe Acute Malnutrition Among Hospital-based and Health Center Based Stabilization Centers, South Ethiopia
Abstract
Background:
Severe acute malnutrition has been managed at Hospital stabilization centers until the management at health center based stabilization centers was started recently. However, the treatment outcome was not assessed in relation to the existing hospital-based management. Therefore, this study comparatively assessed the treatment outcome and survival status of severe acute malnutrition among Health center-based and hospital-based stabilization centers. The finding will be used by healthcare providers, planners and policymakers at large.
Methods:
Randomly selected 400 records of under-five children admitted to five stabilization centers (2 hospitals and 3 health center) in Gedeo Zone was included. Data was entered by Epi Info version 7 and analyzed by STATA version 11. Survival difference was checked by life table and Kaplan-Mier with Log-Rank test. Cox proportional hazards model was built by forward stepwise procedure; compared to likely hood ratio test and Harrell’s concordance and fitness checked by the cox-snell residual plot.
Result:
The study showed that the cumulative probability of Survival is significantly different at Hospital stabilization center and health center stabilization centers (p.value <0.001) with shorter survival at hospitals. During the follow-up period, 28(13.86%) children from hospital and 5(2.5%) children from health center died, while 155(76.73%) children from the hospital and 145(73.23%) children from health center got cured. Eighteen (4.5%)children were defaulted. Death is significantly higher at the hospital, while default rate and cure rate are not significantly different. Altered pulse rate [AHR=2.44, 95% CI =1.47-4, p<0.001], NG tube insertion [AHR=1.8, 95% CI =1.04-3.1, p=0.038], Anemia [AHR=1.53, 95% CI =1.02-2.3, p<0.041] and Hypoglycemia [AHR=2.78, 95% CI =1.8-4.3, p<0.001] were found to be independent predictors of death.
Conclusion:
The survival of children in hospital is shorter and mortality is higher. An overall treatment outcome was in acceptable ranges. Intervention to further reduce deaths at hospitals has to focus on children with comorbidities and altered general conditions and early detection.
1. BACKGROUND
Childhood undernutrition is still a major global health problem, contributing to morbidity, mortality and increased risk of disability [1, 2]. Globally about 25 to 35 million under-five children have Severe Acute Malnutrition (SAM) [3] and 19 million preschool-age children are suffering from severe wasting (4). The African and South-East Asia Region account the highest proportion [3, 4]. A vast majority of children suffering from acute malnutrition (13 million) are found in Sub Saharan Africa; which means 9.4% of all under-five children in the region have acute malnutrition [3]. As evidenced by previous studies, severe acute malnutrition is still a serious problem also in Ethiopia [5-8].
Malnutrition contributes to 50 - 60% of deaths in children globally [4, 5, 9, 10] and severe wasting alone attributed 4.4% of the 7.6 million deaths occurring annually among under 5 children [4, 9]. The risk of death is also nine times higher among Severely Acute Malnourished (SAM) than well-nourished children; severe wasting alone is estimated to account for around 400,000 child deaths each year [2-4]. In Ethiopia, malnutrition contributes to an estimated 270,000 deaths of under-five children each year (6), accounts for 11% of the deaths of under-five children [11] and it constitutes 20% of primary diagnosis in pediatric hospital admissions [12].
Mortality of children during treatment in hospital and health center based stabilization centers is also a major problem in Ethiopia [5-8]. Even though there is an improvement from previous records, the case-fatality rates at some stabilization center are still unacceptably high [5, 7, 8]. In many health facilities, the mortality rate from SAM at present is over the standards cut off point [7]. In different studies, the mortality on therapeutic management ranges from 3.6% in a study conducted in SNNPR to 28.67% in Sekota hospital [7, 13]. Death commonly occurs within the first 48 hours after admission, related to faulty treatment and late admission [8, 13, 14].
Despite the existence of inpatient and outpatient nutrition programs with a common protocol, such higher mortality rate in inpatient units at different health institutions has been attributed to either co-morbidities, poor adherence to the WHO therapeutic guidelines, severity of disease during admission or development of severe complication after admission and delayed diagnosis and treatment initiation [7, 8, 13, 14]. Currently, many children are diagnosed at a later stage of their illness after they developed complication which needs hospital admission and the outcome is commonly poor [7, 14].
To reduce the load of a patient admitted to hospitals and increase access to SAM care, WHO designed a program to manage SAM cases at health center levels since 2000. The program was adopted in different developing countries including Ethiopia. After successful pilot trials in 2000-2002 by Non-governmental organizations, Ethiopia implemented the program since 2003. With this program, service is expanded from hospital-based cares to the Community-Based Therapeutic Care (CTC) approach aimed to ensure access and coverage; which includes Community outreach, Outpatient Treatment Program (OTP), Targeted Supplementary Feeding program (TSF) and Inpatient Treatment [5].
However, since its implementation in Ethiopia, the treatment outcome of health center-based care was not assessed in relation to the existing hospital-based management. Therefore, this study comparatively assessed the treatment outcome in terms of survival time, cure rate, mortality rate, and default rate, length of stay, weight gain and identified possible predictors of mortality. The finding will have a higher contribution to health care providers, planners and policymakers at large.
2. METHODS
2.1. Study Design and Settings
This comparative retrospective cohort study was conducted in two hospital-based and three health center based stabilization center of Gedeo Zone, Southern Ethiopia. The zone has a total population of 1,105,813 divided into 6 districts and 2 urban city administrations. There are 40 health center 1 referral hospital, 2 district hospital and 4 private clinics. The district health centers and hospitals have stabilization centers that offer inpatient services to severely malnourished children with complication and/or failed appetite test in facility setups based on the national SAM management protocol. Trained Nurses, Health officers and General Practitioners (GP) are responsible staffs in the districts and the referral hospital has specialists in addition to the previous staff organization. The management protocol is the same in both areas.
2.2. Study Population and Sampling Procedure
The Source population was children, aged less than five years with SAM admitted to Stabilization Centers (SC) in Gedeo Zone from 2013- 2015. Sample size was calculated based on, sample size estimation for the assessment of survival time under the Cox proportional hazards model by using the STATA Version 11.0 Statistical package considering the following assumptions: a 2.6 hazard ratio, the probability of failure (death) observed is 0.093, with 5% marginal error and 95% confidence interval of certainty (α = 0.05) [14]. The number of subjects needed to achieve a power of 80% and assuming 8% incompleteness and became 400.
The referral hospital was selected directly while one district hospital out of the two and three health center based stabilization centers out of the six health centers was selected with simple random sampling methods. The sample was allocated proportionally for the five randomly selected SC and Computer generated simple random sampling technique was used to select individual records from the SC.
2.3. Data Collection and Quality Control
Data was collected from patient follow up charts and records by using a structured checklist that developed from the standard treatment protocol for the management of SAM. The checklist sought information on socio-economic variables, clinical condition, treatment and progress at different period of time. The checklist is originally filled during admission, follow-up period and during discharge time which accounts clinical condition during admission, the treatment provided, the progress observed and final outcomes. The data was collected by five nurses after getting training. For this research, complete records were selected, fortunately, the incomplete records were rare which couldn’t affect the internal or external validity of the data.
2.4. Study Variables
The outcome variable was dichotomized with death and censored coded as zero (death) and otherwise one. While, the Time variable was Time to the occurrence of death measured from admission to date of the event and; and the independent variables were socio-demographic, anthropometric and clinical presentations. All variables were defined according to the national SAM management protocol.
2.5. Definition of Variables
2.5.1. Phase I
is an acute phase treatment in SAM management. Patients with an inadequate appetite and/or an acute major medical complication are initially admitted to an in-patient facility for acute-phase treatment. The formula used during this phase (F75) promotes repair of physiological and metabolic functions and electrolyte balance.
2.5.2. Phase II
is a continuation phase in which a child who recovers in phase I management is supposed to gain appropriate weigh and fully recover from SAM. The continuum of management in this phase is F100 and other cares.
2.5.3. Treatment Failure
is the inability to achieve the expected change in certain time period. It is declared on day 4 and 10 based on the following criteria and recorded as either primary if it is on day 4 or secondary failure if it is on day 10. The criteria are Failure to regain appetite on Day 4; Failure to start to lose oedema on day 4; Oedema still present on Day 10; Failure to enter to Phase 2 and Gain more than 5 mg/ kg/ day on Day 10
2.6. Data Analysis
Data was entered into Epi-info version 7 and exported to STATA version 11 after cleaning process, and then exploratory data analysis was carried out to check the assumptions. A life table was constructed to estimate probabilities of becoming death at different time intervals. Kaplan Meier survival curve together with log-rank test was fitted to test for the presence of a difference in the occurrence of death among Hospital and Health Center based Stabilization Center (HCSC). Using variables which have P <0.25 level in the bivariate analysis the final Cox- regression was analyzed, to identify independent predictors of mortality in the overall data. The final Model was built by the forward stepwise procedure and compared by likely hood ratio and Harrell’s concordance statistics test. Association was summarized by using adjusted hazard ratio and statistical significances tested at 95% CI.
2.7. Ethics Approval and Consent
The source of the data was secondary records; therefore there is no direct contact with the clients. However, the study was ethically approved from Arba Minch University, College of Medicine and Health Sciences and support letter and permission was obtained from the Zonal health department and health departments of the respective districts were also requested for permission.
3. RESULTS AND DISCUSSION
3.1. Socio-Demographic and Anthropometry Characteristics
A total of 400 randomly selected SAM records (202 from Hospital based stabilization center and 198 from health center based stabilization center) were extracted with a structured checklist. Half (50%) of the children enrolled in the study were males and 235(58.75%) were under the age of two years. Younger and male children are significantly higher at hospital SC (p.value <0.001). A quarter of children 95(23.75%) have WFH below 70% with no difference between HSC and HCSC (P.value=0.810). However, children are different in terms of MUAC and type of SAM; HSC has higher 108(53.46%) proportion of MUAC < 11.5 than HCSC 86(43.43%) with an overall prevalence of 194(48.5%). On the other hand, hospital admissions were less likely to be edematous than HCSC. Seventeen children (4.25%) who are below the age of six months were managed as phase II with F100 at initial phase (Table 1).
| Admission Characteristics | Hospital SC
N (%) |
H/Center SC N (%) |
Total N (%) |
p.value |
|---|---|---|---|---|
| Sex | – | – | – | – |
| Male | 117(57.9) | 83(42) | 200(50) | 0.001* |
| Female | 85(40.10) | 115(58) | 200(50) | |
| Age | – | – | – | – |
| < 24 month | 133(65.84) | 102(50.5) | 235(58.75) | 0.004* |
| > 24 month | 69(34.16) | 96(49.5) | 165(41.25) | – |
| WT/HT | – | – | – | – |
| < 70% | 49(24.25) | 46(23.23) | 95(23.75) | 0.810 |
| >70% | 153(75.75) | 152(76.77) | 305(76.25) | – |
| MUAC | – | – | – | – |
| < 11.5 | 108(53.46) | 86(43.43) | 194(48.50) | 0.045* |
| >11.5 | 94(46.54) | 112(56.57) | 206(51.50) | – |
| Type of SAM | – | – | – | – |
| Oedematous | 123(60.90) | 145(73.23) | 268(67) | 0.009* |
| Non-edemat | 79(30.10) | 53(26.77) | 132(33) | – |
| Initial Phase | – | – | – | – |
| Phase I | 192(95) | 191(96.46) | 383(95.75) | 0.483 |
| Phase II | 10(5) | 7(3.54) | 17(4.25) | – |
3.2. Clinical Condition and Morbidity Patterns at Admission
During admission diarrhea, vomiting, cough, dehydration, altered Respiratory rate, altered Pulse rate, pale conjunctiva, palmar pallor, Altered Level of consciousness and Shock were significantly more prevalent at hospital SC (p.value <0.001). Similarly, hospital children were more likely to fail treatment on day 4 and 10. More than half (51.75% (71.8% Vs 32.3%)) and one third (29.75%) of children had diarrhea and vomiting, respectively. The rate of Dehydration was 49(12.25%) in the total sampled children with hospital SC predominance; of which 43% were severely dehydrated. A significant proportion of children had deranged vital signs during admission. Altered respiration (fast breathing or respiratory failure), altered pulse rate (Brady or tachycardia) and altered body temperature (hypothermia or hyperpyrexia) were prevalent in 102(25.5%: 32.67% at HSC Vs. 18.2% at HCSC), 63(15.75%: 28.2% at HSC Vs. 3% at HCSC) and 68(17%) children, respectively. While 51(25.25%) children at HSC and 12(6.1%) at HCSC have altered the level of consciousness (lethargic or comatose), 31(7.75%) has Shock (12.87% Vs. 2.5%) and 50(12.5%) children have treatment failure (Table 2).
| Admission Characteristics |
Hospital SC N (%) |
H/Center SC N (%) |
Total N (%) |
P. Value |
|---|---|---|---|---|
| Diarrhea | ||||
| Yes | 145(71.80) | 62(32.30) | 207(51.75) | <0.001 |
| Vomiting | ||||
| Yes | 99(49) | 20(10.10) | 119(29.75) | <0.001 |
| Dehydration | ||||
| Yes | 41(20.30) | 8(4) | 49(12.25) | <0.001 |
| Cough | ||||
| Yes | 114(56.44) | 54 (27.30) | 168(42) | <0.001 |
| Respiratory rate | ||||
| Altered | 66(32.67) | 36(18.20) | 102(25.50) | 0.001 |
| Normal | 136(67.33) | 162(81.80) | 298(74.50) | |
| Pulse rate | ||||
| Altered | 57(28.20) | 6(3) | 63(15.75) | <0.001 |
| Normal | 145(61.80) | 192(97) | 337(84.25) | |
| Pale conjunctiva | ||||
| Yes | 48(23.76) | 12(6) | 60(15) | <0.001 |
| palmar pallor | ||||
| Yes | 42(20.80) | 15(7.60) | 57(14.25) | <0.001 |
| Body Temperature | ||||
| Altered | 39(19.30) | 29(14.64) | 68(17) | 0.215 |
| Normal | 163(80.70) | 169(85.36) | 332(83) | |
| Level of consciousness | ||||
| Normal | 151(74.75) | 186(93.90) | 337(84.25) | <0.001 |
| Altered | 51(25.25) | 12(6.10) | 63(15.75) | |
| Dermatosis | ||||
| Absent | 181(89.60) | 182(92) | 363(90.75) | 0.424 |
| Present | 21(10.40) | 16(8) | 37(9.25) | |
| Shock | ||||
| Yes | 26(12.87) | 5(2.50) | 31(7.75) | <0.001 |
| Failure (treatment) | ||||
| Yes | 34(16.83) | 16(8) | 50(12.50) | 0.008 |
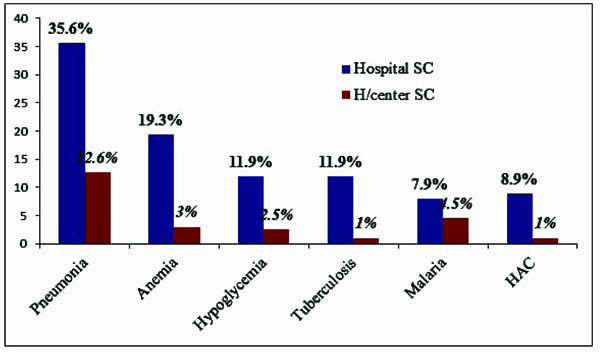
Overall 260(65%) children had co-morbidities/complication with severe acute malnutrition at admission, predominantly in Hospital admissions (p.value <0.001); pneumonia being the most prevalent both at Hospital (35.6%) and HCSC (12.6%) with an overall prevalence of 97(24.25%). Except for malaria (p.value=0.163), all complication were significantly higher at hospital admission. Hypoglycemia, malaria, disseminated TB and Anemia were prevalent in 31(7.75%: 11.9% Vs. 2.5%), 25 (6.25%: 7.9% Vs. 4.5%), 28(7%: 11.9% Vs. 1%) and 45(11.25%: 19.3 Vs. 3%)children at HSC and HCSC, respectively (Fig. 1).
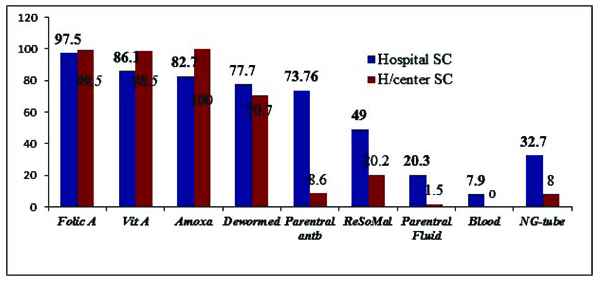
3.3. Routine and Special Medication Provision
Folic acid was administered for 394(98.5%) children and Vitamin A for 369(92.25%) children and they were significantly highly provided at HCSC (p.value <0.001). While the provision of parenteral medication, ReSoMal, IV fluid, blood transfusion and NG tube insertion were significantly higher at HSC (Fig. 2)
3.4. Survival Status and Treatment Outcome
The overall cumulative probability of survival at the end of first, second and third weeks was 97% (93.4% at HSC and 99% at HCSC), 92%(87.3% at HSC and 96.6% at HCSC) and 86% (82.9% at HSC and 86.1% at HCSC), respectively with the overall mean survival time of 77.5 (95%CI=81-94) day. The mean survival time was also significantly different for HSC and HCSC (Log Rank =7.54, p.value=0.006) (Fig. 3).

We observed that 155(76.73%) children from HSC and 145(73.23%) children from HCSC got cured and discharged with an overall cure rate of 300(75%), another 7(1.75%) were improved and have nutritional transfer during the follow-up periods. There is no significant difference at HSC and HCSC in terms of recovery (P.value =0.48). While 33(8.25%) died during treatment, 13.86% death recorded at HSC was significantly higher than HCSC mortality of 2.5% (p.value <0.001). Eighteen (4.5%)children were defaulted and 36(9%) required a medical transfer. The SC were not significantly different in terms of default rate but health center SC has a significantly higher rate of Medical transfers (p.value <0.001). The average length of stay in the hospital was 17 (95% CI=15.5-18.6) day and for health center 10.5 (95%CI=9.6-11.4) with an average stay of 13.8 (SD=9.66) days. The average weight gain was 8.8 g/kg/day (11.4 g/kg/day for children with nonoedematous and 7.33 g/kg/day for children with oedematous malnutrition), there is no significant difference at SC in terms of weight gain (Table 3).
| Indicators/ Treatment Outcome |
Hospital SC N (%) |
H/Center SC N (%) |
Total N (%) |
CHR | P.Value |
|---|---|---|---|---|---|
| Cure rate | 155(76.73) | 145(73.23) | 300(75) | 1.2(0.7-1.9) | 0.48 |
| Death rate | 28(13.86) | 5(2.50) | 33(8.25) | 6.2(2.34-16.4) | <0.001 |
| Defaulter rate | 10(4.95) | 8(4) | 18(4.5) | 1.23(0.47-3.3) | 0.66 |
| Nutrition Referral | 7(3.46) | -# | 7(1.75) | – | – |
| Medical transfer | 2(0.90) | 34(17.17) | 36(9) | 0.048(0.011-0.2) | <0.001 |
| Rate of weight gain | 8.6 g/kg/day | 8.9 g/kg/day | 8.8 g/kg/d | – | 0.13 |
| Average length of stay | 17 | 10.5 | 13.8 | – | <0.001 |
3.5. Predictors of Mortality within Cox-Regression Model
In binary Cox regression, predictors of mortality were the type of SAM, dehydration, altered respiration, altered pulse rate, shock, parenteral antibiotic intake, NG tube, anemia, hypoglycemia and type of health facility/SC. By using variables which have p.value of < 0.25 in the bivariate analysis, Multiple Cox regression with forward stepwise method was fitted and Altered pulse rate (Brady/tachycardia), NG tube insertion, anemia and hypoglycemia were found to be independent predictors of death in severely malnourished children admitted to SC in the study area. However, the presence of dehydration, type of malnutrition, respiratory rate and level of consciousness were not associated with death (Table 4).
| Predictors | Death | Cured | CHR (95%CI) | AHR (95%CI) | P.Value |
|---|---|---|---|---|---|
| Type of SAM | |||||
| Oedematous | 27 | 241 | 2.23(1.12-4.42) | ||
| Non-edematous | 6 | 126 | 1 | - | |
| Dehydration | |||||
| Yes | 11 | 38 | 4.3(2.0-8.7) | - | |
| No | 22 | 329 | 1 | ||
| Respiration | |||||
| Altered | 14 | 88 | 2.36(1.64-3.4) | - | |
| Normal | 19 | 329 | 1 | ||
| Pulse rate | |||||
| Altered | 13 | 50 | 4.8(3-7.5) | 2.44(1.47-4.0) | <0.001 |
| Normal | 20 | 317 | 1 | 1 | |
| Parenteral Atb | |||||
| Yes | 23 | 150 | 3.22(1.78-5.8) | - | |
| No | 10 | 217 | 1 | ||
| Shock | |||||
| Present | 10 | 21 | 5.3(3.6-7.6) | - | |
| Absent | 23 | 246 | 1 | ||
| NG-tube | |||||
| Inserted | 16 | 65 | 4.3(2.67-6.9) | 1.8(1.04-3.1) | 0.038 |
| Not inserted | 17 | 302 | 1 | 1 | |
| Anemia | |||||
| Present | 9 | 36 | 3.78(2.63-5.45) | 1.53(1.02-2.3) | 0.04 |
| Absent | 24 | 331 | 1 | 1 | |
| Hypoglycemia | |||||
| Present | 8 | 21 | 5.5(3.8-8.0) | 2.78(1.8-4.3) | <0.001 |
| Absent | 25 | 346 | 1 | 1 | |
| Health facility | |||||
| Hospital SC | 174 | 202 | 5.4(2.2-8.6) | - | |
| H/center SC | 193 | 198 | 1 |
4. DISCUSSION
The study showed that the cumulative probability of survival at a different time is significantly different at HSC and HCSC with shorter survival at HSC. During the follow-up period, 28(13.86%) children from HSC and 5(2.5%) children from HCSC died. While 155(76.73%) children from HSC and 145(73.23%) children from HCSC got cured, eighteen (4.5%) children being defaulted. Death is significantly higher at the hospital, while default rate and cure rate are not significantly different. Altered pulse rate (Brady/tachycardia), NG tube insertion, anemia and hypoglycemia were found to be independent predictors of death.
Children admitted at HSC and HCSC are significantly different in that, HSC are younger than MUAC <11.5 and non-edematous than HCSC. Children are also more likely to be with complication and altered vital status in HSC than HCSC during admission. This finding was reported in previous studies [7, 14]. The fact that hospital stabilization centers are referral ties for health center SC, more complicated cases are expected to be higher at HSC.
However, unlike other studies, the prevalence of malaria is not significantly different (p.value=0.163) at HCSC and HSC which could be due to the similarity of health facilities in terms of geography and malaria prevalence. As more complicated cases are admitted in HSC, children needed parenteral fluid and medication than HCSC. While the routine medications; Folic acid, Vitamin A and Amoxicillin were significantly highly provided at HCSC.
The cumulative probability of Survival at the end of 1st, 2nd and 3rd week was 97%, 92% and 86%, respectively with the overall mean survival time of 77.5 (95% CI=81-94) day. The mean survival time was also significantly different for HSC and HCSC (Log Rank =7.54, p.value=0.006). The survival of children at HSC is significantly lower than HCSC, which could be due to baseline difference. Similar studies had reported shorter survival at hospital SC [6-8, 14].
This study revealed that 13.86% of children admitted at HSC died during the period of follow up which is higher than the minimum SPHERE standard of 10% mortality [15] and the finding of Jarso et al [14] and Girum et al. [8]. On the other hand, death at HCSC is significantly lower than HSC (p.value <0.001) and other similar studies [7, 14]. Such discrepancy may be due to health status difference during admission, in which hospital admissions have severe complications. However, the finding is not consistent with some other studies [7, 16]; in which, 28.67% and 40.5% of children died. The earlier findings are particularly due to the enrolment of only severe and complicated cases, while the latter is due to high prevalence of HIV. In addition, such discrepancy may result from differences in management and severity.
There is no significant difference in terms of recovery/cure rate and default rate. However, HCSC did not attained the international (SPHERE) standard of cure rate >75%. This could be due to a significant proportion of medical referral, which reduced the proportion of cure. This finding is similar to most national studies in which recovery rate of >75% and default rate of <10% was reported [14, 17]. These similarities could be due to the implementation of identical admission criteria, management protocol, management setting and health care providers.
On the other hand, the average length of stay in the stabilization centers was significantly higher at HSC, however, in both cases, the average length of stay in admission is much lower than the international (SPHERE) standard set for management of severe acute malnutrition which is less than 30 days [15]. In the same way, the average length of stay was lower than the finding of other national studies [7, 14]. But a hospital stay is similar to other hospital-based studies [17]. Generally, the length of stay in HSC is higher due to the underlying medical conditions of children; chronic comorbid conditions like TB that spend a long time in the hospital.
The average weight gain of 8.8 g/kg/day was also in agreement with the minimum international standard set for management of SAM which is an average weight gain of 8 g/kg/day [15] and no difference was observed between health facilities. However, it is lower than a study conducted in similar settings [14] and a study conducted at a community-based treatment setup [16-18] which could be due to the difference in prevalence of grade 3 edema and length of stay.
Adjusting for the effect of other variables, the hazard of death among children who have altered pulse rate was 2.44 times higher than those who have normal pulse rate (AHR=2.44, 95% CI=1.47-4.0, p.value <0.001). This is in line with another study, in which the presence of altered pulse led to the increased risk of death in children [8, 19]. Since, altered pulse rate is a primary indicator of the presence of shock, serious infections, severe dehydration and fluid and electrolyte imbalance higher hazard of death is expected among exposed children.
Those children who feed with NG tube were 1.8 times more likely to die than children who feed per mouth. This could be explained by the fact that NG tube required when the child have altered consciousness, shock or serious infection and failed appetite test and complications like aspiration in part contributes to high mortality. Similarly, the hazard rate of death among children with anemia was 1.53 times higher than their counterparts. Research conducted in Sekota hospital of north Ethiopia, Dilla university referral hospital, JURH of south-west Ethiopia, South Africa and Niger reported the same finding [7, 8, 14, 20, 21]. This is because, during anemia, the prevalence of infection and the probability of heart failure increase and overall compliance will decrease.
Accordingly, the risk of death in children who have hypoglycemia was 1.78 times higher than their Normo-glycemic counterparts. The increased hazard of death in Hypoglycemia among severely malnourished children was also reported by other authors [8, 22], but in contrasts, to this study, a research conducted in Ugandan found no adequate association between hypoglycemia and increased hazard of death [23]. The other variables like type of SAM, DHN, altered pulse rate and administration of parenteral antibiotic failed to show association independently and significantly when other variables were controlled.
5. STRENGTH AND LIMITATION OF THE STUDY
The study compared the survival status and treatment outcome of SAM management at HSC and HCSC and identified possible predictors, which is first of its kind, since Health center based stabilization centers were established and used strong model (cox-proportional hazard model) to identify predictors. Admission data was collected before the outcome is known, which reduces bias and is easy to establish temporal relationship since the outcome is death. However, the findings of this study might suffer from the fact that it is retrospective study, records may not be reliable and variables may be missing.
Conclusion and Recommendations
The survival of children in HSC is significantly lower than HCSC. The mortality rate of SAM children among hospital admission was also significantly higher than HCSC admission and the minimum SPHERE standard. However, cure rate and default rate are not significantly different between the health facilities and are at the acceptable range in SPHERE standard, except the cure rate of HCSC which is slightly lower than the international standard. The main predictors of deaths for severely malnourished children admitted to SC were having altered pulse rate (Brady/tachycardia), Hypoglycemia, Anemia and NG tube feeding.
Therefore, early diagnosis and management of cases in SC according to the national protocol are needed with special attention to be paid for those children with comorbidities and altered general conditions; further organization of ICU is crucial as most severe cases are admitted at HSC. Further research involving a larger number of facilities is needed to give policy level recommendation.
LIST OF ABBREVIATIONS
| AHR | = Adjusted Hazard Ratio |
| HCSC | = Health Center based Stabilization Center, |
| HSC | = Hospital-based Stabilization Center, |
| MUAC | = Mid Upper Arm Circumference |
| PEM | = Protein-Energy Malnutrition |
| ReSoMal | = Oral REhydration SOlution for severely MALnourished patients |
| SAM | = Severe Acute Malnutrition (wasting and/or nutritional oedema) |
| SC | = Stabilization Center |
| SPHERE | = Social and Public Health Economics Research Groups. |
AUTHORS CONTRIBUTIONS
All authors equally contributed to this research.
AUTHOR INFORMATION
TG: is Bsc/public health, MPH in Epidemiology and Biostatistics, Lecturer at Department of Public health, College of Medicine and Health Sciences, Wolkite University, Wolkite, Ethiopia
EM: is Bsc/public health, MPH/General, Lecturer at Department of Public health, College of Medicine and Health Sciences, Wolkite University, Wolkite, Ethiopia
AW: Medical doctor, Lecturer at Department of Medicine, College of Medicine and Health Sciences, Wolkite University, Wolkite, Ethiopia
ETHICS APPROVAL AND CONSENT TO PARTICIPATE
Secondary records were the source of the data; therefore there is no direct contact with the clients. The study was ethically approved by Arba Minch University, College of Medicine and Health Sciences.
HUMAN AND ANIMAL RIGHTS
No animals/humans were used for studies that are the basis of this research.
CONSENT FOR PUBLICATION
Support letter and permission were obtained from the Zonal health department and health departments of the respective districts were also requested for permission.
COMPETING INTERESTS
The authors declare no conflict of interest, financial or otherwise.
ACKNOWLEDGEMENTS
The authors would like to sincerely thank Heads of Gedeo Zone and the district health departments, DURH, health professionals and data collectors and Arba Minch University, College of Medicine and Health Sciences for facilitating the study.

