All published articles of this journal are available on ScienceDirect.

Spatial Distribution and Analysis of Risk Factors Associated with Anemia Among Women of Reproductive Age: Case of 2014 Rwanda Demographic and Health Survey Data
Abstract
Background:
Anemia is an important public health problem affecting all age groups of the population. The objective of this study was to identify the risk factors associated with anemia among women of childbearing age in Rwanda and map their spatial variation.
Methods:
The 2014/15 Rwanda Demographic and Health survey data was used and the structured logistic regression model was fitted to the data, where fixed effects were modeled parametrically, non-linear effects were modeled non-parametrically using second order random walk priors and spatial effects were modeled using Markov Random field priors.
Results:
The prevalence of anemia among non-pregnant women of reproductive age was 18.9%. Women from the households which use water from the unprotected well had a higher risk of having anemia than a woman from the household where they use water piped into dwelling or yard. The risk of anemia was higher among underweight women and women living in households without toilet facilities. The anemia was less pronounced among the women using contraception, literate women, women from the households which use a bed net and living in rich households.
Conclusion:
The findings from this study highlighted the districts with the highest number of anemic women and this can help the policymakers and other public health institutions to design a specific programme targeting these districts in order to improve the health status and living conditions of these women. The findings also suggest an improvement of toilet facilities, bed net use and source of drinking water in affected households.
1. INTRODUCTION
Anemia is an important public health problem affecting all age groups of population. Globally, it affects 1.62 billion people and is more prevalent among pre-school age children and women [1, 2]. There are various causes of anemia among adults as well as children. Anemia among adults may also be the result of also some specific nutrients deficiencies, namely iron and vitamin B-12, infectious diseases such as HIV, tuberculosis, malaria, helminthic infection, schistosomiasis, and hookworm [3-6] among others but the contributions of these potential causes to the overall anemia burden are not well known and vary by geographical locations, dietary practices, genetic, and season. In the study carried out by Fischer et al. [7] among adult Mexican women, it was found that household food insecurity was associated with anemia. Maternal anemia is also associated with a risk for low birth weight and inadequate iron store for the newborn [8, 9]. In addition, anemia in pregnant women increases the risks of maternal and child mortality; it can also increase the risk of having preterm delivery; and it has negative consequences on the cognitive and physical development of children and work productivity [8, 9, 10-12]. Iron deficiency with or without anemia is prevalent among women of childbearing age because of menstrual losses or higher physiologic needs for iron. Women are generally known to be more vulnerable to iron deficiency causing anemia than men. According to the World Health Organization, iron deficiency anemia is considered as a public health problem when its prevalence exceeds 5.0% of the population [13]. In Rwanda, in general, the trend was decreasing as there was a tremendous decrease from 2005 to 2010 (26% -17% respectively). But from 2010 to 2015, the prevalence of anemia slightly increased from 17% to 19% [14].
The previous studies conducted in Rwanda were restricted to geographical locations such as province or districts of the country [15, 16]. In addition, none of them accounted for the possible non-linear effect of continuous covariates or mapped structure spatial effects. Therefore, the main objective of the current study is to identify the risk factors associated with anemia among women of reproductive age and to map their spatial effects. To the best of our knowledge, there is no study in the literature using structured logistic regression to identify the risk factors and mapping their spatial variation in Rwanda.
2. METHODS
2.1. Source of Data
The current study used secondary data from 2014/15 Rwanda Demographic and Health Survey (RDHS). The survey was conducted from 9th November 2014 to 8th April 2015. The survey used the sampling frame from the 2012 population and housing census NISR [14].
The sampling used in this survey was a two-stage stratified method. In the first stage, 113 enumeration areas were selected from urban areas and 379 from rural areas, with the probability proportional to the number of households residing in the village. In the second stage, systematic sampling was used for all households existing in the selected village and 26 households were selected in each village. More details on sampling techniques and data collection can be found in NISR [14]. A hemoglobin measurement was done on all women of reproductive age (15–49 years old) from whom consent was obtained NISR [14]. The missing data constituted only 1% and was, therefore, negligible since 99% of the selected women for the interviews responded.
2.2. Dependent Variable
The variable of interest in this study is the anemia status of the women of reproductive age. Anemia is normally categorized based on the level of Hemoglobin concentration (Hb) in blood, measured in grams per deciliter (g/dl). Following the WHO classification [2], anemia was classified as severe if Hb < 0, moderate when (7.0 ≤ Hb ≤ 9.9), mild anemia when (10.0 ≤ Hb ≤ 10.9) and non-anemic when Hb 11.0 ≥ g/dl for pregnant women. In non-pregnant women, it is classified as severe if the hemoglobin concentration level in blood is < 8 g/dl, moderate if (8.0 ≤ Hb ≤ 10.9), mild anemia when (11.0 ≤ Hb ≤ 11.9) and non-anemic when Hb ≥ 12.0 g/dl. In the present study, we are interested in any type of anemia among non-pregnant women. Consequently, a woman with hemoglobin concentration in blood less than 12g/dl was classified as anemic and a woman whose Hb ≥ 12.0 was classified as no anemic.
2.3. Independent Variables
The potential explanatory variables used in this study are socio-economic, demographic and household characteristics and they were previously used in other related studies [17-19] just to name few. Type of toilet facilities (no toilet, pit latrine with slab, pit latrine without slab, Ventilated Improved Pit (VIP) latrine, other type of toilet facilities), type of source of drinking water (piped into dwelling, public tap, unprotected well, protected well, unprotected spring, protected spring, river/dam/lake/ponds/stream/canal, other sources), bed net use (yes or no), whether the woman took any drug for malaria in pregnancy (yes or no), contraceptive method use (yes or no), wealth quintile (poor, middle, rich), literate (yes or no), education level (no education, primary, secondary and higher), place of residence (urban or rural), district of residence (30 districts), type of cooking fuel (charcoal, wood, straw/grass/shrub, other), body mass index (underweight, normal or obese), marital status (never married, currently married or living with partner, widow, divorced or separated), number of family members (continuous), pregnancy (yes or not), and tobacco use (yes or not).
2.4. Statistical Method
2.4.1. Model Formulation
Suppose yij is the anemia status of woman i from district j, with i = 1, 2, ..., 6056 and j = 1, 2,..., 30; where yij = 1 if woman i is anemic and yij = 0 otherwise. Let Xij = (xij1, xij2,..., xijm) be a vector of all m continuous independent random variables and Wij = (wij1, wij2,..., wijk) a vector of k categorical independent random variables. The anemia status of the women of reproductive age is a binary outcome in this study and therefore follows a Bernoulli distribution;
 |
(1) |
where Pij is the probability that a woman from district j is anemic and 1 - pijis the probability that a woman i from district j is not anemic. The risk of anemia can be associated with the explanatory variables using appropriate link function in Generalized Linear Models (GLM) approach as follows;
 |
(2) |
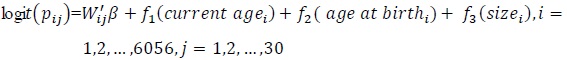
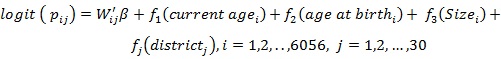
Model (2) is known as binary logistic regression, where Wij' is the vector of explanatory variables and β is the vector of coefficient parameters. But classical GLM has a rigid assumption that all observations are independent; however, this assumption is sometimes not satisfied as some observations may have spatial dependence. Therefore, there is a need to include the spatial variability in the model (2) and it is given by;
 |
(3) |
where βi is the vector of fixed effect corresponding to categorical variables, fk is the appropriate smooth function of continuous variables such as mother’s age at the birth, current age of the mother and the size of the family and fspat (Sj) are the parameter of random effects which captures unobserved spatial heterogeneity at district Sj.
2.4.2. Parameter Estimation
The estimation of the parameters is done using a full Bayesian analysis approach, where the appropriate prior distributions have to be assigned to all unknown parameters. In the current study, diffuse priors P (β) ∝ const are assigned to all fixed regression parameters. The current study estimated non-parametrically continuous covariates by assigning to them second–order Gaussian random walk priors [20] and given as
 with Gaussian error
 , the variance
 controls for the smoothness of f. For the prior distribution of structured spatial effects fi, the current study used the nearest neighbour Gaussian Markov random field model specified as an Intrinsic Conditional Autoregressive (ICAR) prior distribution [21] given as follows;
 |
(4) |
where NS is the number of regions and
 denotes that region r is neighbor of region s. Two different regions or areas are neighbours if they share a common boundary; neighbouring regions are assumed to have similar patterns, otherwise these two regions are not neighbours.
2.4.3. Posterior and Inferences
Posterior distributions are the distribution of the parameters after observing the data and are obtained by updating the prior distribution with observed data. A full Bayesian inference is based on the analysis of the posterior distribution of the model parameters. In the present study, the Bayesian posterior marginal distribution was estimated based on integrated nested Laplace Approximation [22], SPSS version 24 was used for data management and data exploratory and R-INLA 3.3.1 was used for inferential analysis.
2.5. Model Selection
Model goodness of fit was assessed using Deviance Information Criteria (DIC). The smaller the value of DIC the better fit is the model [23, 24]. DIC is a generalization of Akaike Information Criterion [25] and the DIC value is given by;
 |
(5) |
where
 is the posterior mean of the deviance and pD is the number of effective parameters in the model that penalizes the complexity of the model. DIC takes both the model fit (summarized by
) and model complexity (captured by pD) into consideration when comparing models. When comparing two competing models, the size of the difference in DIC values of these two models in order to declare that one model is better than other is not clear cut. But some studies have stated that a difference in DIC of 3 between two models cannot be distinguished whereas a difference between 3 and 7 can be weakly differentiated [23, 26].
is the posterior mean of the deviance and pD is the number of effective parameters in the model that penalizes the complexity of the model. DIC takes both the model fit (summarized by
) and model complexity (captured by pD) into consideration when comparing models. When comparing two competing models, the size of the difference in DIC values of these two models in order to declare that one model is better than other is not clear cut. But some studies have stated that a difference in DIC of 3 between two models cannot be distinguished whereas a difference between 3 and 7 can be weakly differentiated [23, 26].
2.6. Data Analysis
The present study fitted and examined the following models:
Model A1:

Model A2:
Model A3:

Model A4:
Model A1 is classical logistic regression, where all categorical (body mass index, bed net use, contraceptive use, literacy, wealth quintile, type of source of drinking water, type of toilet facilities, type of cooking fuel) and continuous (current age of the woman, age at birth, size of the household) variables are considered as fixed effects and they are assumed to have a linear effect on the response variables. In this model, continuous variables are assumed to have a linear effect.
In model A2 categorical variables listed previously in model A1 were assumed to have a linear effect on the response variable and continuous variables are modeled non-parametrically and this model is known as an additive logistic regression model.
In model A3 all covariates were modeled as fixed effects and structured random effects as structured spatial effects that cover the unobserved covariates which are essential within the districts. Model A4 is an extension of model A2 to include structured spatial effects and the model is known as a structured additive regression model.
3. RESULTS AND INTERPRETATIONS
In order to make sure that the estimates obtained from the present study were represented at the national level, the survey weights provided in Rwanda Demographic and Health Survey data set were used in the analysis. The initial descriptive statistics were done using cross-tabulation analysis and it was assessed based on Chi-square test to investigate the relationship between anemia status among women of reproductive age and categorical variables at 5% level of significance; we considered a median and interquartile range for continuous variables and the results are summarized in Table 1. A total of 6056 non-pregnant women of childbearing age was considered in this study, among them, 1205 were from urban and 4850 from rural area; the majority of participants were literate (72.8%) and more than half were married or living with partner (52%). The median age of the respondent was 28 and the interquartile range was 16. The median number of members per household was 5 whilst the interquartile range was 3; the median age of the respondent at first birth was 21 and the interquartile range was 5. The overall prevalence of anemia among non-pregnant women of reproductive age in Rwanda was 18.9%.
| Variable | Categories |
Anemic N (%) |
Not Anemic N (%) |
P-value |
|---|---|---|---|---|
| Currently breastfeeding | Yes No |
354 (19.4%) 790 (18.7%) |
1472(80.6%) 3439(81.3%) |
.271 |
| Smoking | No Yes |
1105 (18.7%) 39(28.9%) |
4815(81.3%) 96 (71.1%) |
.003 |
| BMI (kg/m2) | Normal or obese (BMI 18.5) Underweight (BMI<18.5) |
1041(18.4%) 103 (26.2%) |
4621(81.6%) 290(73.8%) |
< 0.0001 |
| Marital status | Never in union(single) Married/living with partner Widowed Divorced or separated |
458(18.9%) 524 (17.6%) 75 (28.0%) 87 (22.4%) |
1960 (81.1%) 2458(82.4%) 193 (72.0%) 301 (77.6%) |
< 0.0001 |
| Wealth index | Poor Middle Rich |
524 (22.2%) 213 (18.8%) 406(15.9%) |
1838(77.8%) 920 (81.2%) 2153(84.1%) |
< 0.0001 |
| Bed net use | Yes No |
803 (18.1%) 455 (21.7%) |
3635(81.9%) 1646 (78.3%) |
.0001 |
| Respondent education | No education Primary Secondary and higher |
160(22.0%) 734 (18.8%) 249(17.4%) |
568 (78.0%) 3165(81.2%) 1179 (82.6%) |
0.039 |
| Type of source of drinking water | Piped into dwelling/ yard Public tap Unprotected well Protected well Protected spring Unprotected spring River/lake/ponds/stream/canal Others |
136 (17.7%) 278 (17.6%) 43 (31.9%) 33(30.3%) 361 (19.1%) 146(19.7%) 120 (17.6%) 28 (18.9%) |
631(82.3%) 1306 (82.4%) 92(68.1%) 76 (69.7%) 1532 (80.9%) 596 (80.3%) 560 (82.4%) 120 (81.1%) |
.0001 |
| Cooking fuel | Charcoal Wood Straw/grass/shrub Others |
169 (16.1%) 744 (18.6%) 212 (22.40) 19 (30.2%) |
881 (83.9%) 3254(81.4%) 733 (17.6%) 44 (69.8%) |
< 0.0001 |
| Place of residence | Urban Rural |
187 (15.5%) 957(19.7%) |
1019(84.5%) 3893 (80.3%) |
<0.0001 |
| Province of residence | Kigali South West North East |
113 (13.8%) 338(23.3%) 236(17.9%) 147 (14.6%) 311 (21.2%) |
703 (86.2%) 1115(76.7%) 1083(82.1%) 857 (85.4%) 1154(78.8%) |
< 0.0001 |
| Contraceptive use | Yes No |
304 (15.0%) 840 (20.9%) |
1724(85.0%) 3187(79.1%) |
< 0.0001 |
| Literate | Yes No |
876 (18.0%) 268 (22.5%) |
3990 (82.0%) 922 (77.5%) |
.0001 |
| Type of toilets | Flush Pit latrine with slab Pit latrine without slab/open VIP latrine No facilities Others |
39 (19.6%) 690 (17.9%) 298 (20.6%) 52 (14.9%) 64 (30.9%) 12(33.3%) |
160 (80.4%) 3156(82.1%) 1147(79.4%) 296 (85.1%) 143 (69.1%) 24(66.7%) |
< 0.0001 |
Tobacco use was significantly associated with anemia status of women of childbearing age (p-value=0.003). The prevalence of anemia was 19.0% among women who do not use tobacco and 28.9% among women who use tobacco. Women’s marital status is also a significant risk factor associated with anemia status of women of childbearing age (p-value < 0.0001). The prevalence of anemia was 19.0%, 18.2%, 27.6% and 23.4% among single, married, widow and divorced or separated women, respectively. The respondent’s body mass index was also significantly associated with anemia status (p-value < 0.0001). The prevalence of anemia was 18.8% among normal or obese women and 26.3% among underweight women. The wealth quintile of the household is significantly associated with anemia status among women in Rwanda (p-value <0.0001). The prevalence of anemia was 22.7%, 18.8% and 16.2% among women from poor, middle and rich households, respectively. The bed net use was also significantly associated with anemia status of the women (p-value=0.001). The prevalence of anemia was 18.1% among women who used a bed net before the survey and 21.7% among women who did not use a bed net before the survey. The prevalence of anemia was 22.5%, 19.1% and 18.0%, respectively among women with no level of education, primary education and women with secondary or tertiary education level (p-value=0.028). The prevalence of anemia was higher among women from households where they used water from unprotected well 30.7%, protected well 30.0% and less among women whose household used water piped into dwelling or yard 17.7% (p-value=0.001). The prevalence of anemia was 16.9%, 18.8%, 23.0% and 31.8% among women whose household used charcoal, wood, straw or grass or shrub and other sources of cooking fuel other than charcoal, wood and straw or grass or shrub respectively (p-value <0.0001). The prevalence of anemia was higher among women from rural compared to women from an urban area (20.0% and 16.5%, respectively).
The prevalence of anemia was higher in Southern province 22.9% and low in Kigali city 14.6% (p-value=0.000). The prevalence was 15.0% among women who did use contraceptive methods and 22.4% among women who did not use any type of contraceptive method (p-value <0.0001).
In the final analysis, only significant variables from cross-tabulation analysis were included in multivariable spatial modelling.
It is seen from Table 2 that model A4 has the smaller DIC compared to DICs of model A1, model A2 and model A3. Therefore, based on the principles of DIC, model 4 was found to be the better model fit and thus it is used in the final analysis.
| Statistics | Model A1 | Model A2 | Model A3 | Model A4 |
|---|---|---|---|---|
| DIC | 5789.44 | 5811.30 | 5745.63 | 5741.18 |
|
|
5737.71 | 5750.55 | 5667.55 | 5645.65 |
| pD | 25.865 | 30.38 | 39.04 | 47.77 |
3.1. Fixed Effect
The results of fixed effects of categorical variables and their corresponding 95% credible interval (CI) are summarized in Table 3. Any variable, whose mean has the same sign as lower and upper credible interval is significant, else it is not significant.
| Variable | Posterior Mean |
Posterior Standard Error |
95% Credible Interval |
|---|---|---|---|
| Intercept | -1.5181 | 0.2605 | (-2.0341, -1.0109) |
| BMI(Kg/m2) (≥18.5=ref) underweight |
0.2981 | 0.1254 | (0.0490, 0.5415) |
| Contraceptive use (no=reference) Yes |
-0.4421 | 0.0853 | (-0.6102, -0.2753) |
| Bed net use (no=reference) Yes |
-0.1964 | 0.0758 | (-0.3449, -0.0474) |
| Literacy (no=reference) Yes |
-0.1453 | 0.0874 | (-0.3159, -0.0022) |
| Wealth index (poor=reference) Middle Rich |
0.1711 0.2861 |
0.1085 0.1009 |
(-0.0423, 0.3835) (0.0885, 0.4843) |
| Type of cooking fuel (charcoal=ref) Straw/grass/shrub Wood Others |
-0.0961 -0.1412 0.5691 |
0.1574 0.1298 0.2978 |
(-0.4052, 0.2126) (-0.3952, 0.1142) (0.0299, 1.1406) |
| Toilet facilities (VIP=ref) Pit latrine without slab/open Pit latrine with slab No toilet Flush toilet Others |
0.3290 0.3399 0.4821 0.3988 1.0991 |
0.1782 0.1651 0.2404 0.2363 0.4125 |
(-0.0143, 0.6854) (0.0234, 0.6720) (0.0110, 0.9533) (-0.0649, 0.8628) (0.2687, 1.8900) |
| Type of source of drinking water (piped into dwelling/yard=ref) Public tap Protected well Unprotected well Protected spring Unprotected spring Rivers /dam Others |
0.0319 0.2399 0.4726 0.1247 0.1736 0.2784 0.0962 |
0.1337 0.2472 0.2534 0.1302 0.1498 0.1726 0.2477 |
(-0.2286, 0.2960) (-0.2509, 0.7201) (0.0329, 0.9629) (-0.1284, 0.3823) (-0.1195, 0.4683) (-0.0598, 0.6175) (-0.4012, 0.5723) |
The findings show that body mass index, contraceptive use, bed nets use, wealth quintile index, type of cooking fuel, type of toilet facilities and type of drinking water sources were the risk factors associated with anemia in multivariate structured logistic regression. An underweight woman has an increased the risk of anemia than those women who are normal or obese as the coefficient for an underweight woman is positive. This means that underweight women have a higher risk of women of childbearing anemia compared to normal and obese women.
It is observed from Table 3 that the coefficient of using contraceptives is negative. This means that women who use contraceptives are at low risk of being anemic compared to women who do not use them. A woman from a poor family had a higher risk of experiencing anemia compared to a woman from a rich household. Also, a woman from a family where they use types of cooking fuel other than wood and straw/grass/shrub had a higher risk of experiencing anemia compared to a woman from a family which uses charcoal. Toilet facilities were also found to significantly affect the woman’s anemia status. It was found that anemia was higher among the women from households with no toilet facilities and much more than among the women from a family where they use a toilet other than flushing, pit latrine with slab, pit latrine without slab compared to women where they use Ventilated improved pit latrine. It was also found that a woman from a family which uses water from the unprotected well had a higher risk of having anemia as compared to a woman from the family where they use water piped from the dwelling or yard.
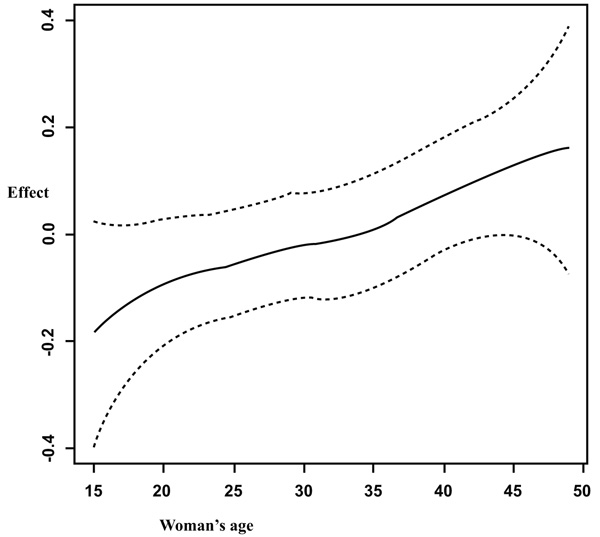
3.2. Nonlinear Effects
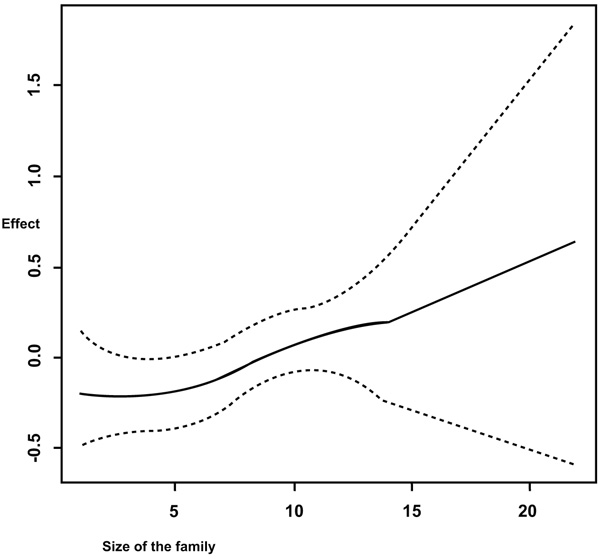
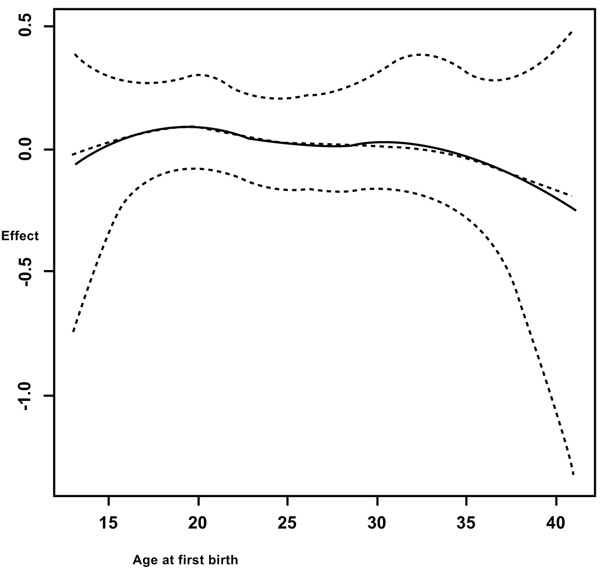
It is observed from Fig. (1) that in general, the anemia increases with increasing age of the woman. But a sharp increase is observed from fifteen years old to twenty years old. Figs. (1, 2 and 3) summarizes the non-linear effects of age of the respondent, of size of the household and the respondent’s age at first birth respectively on anemia status. It is observed from Fig. (1) that anemia increases with age up to approximately 30 years and a U shape is observed between 30 and 40 years old and afterward anemia increases with age. The results from Fig. (2) showed that anemia increases with increasing the number of the family members. It is also observed from Fig. (3) that the risk of anemia increases with increasing age from 5 members and more and presents a U shape from a household of one member to five members in household with a minimum when the household has two members (most of the cases were wife and husband or partner, this means before having children).
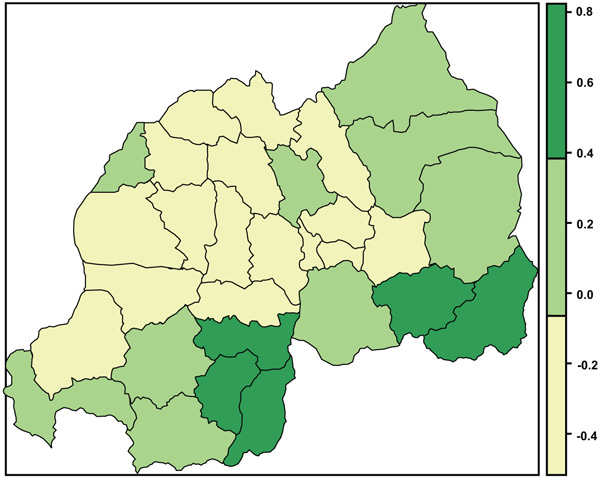
3.3. Spatial Effects
The present study found positive and negative structured spatial effects on anemia status among women of reproductive age. Fig. (4) presents structured spatial effects on anemia among women of childbearing age; where yellow shows significant negative effects on anemia, green shows significant positive effects and yellow-green non-significant effect.
4. DISCUSSIONS
Anemia among women of reproductive age is a common problem encountered mainly among pregnant women mostly in developing countries and is the main cause of morbidity and mortality. The overall prevalence of anemia in the current study was 18.9% and this was considerably lower compared to what was reported from DR Congo 38% [27], Tanzania 45% [28], Burundi 39% [29], Uganda 32% [30], and Ethiopia 24% [31] to name few.
The findings of this study showed that the risk of anemia is higher among women from poor households. This finding is similar to that of NISR [14] and Kamruzzaman et al. [17]. This may be explained by the fact that a woman from a poor household may not easily find enough and healthy food, appropriate and timely health service, and better maternal health care. But the study did not find a statistical significant difference between a woman from middle-income households and a woman from rich households.
The findings from this study also showed that the risk of anemia was higher among underweight woman. This is consistent with findings from previous studies [17, 19, 32-34]. Although higher body mass index may not always indicate appropriate micronutrient intake, an underweight (BMI<18.5g/m2) person is more likely to have other associated co-morbidity illness and hence be deficient in some necessary micronutrient that may be associated with anemia [33].
The results from this study revealed a significant inverse relationship between literacy and anemia status among women of reproductive age. A literate woman may access information related to maternal health more easily, and have a job or business to generate an income for the family which in turn contributes to the well-being of her and her family. The education level is known to have an important effect on the socio-economic and demographic context of anemia prevalence, mostly in developing countries, but the current study did not find a statistically significant association between respondent’s education levels and anemia status.
Another finding from this study was that the risk of anemia among women lessened with the use of mosquito bed nets. The use of bed nets in this present study was used as a proxy for malaria infection. In a study by Wirth et al. [35] done in Sierra Leone, they found that malaria and inflammation were each associated with anemia. The risk of anemia was observed to decrease among women who were using a contraception method at the period of survey. This finding is similar to the findings of Kamruzzaman et al. [17]; Massawe et al. [36]; Heck et al. [37] and Asres et al. [38]. The results from this study revealed that a hygienic toilet can serve as a protective factor against anemia among women. A similar finding was obtained by Kamruzzaman et al. [17]. The type of toilet facility is among the most basic level of sanitation. The women from households without toilet facilities may be susceptible to infection by hookworms and parasites [18, 39, 40] and this may support our findings that lack of toilet facilities in household or community increases the risk of anemia. The association of unhygienic toilet with anemia can also be explained in general by poor health or chronic blood loss through gastrointestinal parasite infection [17].
The present study did not find any statistically significant association between lactating, pregnant women, amenorrhea, woman’s education level, number of children ever born, place of residence and tobacco use and anemia among women of reproductive age in Rwanda in multivariate structured logistic regression.
The study also considered non-linear effects of continuous covariates on anemia status among women. It was observed from Fig. (2) that the risks of anemia increase with increasing the size of the family. Further, it was observed from the same figure that between five and ten members, the credible intervals were a bit narrowed and this means that there were many observations in this interval and few observations towards the end which made credible intervals to widen (few households have 22 members).
It was also observed from Fig. (3) that giving birth at an earlier age increases the risk of anemia, especially between 13 and 23 years old. It was found that the risk of having anemia increases with increasing age. In the study by Kamruzzaman et al. [17] among Bangladesh women, they found that older women (30-49 years old) were more likely to be anemic compared to young women (15-29 years old).
The finding of this study showed a positive spatial pattern of anemia distribution in districts Nyanza, Huye and Gisagara (southern province), and Kirehe and Ngoma in Eastern province. This finding is similar to that of NISR et al. [14]; in their report from RDHS (2014/2015); they found a higher prevalence of malaria in Southern and Eastern provinces and prevalence of anemia was higher in Southern province followed by Eastern province. In a recent study by Habyarimana et al. [41] on risk factors of childhood anemia, found that the prevalence of anemia was higher in Southern and Eastern Provinces. But malaria may not be the only cause; therefore, a thorough epidemiological study is needed to find out the cause of this higher prevalence of anemia in the above-named districts.
CONCLUSION
This study applies a Bayesian semi-parametric modeling methodology. This model is different from classical modeling approach concepts in its flexibility that can reveal the important features of continuous variables. The objective of the current study was to identify the risk factors associated with anemia and to map their possible spatial effects on anemia among women of childbearing age. The findings of this study showed that body mass index, contraceptive use, bed nets use, drug intake for malaria in pregnancy, wealth quintile of the household, type of cooking fuel, type of toilet facilities and type of source of drinking water, age of the woman, age at the first birth and the size of the family were the risk factors associated with anemia. The findings from this study also highlighted five districts from southern and eastern provinces with the highest number of anemic women. The negative spatial effects were found mostly among districts from Northern Province and Kigali city. The findings from this study may serve to help public health planners, policymakers and other related institutions in making effective decisions for fighting anemia efficiently. They may also serve as useful empirical grounding to the growing literature on geographical and sociological dimensions of health and disease [42, 43].
LIMITATIONS OF THE STUDY
The current study used a cross-sectional data from 2014/15 RDHS and this data may not be able to address causality. Also, we were interested to use data on dietary intake but DHS dataset does not provide this information on individuals surveyed. Therefore, longitudinal studies that include dietary data may be suggested for future work.
ETHICS APPROVAL AND CONSENT TO PARTICIPATE
The study uses secondary data from 2014/2015 RDHS. The 2014/15 RDHS was reviewed and approved by Rwanda National Ethics Committee, National Institute of Statistics of Rwanda and International Review Board of ICF International. We were granted permission by ICF international, Inc. to use these deidentified data.
HUMAN AND ANIMAL RIGHTS
No animal/humans were used for the studies that are bases of this research.
CONSENT FOR PUBLICATION
Not applicable
AVAILABILITY OF THE DATA
RDHS data are freely available to registered users with permission at http://dhsprogram.com.data/Rwanda_Standard-DHS2015.cfm.
COMPETING INTERESTS
The authors declare that they have no competing interests.
DECLARATION OF CONFLICTING INTERESTS
The authors declare no potential conflicts of interest with respect to the research, authorship, and or publication of this article.
FUNDING
The authors received no funding for this study.
ACKNOWLEDGEMENTS
The authors acknowledge National Institute of Statistics of Rwanda (NISR) [Rwanda], Ministry of Health (MOH) [Rwanda], and ICF International for the data.

