All published articles of this journal are available on ScienceDirect.

Medication Adherence and its Association with Glycaemic Control, Blood Pressure Control, Glycosuria and Proteinuria Among People Living With Diabetes (PLWD) in the Ho Municipality, Ghana
Authors Info & Affiliations
Abstract
Background:
Adherence is the active, voluntary, and collaborative involvement of the patient in a mutually acceptable course of behaviour to produce a therapeutic result. The study is aimed at assessing adherence to medication and its relation to therapeutic outcomes among people living with diabetes in the Ho Municipality.
Methodology:
A cross-sectional study was conducted involving 150 diabetic patients attending the diabetic clinic at the Ho Municipal Hospital. Urine glucose and urine protein were measured using a two-parameter dipstick. The current fasting blood glucose and blood pressure, as well as the measurements of two previous visits, were documented. A semi-structured questionnaire including the Diabetes Complication Checklist and the Morisky, Green and Levine Adherence Scale were used to capture biodata, clinical information and medication adherence.
Results:
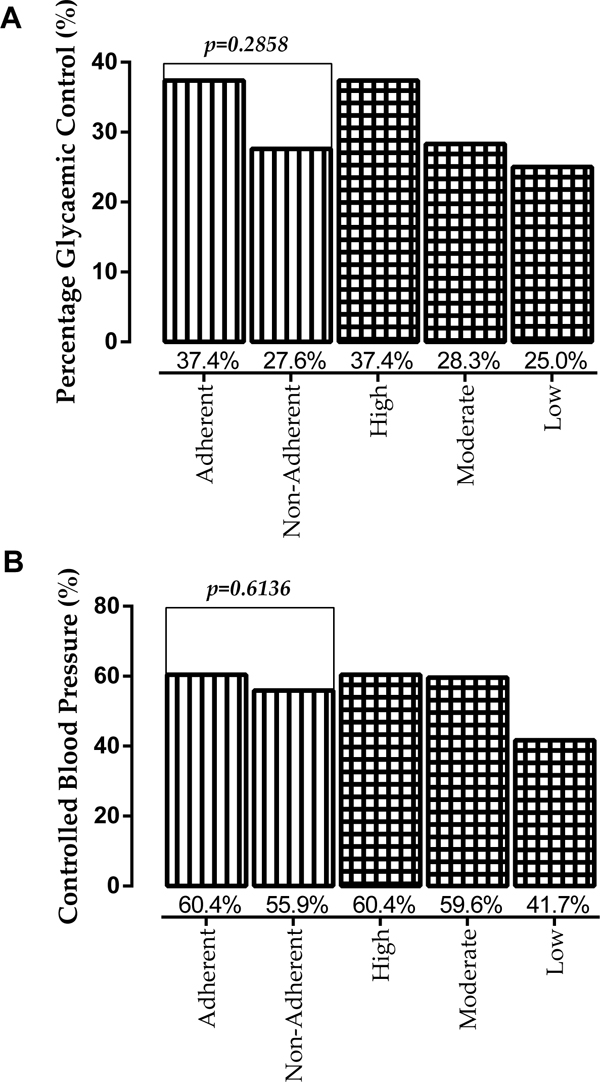
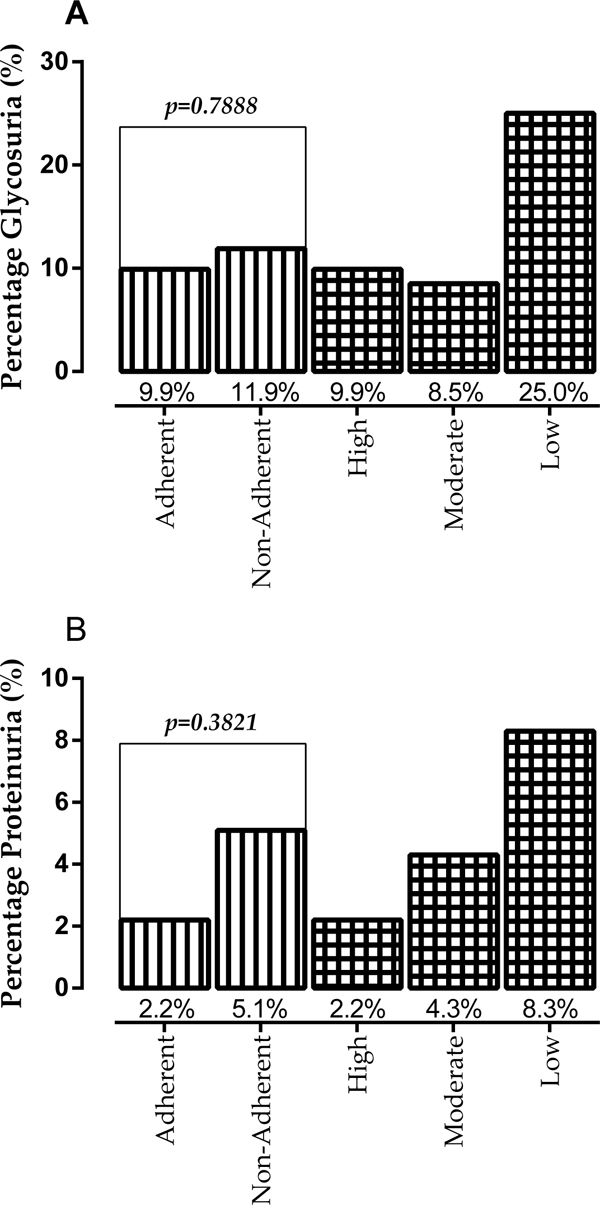
Optimal medication adherence was 60.67%. Glycaemic control and controlled blood pressure were 33.33% and 58.67%, respectively. The prevalence of glycosuria and proteinuria was 10.67% and 3.3%, respectively. Percentage glycaemic control and controlled blood pressure were found to be higher among the medication adherent group, while glycosuria and proteinuria were the highest among participants presenting with low medication adherence.
Conclusion:
In this group of patients living with diabetes in the Ho Municipality, high level of uncontrolled glycaemia and blood pressure exist.
However, these two treatment outcomes may be modulated by optimal medication adherence.
1. INTRODUCTION
Diabetes mellitus, a complex chronic disease, is a growing worldwide epidemic with the number of people presenting with diabetes estimated to reach 330 million by 2030 [1]. In Sub-Saharan Africa (SSA), growth rates of Diabetes Mellitus (DM) and hypertension are among the highest worldwide [2]. In contemporary times, diabetes mellitus prevalence has been increasing in Ghana [3, 4].
Complications associated with diabetes may result if management of the condition is suboptimal [3]. An estimated 20 to 30% of all diabetes patients who visit the hospital report principal symptoms and complications related to diabetes (e.g., dizziness, exhaustion, vision, foot complaints, hypertension, nephropathy, etc.) [2, 5]. The cost of managing diabetes as well as the associated complications has a significant impact on the healthcare systems [6]. Frequent Self-Monitoring of Blood Glucose (SMBG), lifestyle modifications and administration of pharmacological medications as per schedule are some of the interventions employed in the management of diabetes [7]. The principal goal of anti-diabetic pharmacotherapy is to maintain glycaemic control [8].
Adherence has been defined as the active, voluntary, and collaborative involvement of the patient in a mutually acceptable course of behavior to produce a therapeutic result [6, 9]. Interventions do not work in patients who do not adhere to them [10]. It is clear that the full benefit of many of the effective interventions that are available will be achieved if patients follow prescribed treatment regimen reasonably closely [7]. Treatment nonadherence is particularly prevalent among patients with diabetes, and inadequate adherence compromises safety and treatment effectiveness [1, 8]. A growing body of literature on patient adherence to anti-diabetic treatment regimen has shown that a significant proportion of patients are non-adherent ranging from as low as 6.3% to as high as 87% [6, 8, 9]. The lack of treatment adherence among people with diabetes results in poor glycemic control and can consequently lead to complications associated with disease progression, hospitalisation, premature disability, and mortality with considerable direct and indirect costs to the healthcare system [8, 9, 11].
Sharma, and Kalra [7] have recommended frequent assessment of treatment adherence among diabetic patient before considering prescription or dosage changes or addition of new drugs. The paucity of data on patients’ adherence to anti-diabetic regimen exists in the Ghanaian literature, with no known work in the regional and municipal jurisdiction of this study. Using a standard and internationally validated assessment tool for medication adherence (Morisky Green Levine Medication Adherence Scale (MGLS) [12], this study seeks to evaluate adherence to medication and its relation to clinical therapeutic outcomes (glycaemic control, controlled blood pressure, glycosuria and proteinuria) among people living with diabetes in the Ho Municipality.
2. MATERIALS AND METHODS
2.1. Study Design and Study Site
A hospital-based cross-sectional study was carried out among 150 purposively recruited diabetics attending the outpatient department of the Diabetes Clinic of the Ho Municipal Hospital. A patient needs to have three consecutive monthly readings of fasting blood glucose and blood pressure measurements recorded in the folder before he/she can qualify for recruitment. The study participants were all consenting adults with type 2 diabetes and were on medication therapy.
2.2. Sample Size Determination
On the average, 61 patients visited the diabetic clinic in a month. Thus for the four months period of data collection, the total expected study population was 244. We calculated a minimum acceptable sample size of 150 at 95% confidence level, 5% allowable error, and a response distribution of 50%. The Roasoft online sample size calculator was employed (Roasoft. Inc, 2004, http://www.raosoft.com/samplesize.html).
2.3. Biodata and Clinical Information
A self-reported, semi-structured questionnaire including the Diabetes Complication Checklist, was used to collect biodata and clinical information. The demographic information captured included age, gender, marital status, educational background and employment status. Duration of diabetes, type of medication and diabetes-related complications experienced formed part of the clinical information obtained.
2.4. The Morisky, Green and Levine Adherence Scale (MGLS)
We used the Morisky, Green and Levine Adherence Scale (MGLS) which is in the public domain and does not require permission to be used in assessing the medication adherence of participants. The instrument is a four-item questionnaire related to missed-doses, with a yes/no answer option. Medication adherence is classified as high (score 0 yes), medium (Score 1-2 yes) and low (Score 3-4 yes) or a binary score of adherence (Score 0 yes) and non-adherence (Score 1-4 yes) [12, 13]. The instrument was piloted prior to use among 23 diabetes patients at the same setting of the study and reliability statistics of 0.606 Cronbach’s Alpha and 0.616 Cronbach’s Alpha based on standardized items was recorded.
2.5. Urine Chemistry
Midstream urine samples were collected in clean urine containers and were tested as soon as received. Urine glucose and protein were measured using the two-parameter urine strip (URIT Medical Company Limited, China). A reagent strip was wholly immersed gently into the fresh well-mixed urine sample. The strip was removed immediately to avoid dissolving out reagents. While removing the strip, it was drained at the side of the urine container to remove excess urine. Each reagent area was compared to the corresponding colour block indicated on the colour chart and read between 1 to 2 minutes. The normal glucose range was (2.8 to 11.0 mmol/l), and that of protein was (0.13 to 0.30 mmol/l).
2.6. Blood Glucose and Blood Pressure Parameters
Fasting blood glucose and blood pressure measurement, as well as consecutive fasting glucose and blood pressure readings of previous visits within a three month period, were recorded from patients’ diabetes record booklets. Glycaemic control was defined as consistent fasting blood glucose levels of 4 to 7 mmol/L for the three months periods. Controlled blood pressure was defined as consistent blood pressure readings of < 140/90mmHg systolic/diastolic blood pressure for the three months period.
2.7. Statistical Analysis
Categorical variables were expressed as frequency and proportion. The difference between proportions was tested with Fisher exact or chi-square test where appropriate and at all times an alpha of less than 0.05 was considered a statistically significant. The receiver operator characteristic analysis was used to estimate threshold cut-off. IBM Statistical Package for the Social Sciences version 22.00 was used for data analysis (SPSS Inc, Chicago, USA; www.spss.com).
3. RESULTS
The study population consisted of a higher female married sub population. The age of respondents ranged from a minimum of 27 years to a maximum of 84 years with majority 40 years and above (87.34%). These participants have been living with diabetes from 1 to 33 years with over 45% diagnosed with the disease within the last 5 years (46.67%). Participants with basic education predominated, followed by those with tertiary and secondary education. As seen in Table 1, most participants had jobs in the informal sector and were on oral therapy (88.67%).
| Parameter | Frequency | Percentage |
|---|---|---|
| Total | 150 | 100 |
| Gender | ||
| Male | 41 | 27.33 |
| Female | 109 | 72.67 |
| Age Range | ||
| <40 years | 5 | 3.33 |
| 40-49 years | 14 | 9.33 |
| 50-59 years | 40 | 26.67 |
| 60-67 years | 52 | 34.67 |
| >70 years | 39 | 26.00 |
| Marital Status | ||
| Single | 44 | 29.33 |
| Married | 106 | 70.67 |
| Duration of Diabetes | ||
| 1-5 years | 70 | 46.67 |
| 6-10 years | 44 | 29.33 |
| > 10 years | 36 | 24.00 |
| Educational Background | ||
| None | 17 | 11.33 |
| Basic | 65 | 43.33 |
| Secondary | 17 | 11.33 |
| Tertiary | 51 | 34.00 |
| Employment Status | ||
| None | 17 | 11.33 |
| Formal | 56 | 37.33 |
| Informal | 77 | 51.33 |
| Type of Treatment | ||
| Oral Medication | 133 | 88.67 |
| Insulin | 13 | 8.67 |
| Both | 4 | 2.66 |
Almost all the participants in this study reported having experienced at least one diabetic complication 149(99.33%). More than half of the respondents reported having hypertension 123(82.55%), visual problems 114(76.51%) and numbness of feet 104(69.80%). The least recorded complication was footsore. In most cases, the female subpopulation was presented with a higher percentage of different diabetes complications. Most patients reported experiencing two to four different complications (74.00%). Six patients reported experiencing six and above complications (Table 2).
| Parameter | Total | Male | Female |
|---|---|---|---|
| Type of Complication | |||
| Total Respondent | 149(100) | 41(27.52) | 108(72.48) |
| Hypertension | 123(82.55) | 35(85.37) | 88(81.48) |
| Visual Problems | 114(76.51) | 31(75.61) | 83(76.85) |
| Numbness of Feet | 104(69.80) | 26(63.41) | 78(72.22) |
| Tingling Feet | 61(40.94) | 11(26.83) | 50(46.30) |
| Morning Headaches | 17(11.41) | 2(4.88) | 15(13.89) |
| Thirst/Dry Mouth | 14(9.40) | 4(9.76) | 10(9.26) |
| Chest Pain | 11(7.38) | 2(4.88) | 9(8.33) |
| Abdominal Pain | 11(7.38) | 1(2.44) | 10(9.26) |
| Foot Sore | 3(2.01) | 0(0.00) | 3(2.78) |
| Number of Complications | |||
| Total Respondent | 150(100) | 41(27.33) | 109(72.67) |
| None | 1(0.67) | 0(0.00) | 1(0.92) |
| One | 22(14.67) | 8(19.51) | 14(12.84) |
| Two | 30(20.00) | 9(21.95) | 21(19.27) |
| Three | 35(23.33) | 12(29.27) | 23(21.10) |
| Four | 46(30.67) | 11(26.83) | 35(32.11) |
| Five | 10(6.67) | 0(0.00) | 10(9.17) |
| Six | 5(3.33) | 1(2.44) | 4(3.67) |
| Seven | 1(0.67) | 0(0.00) | 1(0.92) |
Within the period of recall using the Morisky, Green and Levine Adherence Scale, self-reported optimal adherence to medication among people living with diabetes in the Ho Municipality was 91(60.67%), 63.41% among male diabetics and 59.63% among female diabetics. Forty-seven (31.11%) were categorized as having medium adherence, and 8.00% of the diabetic population had low adherence scores (Table 3).
| Medication Adherence | Total | Male | Female |
|---|---|---|---|
| High | 91 (60.67) | 26 (63.41) | 65 (59.63) |
| Medium | 47 (31.33) | 12 (29.27) | 25 (32.11) |
| Low | 12 (8.00) | 2 (7.32) | 9 (3.26) |
The prevalence of glycosuria was 10.67% of the total study population, 17.07% among the female and 8.26% among the male. Five (5) persons representing 3.33% of the respondents presented with proteinuria. Fifty (50) participants representing 33.33% presented with plasma glucose levels within the normal range and 58.67% had their blood pressure controlled (Table 4).
| Gender |
Total 150(100) |
Male 41(27.33) |
Female 109(72.67) |
p-value |
|---|---|---|---|---|
| Glycosuria | 16(10.67) | 7(17.07) | 9(8.26) | 0.1060 |
| Proteinuria | 5(3.33) | 1(2.44) | 4(3.67) | 0.5830 |
| Glycaemic Control | 50(33.33) | 14(34.15) | 36(33.03) | 1.000 |
| Controlled BP | 88(58.67) | 66(60.15) | 22(53.66) | 0.2807 |
The plasma glucose threshold cut-off value for the excretion of glucose in the urine among this group of diabetes patients was >11.9 mmol/l among the entire study participants within a 93.75 sensitivity and 85.71 specificity. The plasma glucose cut-off was >11.1 mmol/l among the male participants and >11.9 mmol/l in the female participants (Table 5).
Percentage controlled glycaemia and blood pressure were observed to be higher among patients who adhered to their medication, though the difference was not statistically significant. A decreasing trend of percentage glycaemic control and controlled blood pressure was observed along the medication adherence continuum from high adherence to low adherence (Fig. 1a & b).
Assessing glycosuria among participants, 11.9% of patients without optimal medication adherence presented with glycosuria as compared to 9.9% of patients with optimal adherence, however, the percentage difference in glycosuria was not statistically significant among the groups. Patients with low adherence presented with the highest glycosuria (25.0%) (Fig. 2a). Though not statistically significant, participants without optimal adherence presented with higher proteinuria (5.1%) compared to patients with optimal adherence (2.2%) (Fig. 2b). Proteinuria was observed to increase from high adherence to low adherence (Fig. 2b).
4. DISCUSSION
The background information provided by the participants in the present study was found to be similar to that of other diabetes populations reported in earlier studies in Ghana [14-18] and Nigeria [19].
In the current study, the top three diabetes complications were hypertension (82.55%), visual problems 76.515% and numbness of feet 69.80%. In a multinational study, Papatheodorou, Papanas [20] reported a high rate of both macrovascular and microvascular complications among diabetes patients. Glycaemic control is acknowledged as the major contributing factor to diabetes complications [21]. However, there is a growing evidence that the underlying mechanisms in the pathogenesis of diabetic complications include certain genetic and epigenetic modifications, such that patients with equal levels of non-adherence may present with varying forms and degrees of complications [20].
Previous studies have demonstrated that adherence is an essential factor for achieving the full effect of therapy [5, 7, 9, 10]. In the current study, we assessed the adherence to medication among people living with diabetes. Self-reported optimal medication adherence was 60.67% with 31.33% moderate missed-dose and 8.00% high missed-dose. Though a little lower, the findings compare favourably with the recent report from Dormaa Hospital in the Brong Ahafo Region of Ghana by Amaltinga [11], where optimal medication adherence among diabetics was 68.5%. However, the findings were contrary to that of Bruce, Acheampong [6] who reported adherence to 38.5% at the Korle-Bu Teaching Hospital and Arifulla, John [8] in the United Arab Emirate who reported 84% adherence to anti-diabetic medication.
Proteinuria signifies evidence of glomerular deterioration and may be viewed as a measure of the severity of diabetic glomerulopathy [22, 23]. In the current study, 3.33% of the respondents presented with proteinuria. Though not statistically significant (p = 0.1698), none of the five persons presenting with proteinuria had achieved glycaemic control by their current plasma glucose levels. This finding compares with prevalence of proteinuria among diabetics in the work of Haryandini and Rostini [24] (4.8%), but was lower to the finding of other Ghanaian studies reported by Eghan, Frempong [15] (43%), Brenyah, Ephraim [16] (30.8%) and Ephraim, Arthur [14] (26%). Local injury to vascular smooth muscle cells and endothelial cells may increase vascular permeability in the kidney, and the mechanisms cited for excessive protein excretion includes increased glomerular filtration, inadequate tubular absorption, overflow, and increased tubular secretion [22].
The prevalence of glycosuria was 10.67% among the total study population, 17.07% among the female and 8.26% among the male (Table 4). The appearance of glycosuria in diabetic patients is due to the impairment of renal tubular function [25]. Glycosuria among this study population was significantly associated with plasma glycaemic control (p = 0.0216), with 15(93.75%) of persons presenting with glycosuria having their current plasma glucose concentration above the optimal upper level of 7 mmol/L. Using the receiver operator characteristics analysis on respondents’ current plasma glucose concentration, we sought to determine the plasma glycaemic threshold cutoff values at which glucose was voided into the urine [26]. The plasma glucose value >11.9 mmol/L was the estimated glycaemic threshold for glycosuria among the study population (Table 5).
| Parameter | Cutoff | AUC | p-value | Sensitivity | Specificity |
|---|---|---|---|---|---|
| Total Respondent | >11.9 | 0.882 | <0.0001 | 93.75 | 85.71 |
| Male | >11.1 | 0.828 | 0.0065 | 85.71 | 85.29 |
| Female | >11.9 | 0.925 | <0.0001 | 100 | 85.86 |
Only one-third of the study population 50(33.33%) had their plasma glucose level controlled (Table 4). This finding compared favourably with that of Mobula in five hospitals in Ghana [17] (30%), Titty [27] in Tamale (40%), Chinenye, Uloko [28] in Nigeria (32.4%) and Musenge, Manankov [29] in Zambia (38.7%), but higher than that of Kamuhabwa and Charles [30] in Tanzania (23.9%) and BeLue, Ndiaye [31] in Senegal (24.8%). The principal goal of diabetes management is to achieve a targeted level of glycaemia, and anti-diabetic medications play an integral role in the glycaemic control and the prevention of microvascular complications in patients [8, 11].
Though not statistically significant, percentage glycaemic control and controlled blood pressure were found to be higher among the medication adherent group, whiles glycosuria and proteinuria were highest among participants presenting with low medication adherence (Fig. 1 & 2). Blood glucose levels among diabetics have been found to be associated with medication adherence [32]. Thus the current findings may lend credence to the earlier assertion that, strict adherence to medications is necessary to achieving therapeutic goals [1, 7, 8].
The consecutive fasting blood glucose measurement provides a valid end point assessment of patients glycaemia, glycated haemoglobin (HbA1c) measurement though not readily available in our setting, remains the standard assessment biomarker for glycaemic control [18, 33], especially in settings like the study area, where patients may increase efforts to have their blood glucose controlled few days before hospital visits. Thus the use of fasting blood glucose maybe a limiting factor revealing the true glycaemic picture of participants.
CONCLUSION
In this group of patients living with diabetes in the Ho Municipality, high level of uncontrolled glycaemia and uncontrolled blood pressure exist. However, these two treatment outcomes may be modulated by optimal medication adherence. Patient counseling to attain optimal medication adherence should, therefore, be intensified.
ETHICS APPROVAL AND CONSENT TO PARTICIPATE
Ethical Clearance for the study was granted by the Ethical Review and Scientific Committee of the School of Allied Health Sciences of the University of Health and Allied Sciences, Ho (UHAS-SAHS-ERSC:0016A/2017).
HUMAN AND ANIMAL RIGHTS
No Animals were used in this research. All human research procedures followed were in accordance with the ethical standards of the committee responsible for human experimentation (institutional and national), and with the Helsinki Declaration of 1975, as revised in 2013.
CONSENT FOR PUBLICATION
Participants consented to be part of the study after the procedure was clearly explained to them in the common language they understood (English, Ewe or Twi). Permission to conduct the study at the facility was obtained from the management of the Ho Municipal Hospital. Confidentiality of participant’s data was ensured, and analysis of data was anonymous and non-linked
AUTHORS’ CONTRIBUTIONS
This work was carried out in collaboration between all authors. All authors have read and reviewed the content of the final manuscript and have approved the manuscript for submission.
CONFLICT OF INTEREST
The authors declare no conflict of interest, financial or otherwise.
FUNDING
The project was fully funded by the authors with no external funding.
ACKNOWLEDGEMENTS
Declared none.

