All published articles of this journal are available on ScienceDirect.
Human Health Risk Assessment Under Uncertain Environment and Its SWOT Analysis
Abstract
Introduction:
Due to release of pollutants, chemical or hazardous materials into the environment from manmade or artificial sources, human being as well as animal populations are affected directly or indirectly through inhalation of air, intake of water, intake of food, dermal contact, etc. Then, human being may suffer from types of health effect such as acute radiation sickness, cancer, teratogenic (fetal) damage, hereditary changes, etc.
Methods:
When harmful materials are discharged into the environment, an assessment is essential to evaluate possible brunt these materials may have on individual health and environment. The basic objective of evaluation of risk is to gauge the severity and possibility of impairment to individual health as of exposure to a substance or bustle can cause impairment to individual health under credible situation. One of the most important aspects of risk assessment is to accumulate knowledge on the features of each and every available data, information and component of the risk model. It has been observed that most frequently model parameters such as, data and information are infected with uncertainty due to lack of precision, deficiency in data, diminutive sample sizes or data acquire from specialist opinion of existing data/information. In such situations, more often Fuzzy Set Theory (FST) is explored to characterize uncertainty.
Results and Conclusions:
Possibility theory enables transforming fuzzy variable into necessity measure and possibility measure that can be used to model uncertainty as well as to carry out risk assessment. Similarly, the emerging development of credibility theory can be considered as one of the uncertainty modelling tools that also has the ability to transform fuzzy variable into credibility distribution function. Therefore, this paper aims to make a comparative study among all the three uncertainty modelling tools to carry out human health risk assessment under uncertain environment. Computer codes have been generated for this purpose using Matlab M-files. Finally, SWOT analysis of health risk assessment has been carried out.
As the proposed tools have the ability to handle uncertainty/imprecision in a proper comportment and therefore, it can be opined that the proposed tools can be efficiently employed in every field where uncertainty/imprecision is involved such as clinical/medical decision making, economics, industrial cost-benefit analysis, other decision making process, etc.
1. INTRODUCTION
It is well known that human beings are often indirectly or directly affected by hazardous substances released from different manmade or artificial sources of radiation/imitation and as a consequence people living in the vicinity of the sources may suffer from different types of diseases. Hence, an assessment is essential to evaluate possible brunt these materials may have on individual health and environment. In risk evaluation process, it is always most important to accrue knowledge on the features of each and every existing data, information and component of the risk model. It is observed that most frequently existing data/ information is construed in probabilistic intellect because it is an extremely well-built and well instituted mathematical apparatus to treat uncertainty (aleatory) that occurs because of intrinsic inconsistency, innate stochasticity, discrepancy across space/time, random nature of usual processes. That is, if we have enough data, then probability theory can be used as an uncertainty modeling tool. But, it is understandable that not each and every existing data, information and component of the risk model are influenced by the aleatory uncertainty and so can’t be handled by conventional probability theory. But, model parameters may be fouled with epistemic uncertainty that by reason of lack of precision, deficiency in data, diminutive sample sizes or data acquire from specialist opinion of existing data/information. In such situations, conventional theory of probability is improper to characterize this type of uncertainty. To get rid of the drawback of probabilistic intellect, in 1965 L.A Zadeh commenced a novel notion viz., FST [1]. FST is apposite to characterize epistemic uncertainty,that is defined as a set of elements with degree of membership instead of characteristic values i.e., precisely assigns a real value from Figs. (1, 2) as an indication of their degree of truthfulness and it delineates the degree of involvement of an recognizable element in the set.
For example, we can consider the parameters of non-cancer health risk assessment model such as Body Weight (BW), Average Time (AT), Fish Ingestion Rate (FIR), etc. Due to different constraints such as temporal, spatial, financial, etc. it may not be always possible to obtain precise or complete data about those parameters Body Weight (BW), Average Time (AT), Fish Ingestion Rate (FIR) of risk models. Therefore, fuzzy set can be employed to represent those uncertain parameters. For example, say, for the parameter Body Weight (BW), from the available data it was found that the average Body Weight (BW) of the population under consideration is around 70kg. In such situation, BW can be expressed by a fuzzy set representing the concept “around 70kg” that is depicted in Fig. (1).
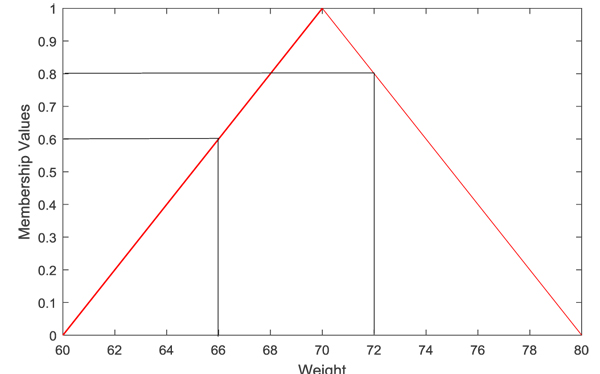
This means, in the population under consideration maximum possible weight is 70kg with a range 60kg to 80kg. That is, weights other than 70kg are also there with less degree of possibility, i.e., degree of possibility of 66kg is 0.6 while 72kg is 0.8. Similarly, other uncertain parameters can be represented by fuzzy sets.
Normally, Triangular Fuzzy Numbers (TFNs) or Trapezoidal Fuzzy Numbers (TrFNs) are extensively deliberated to embody epistemic uncertainty. However, in real world situations, there are some applications where little bit more data are available then bell-shaped fuzzy numbers may occur to characterize epistemic uncertainty. If all the uncertain model parameters (epistemic uncertainty) are represented by fuzzy set (number), then these fuzzy numbers can be transformed to credibility distribution functions as well as necessity & possibility measures respectively. Hence, health risk assessment can be carried out using the three approaches when input uncertain parameters are fuzzy in nature and accordingly a comparison can be made.
1.1. Problem Statements and Motivations
In health risk assessment, input model parameters are often tainted with epistemic uncertainty due to the lack of proper data and therefore, more often such uncertain components can be represented by Fuzzy Numbers (FNs). Furthermore, if we have little bit more data then representation of uncertain parameters may be Bell-shaped Fuzzy Numbers (BFNs) viz., Gaussian Fuzzy Number (GFN), Cauchy Fuzzy Number (CFN) etc. When both types of fuzzy numbers occur in the health risk evaluation model it is difficult to perform risk assessment using traditional approach. On the other hand, though FNs can be transformed to credibility distribution functions as well as necessity & possibility measures, but yet risk assessment is not smoothly carried out using credibility distribution functions or necessity & possibility measures to make comparative study. Also no SWOT analysis in health risk assessment is seen in literature. This motivates us to perform risk assessment in terms of optimistic and pessimistic point of view.
1.2. Objectives
The main objectives of this article are:
- To make a maiden effort to perform human health risk assessment when input model parameters are FNs of different shapes.
- To evaluate health risk and simultaneously make a comparison among the three approaches in terms of optimistic and pessimistic point of view all the three tools viz., fuzzy, possibility theory and credibility theory are used.
- To carryout SWOT analysis. A SWOT analysis is a prearranged setting up technique used to determine the strengths, weaknesses, opportunities and threats.
This present article is systematized as follows: Section 1 is the introductory one discussing problem statement, purpose of the research and objectives. Section 2 describes a thorough literature review of applications of fuzzy sets in risk analysis. Section 3 discusses the preliminaries and the related concepts. Section 4 discusses sampling techniques for possibility and credibility distributions. Section 5 refers to methodology. Section 6 describes the hypothetical case study. Section 7 discusses results and discussion. Section 8 discusses SWOT analysis of this study. Section 9 presents conclusions of the work done.
2. RELATED WORKS
After the development of FST, various researches have studied the issue and applied fuzzy sets in risk analysis [2-15], in reliability analysis [16], fault diagnosis [17, 18], risk assessment [19-27].
3. UNCERTAINTY MODELING APPROACHES
Uncertainty is an essential as well as inescapable ingredient of the evaluation of risk. Depending on the features and accessibility of data, uncertainty could be modelled via type-I or interval valued fuzzy set and Credibility theory and possibility theory.
3.1. Fuzzy Set Theory
FST presents a technique to illustrate the inaccurately described variables, associations between variables via specialist individual understanding and make use of them to evaluate results. Essential definitions and concept of FST [1, 20] are given in this section.
3.1.1. Definition: A FS A on the universe X can be described by its Membership Function (MF)
 |
that allots a real number µA in the interval [0, 1], to each element x  A. The value of ( x ) at x shows the degree of membership of x in A.
3.1.3. Definition: A GFN is denoted as Gauss([m1, m2]) whose MF is defined as [19]
 |
Where m1 represents the MF’s centre and m2 determines the MF’s width.
3.1.4. Definition: A CFN is denoted as whose MF is defined as [21]
 |
Where p represents the MF’s centre and q determines the Membership Function’s width.
3.2. Possibility Theory
A function defined on the real line  to [0,1] which is, unimodal and upper semi-continuous is called a possibility distribution π. It speaks the more or less plausible values of uncertain variable. Also, it can be expressed by two evaluations: possibility ∏ and the necessity N which can be defined as [28, 29]
 |
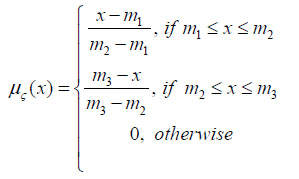
Let consider a TFN A = [m1, m2, m3]. The explicit form of the MF of A is
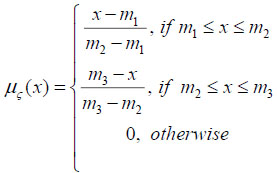 |
The explicit form for the possibility measure of the FN A can be expressed as:
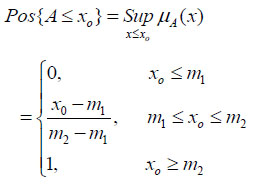 |
Again, the explicit form for the necessity measure of the FN A can be expressed as:
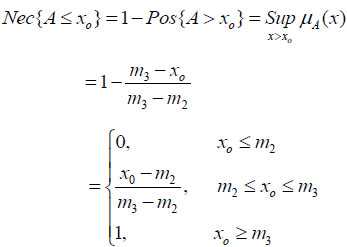 |
Similarly, for the GFN A = Gauss([m1, m2]) whose MF is
 |
The explicit form for the possibility measure and necessity measure of the GFN A can be expressed respectively as:
 |
In the same way, for the CFN is denoted as Gauss([p, q]) whose MF is defined as
 |
The explicit form for the possibility measure and necessity measure of the CFN A can be expressed respectively as:
 |
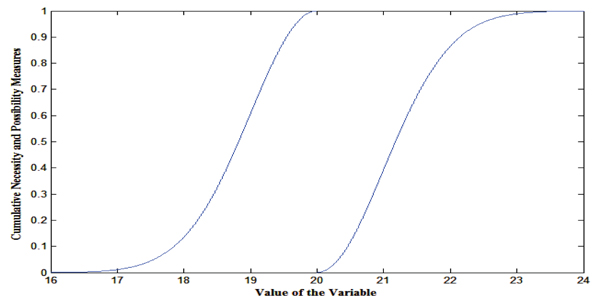
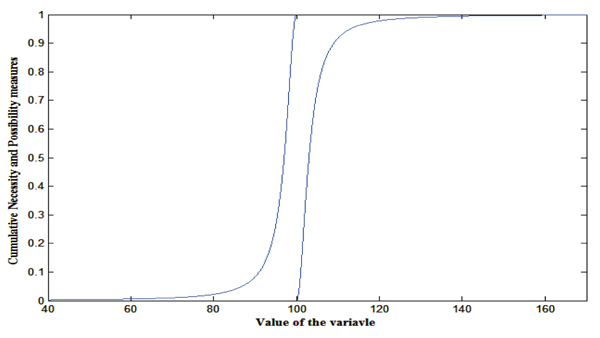
In particular, suppose A = [10, 20, 30], B = Gauss (20,1), C= Cauchy(100,3) are TFN, GFN and CFN. Their graphical representation for the possibility (Pos) and necessity (Nec) measure can be depicted in the following Figs. (2-4).

3.3. Credibility Theory
Definition [30] Let Θ be a non-empty set, and P the power set of Θ, and Pos a function from P to the set of real numbers. Then Pos is called possibility measure if it satisfies the following three axioms
1.Pos(Θ) = 1
2.Pos(Ø ) = 0
3.Pos( Ai ) = supiPos {A} for any events {Ai}.
Furthermore, the triplet (Θ, P, Pos) is known as the possibility space.
Definition [31] Let Θ be a non empty set, and P the power set of Θ and A  P. The credibility measure is defined as
 |
Furthermore, for any A  P for any we have
Pos{A} = min( 2Cr,1)
The triplet (Θ, P, Cr) is called as credibility space if Cr, called the credibility measure, a non–negative set function holds the following [32]
Cr{Θ} =1
Cr{A} ≤ Cr{B} for whenever A B,
B,
Cr{A} + Cr{Ac} = 1 for any A
Cr{Ai} = supiCr{Ai} for any events {Ai} with supiCr{Ai} < 0.5
Definition [30] A fuzzy variable is defined as a function from a credibility space (Θ, P, Cr) to the set of real numbers.
Let ς be a fuzzy variable defined on the credibility space (Θ, P, Cr). Then its membership function defined from the credibility measure is given by
µς (x) = min(2Cr{ς = x},1); x  R
R
Definition [31] defined credibility distribution as
ϕς: R→ [0, 1] of a fuzzy variable ς as
ϕς (x) = Cr{θ : ς(θ)≤ x}
That is the credibility that the fuzzy variable ς takes a value less than or equal to x.If the fuzzy variable ς is given by a membership function µ, it its credibility distribution is determined by
 |
Definition [30] The credibility defined as ϕς: R→ [0, ∞] of any fuzzy variable is a function such that
 |
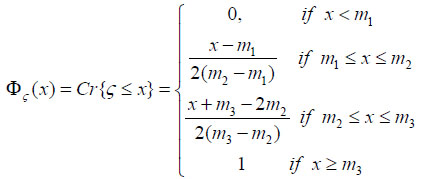
Let ς be a fuzzy variable defined by the triplet ς = (m1, m2, m3) of the crisp number with (m1< m2< m3); then the membership function can be defined as
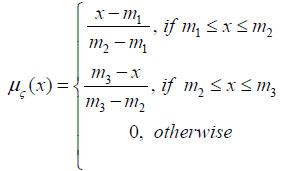 |
The credibility distribution function of fuzzy number ς can be obtained as
 |
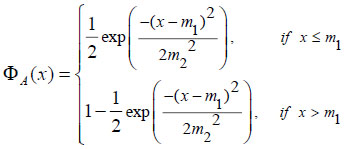
Similarly, for the GFN A= Gauss ([m1, m2]), the credibility distribution function can be obtained as
 |
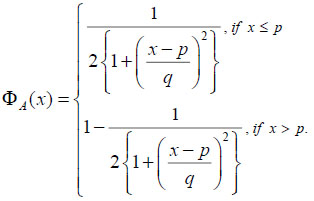
Also, the for the CFN Cauchy([p, q]), the credibility distribution function can be obtained as
 |
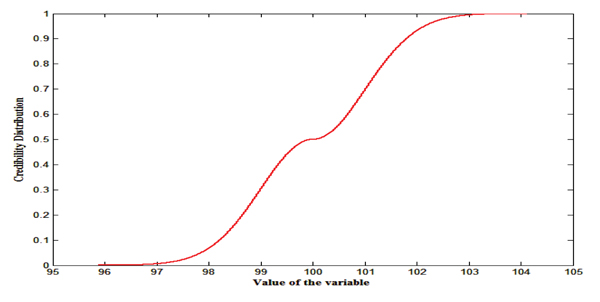
Then, for the fuzzy variables A= [10, 20, 40], B=Gauss([20, 1]) and C=Cauchy([100,3]), their corresponding credibility distributions are depicted in Figs. (5-7).


4. SAMPLING TECHNIQUES
Sampling techniques always play important role in fast computing. Similar to probabilistic intellect possibilic and credibility samplings can be executed.
Sampling technique for possibility theory is a commonly using sampling technique and easily available in literature, so we are not going to explain details and can be obtained in [33]. For the FN A= [10, 20, 30], the cumulative possibility and necessity measures can be constructed (Fig. 2). Then, using the possibilistic sampling for the uniformly generated random number say 0.6, the value of the random variable is 26 for the necessity measure and 16 for the possibility measure.
4.1. Sampling Technique for Credibility Theory
Like possibility sampling here too first needed to generate uniformly distributed random numbers from [0,1]. Then random numbers can be obtained by equating the generated random number to credibility distribution and one number is generated in this progression, corresponding to the credibility distribution (xc).
For the generated number u the uncertain value xc is obtained as
 |
For example, if Fig. (8) is the graphical representation of the credibility distribution of the fuzzy variable ς = (4,6,9) whose credibility distribution function is
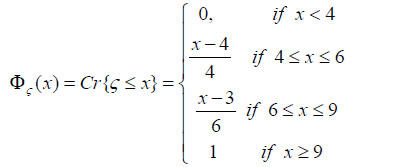 |
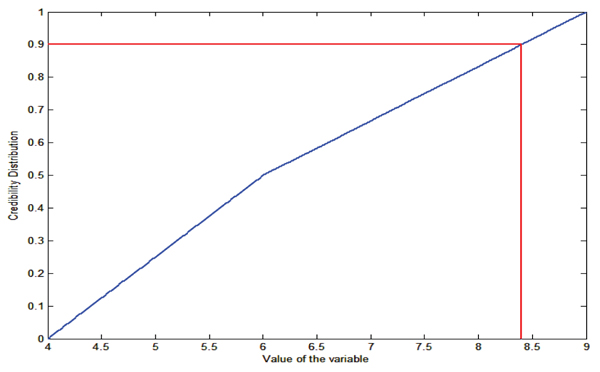
Then, for the uniformly distributed random number 0.90, using credibility sampling we have 8.4 is the values of the credibility distribution.
5. METHODOLOGY
In the evaluation of individual health risk, it is observed that most frequently epistemic uncertainty is associated with parameters of the risk assessment model. This uncertainty may occur due to lack of precision, deficiency in data, diminutive sample sizes or data acquire from specialist opinion or subjective construal of existing data or information. To deal with such types of uncertainty, Zadeh [1] commenced a new notion called fuzzy set theory which is defined as a set in which every element has certain degree of membership i.e., precisely assigns a real value from [0, 1] as an indication of their degree of truthfulness and it delineates the degree of involvement of an recognizable element in the set. Normally, TFNs or TrFNs are extensively deliberated to embody epistemic uncertainty. However, in real world situations, there are some applications where BFNs may occur to characterize epistemic uncertainty. If representations of uncertain model parameters are normal TFNs/TrFNs, then [34] approaches are sufficient to perform the model. But representations of model parameters by BFNs together with TFNs/TrFNs, make the computation complex. Since BFNs approach infinity on either side and for the purpose of simulation it is important to know minimum and maximum limit. For that, confidence intervals of BFNs can be evaluated, but at the same confidence interval of BFNs their corresponding alpha values are different which create difficulties in execution of the model. To overcome this complexity, we relax the convexity condition of the BFNs and TFNs/TrFNs by discretizing at 0.01 (i.e., membership functions of fuzzy numbers are defined on [0.01, 1]). No effect will be witness on the the uncertainty involved in the FNs. To perform the computation of risk, interval arithmetic is used [19-21].
On the other hand, possibility theory has the ability to handle uncertainty arises due to due to lack of precision, deficiency in data, diminutive sample sizes or data acquire from specialist opinion or subjective construal of existing data or information. If representations of model parameters are fuzzy numbers then cumulative necessity and possibility measures can be obtained (section 3.2) and accordingly risk assessment can be computed using sampling technique [19]. In this process, first need to consider all the input fuzzy numbers and convert them to cumulative necessity and possibility measures. In the next step, need to generate random numbers from [0, 1] and perform Monte Carlo simulation to obtain random numbers by sampling possibility distribution which will produce close intervals. Assigning all the closed intervals in the given risk model will generate a closed interval. Proceeding in this way for other uniformly distributed random numbers (say, N times), N numbers of closed intervals will be obtained. Plotting Cumulative Distribution Function (CDF) by considering all the initial points and end points of the closed intervals separately will produce a pair of cumulative necessity and possibility measures form which risk values can be evaluated at different fractiles.
The emerging development of credibility theory [30] can be considered as one of the uncertainty modelling tool that also has the ability to transform fuzzy variable into credibility distribution function. In this approach input fuzzy variables will be converted to credibility distributions (section 3.3). Here also, by generating random numbers between 0 to 1 and performing credibility simulation, resulting value of the variable can be evaluated. Assigning all the values in the model will produce a single value. Proceeding in this way for other uniformly distributed random numbers (say, N times), then N numbers of values will be obtained and plotting CDF will give a resultant credibility distribution from which risk values can be evaluated at different fractiles. Finally, comparison can be made among the risk values, obtained using the three approaches, in terms of optimistic and pessimistic point of view.
6. A HYPOTHETICAL CASE STUDY
In this segment, an attempt has been made to evaluate human health risk with hypothetical data. As it is well known that establishment of different kinds of industries is another source of environment pollution. Human as well as animal populations are exposed to the polluted environment by the following pathways [35]:
- Inhalation of Air
- Intake of Water
- Intake of Food
- Dermal Contact
Due to release of pollutants, chemical or hazardous materials into the environments from manmade or artificial sources [36], human being as well as animal populations are affected directly or indirectly. The pulp and paper industry pollutes our water, air, and soil. It releases toxic chemical such as chlorinated phenols, polycyclic aromatic hydrocarbons (PAHs), and VOCs which may disrupt hormone & generate carcinogenic problem. BC’s coastal pulp mills emit carcinogenic and hormone disrupting chemicals On the other hand, in oil industries, Workers risk exposure to a numerous chemicals, unhealthy materials. Radioactive waste can also be found in produced water, sludge and drilling mud. Produced water is underground water come out to the outside through the drilling process, along with the oil. It can be as much as 100 times more radioactive than water from a nuclear power plant. Produced Water (PW) is a noteworthy sources of waste produced in the manufacturing stage of oil and gas procedures [37]. Once released into the water or ocean, lots of heavy metals and other poly aromatic hydrocarbon are obtained in produced water which may initiate toxicity and bioaccumulation in aquatic living beings. These compounds may harmful to aquatic organisms such as fish and therefore intake of such contaminated fish may cause serious effects to human being. As a result, human being can directly or indirectly be affected by various above mentioned alleyways. Workers are exposed to the radium isotopes that are released from these wastes, raising their risk of cancer. The radon gas that's released during drilling also increases workers' risk of lung cancer.
Therefore, when harmful materials are discharged into the environment, an assessment is essential to evaluate possible brunt these materials may have on individual health and environment. For this purpose, evaluation of risk is performed to estimate dose and risk to humans from hazardous substances present in the environment. Basically, ingestion dose, inhalation dose, etc., received by the members of the public is computed using the standard dose assessment model. Model is a function of parameters. However, exact values of the parameters are not always known with precision. For example, the measured data for contamination of the food item carry a large amount of uncertainty, the specific food item from where it has been collected is not certain. Subsequently, the dose computed or assessed always carries an uncertainty and obviously this uncertainty is subjective in nature due to the human intervention. In this perspective, it is at most essential to carry out an assessment to establish the potential impact such substances may have on human being and in the environment when harmful stuffs are discharged into the atmosphere. For this intention, a non cancer health risk assessment is executed to gauge the possible harm to human being.
Although numerous organic and inorganic pollutants exist in PW, instead of considering all the contaminants exist in PW, the heavy metal arsenic (As) is considered for its toxicity and high concentration in PW.
6.1. Non-Cancer Human Health Risk Assessment Model
The well validated general risk evaluation model is [38]:
 |
The required non-cancer risk model for ingestion of fish is:
 |
Abbreviation of terms of the model and their full name are given in the (Table 1).
| S. No. | Abbreviation | Full Form |
|---|---|---|
| 1. | CDI | Chronic daily intake (mg / kg - day) |
| 2. | FIR | Fish ingestion rate (g / day) |
| 3. | FR | Fraction of fish from contaminated source |
| 4. | EF | / Exposure frequency day year (day year) |
| 5. | ED | Exposure duration ( years) |
| 6. | CF | Conversion factor (=10-9) |
| 7. | BW | Body weight (kg) |
| 8. | AT | Averaging time (days) |
| 9. | Cf | Chemical concentration of fish tissue (mg / kg) |
| 10 | PEC | Predicted environmental concentration (mg / l) |
| 11. | BCF | Chemical bioaccumulation factor in fish (l / kg) |
| 12. | Rfd | Reference dose |
A hypothetical case study is being carried out in which three scenarios are considered to perform the non cancer health risk assessment.
6.2. Uncertainty in the Input Parameters
Due to imprecision or lack of data on the population under consideration BW is taken as fuzzy set. Due to lack of clear evidence about the duration over which the Exposure (ED) on population has been taken place and therefore, ED can be represented by fuzzy set. Similarly, Exposure Frequency (EF) over the year is not clearly known and hence it can be taken to be a fuzzy set. Also, Fish Intake Rate per day (FIR) by a individual is no way precisely known and therefore, it can be expressed by a fuzzy set. Similarly, uncertainty/imprecision are involved in the other parameters such as PEC and BCF that can also be represented by fuzzy set. The epoch over which exposure is Average (AT) is taken as deterministic (i.e., able to exactly evaluate the AT). Similarly, FR, CF and Rfd are taken as deterministic.
6.3. Scenario-I
In this scenario, due to imprecision consideration BW is taken as fuzzy set around 70kg and ranges over 60kg to 80kg. Due to lack of clear evidence about the duration of exposure (ED) and therefore, it is taken as fuzzy set around 30 years with range is [20, 40] years. Again, exposure frequency (EF) over the year is not clearly known and hence it can be taken to be a fuzzy set [340,350,360]. Also, Fish Intake Rate per day (FIR) by an individual is not precisely known and therefore, it is taken as fuzzy set . Similarly, PEC and BCF are taken as fuzzy sets respectively. Remaining parameters are taken as constant. Required data for the risk assessment are given in Table (2).
| Parameter | Units | Type | Value/distribution |
|---|---|---|---|
| AT | Days | Constant | 25550 |
| BW | Kg | Fuzzy | [60,70,80] |
| ED | Years | Fuzzy | [20,30,40] |
| EF | Days/year | Fuzzy | [340,350,360] |
| FR | - | Constant | 0.5 |
| FIR | g / day | Fuzzy | [160,170,180] |
| CF | - | Constant | 1 x 10⁻⁹ |
| PEC for As | µ g/l | Fuzzy | [1,5,9] |
| BCF for As | l / kg | Fuzzy | [30, 45, 60] |
| Oral Rfd for As | mg / (kg.day) | Constant | 3 x 10⁻⁴ |
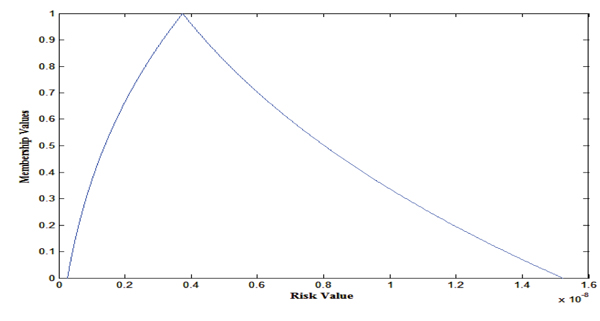
When uncertain input parameters are fuzzy numbers approaches in [34] can be used to evaluate health risk model. The resultant is obtained as a FN around 3.743 x 10⁻⁹ and ranges over 2.661 x 10⁻¹⁰ to 1.522 x 10⁻⁸ whose graphical representation is depicted in Fig. (9). Here, 3.743 x 10⁻⁹ is most possible risk value whiles other risk values in [2.661 x 10⁻¹⁰ , 1.522 x 10⁻⁸ ] have less degree of possibility details calculations are given in Table (5).
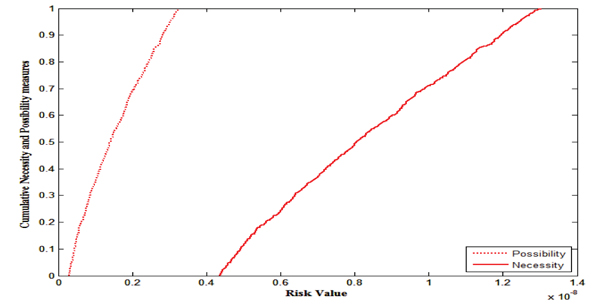
Then, the FNs are transformed to cumulative necessity and possibility measures (section 3.2). Accordingly non cancer human health risk assessment model can be computed using sampling technique [19] which will be obtained in the form of cumulative necessity and possibility measures and depicted in Fig. (10). From this cumulative necessity and possibility measures risk value can be evaluated at different fractiles and which is obtained in the form of a possible range of risk values. For example, at 95th fractile, the range of risk values is [3.028 x 10⁻⁹ , 1.243 x 10⁻⁸]. Other risk value at different fractiles can be evaluated details calculations are given in Table (5).
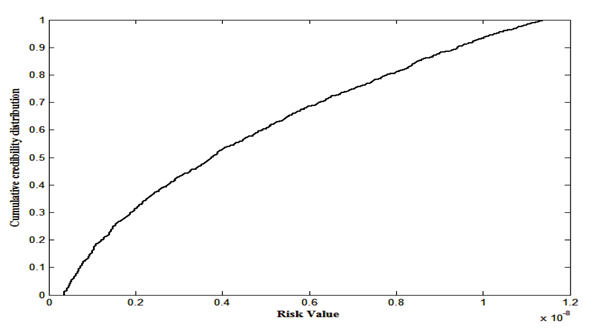
Credibility theory by can be considered as one of the uncertainty modelling tool that also has the ability to transform fuzzy variable into credibility distribution function. In this approach input fuzzy variables will be converted to credibility distributions (section 3.3). Human health risk can be evaluated using credibility simulation technique. Resulting risk is obtained as single credibility distribution and given in Fig. (11). For example, at 95th fractile, the risk value is 1.03 x 10⁻⁸. Here also other risk value at different fractiles can be evaluated details calculations are given in Table (5).
6.4. Scenario-II
Here also due to some constraints data are not precisely known and as a consequence the model parameters BW, EF, and PEC are considered as CFNs while ED, FIR, and BCF are taken as GFNs. Other parameters remain kept constant. Required data for the calculation of non-cancer human health risk assessment are given in the Table (3).
| Parameter | Units | Type | Value/distribution |
|---|---|---|---|
| AT | Days | Constant | 25550 |
| BW | Kg | Fuzzy | Cauchy ([70, 0.65]) |
| ED | Years | Fuzzy | Gauss ([30,3.3]) |
| EF | Days/year | Fuzzy | Cauchy ([350,1]) |
| FR | - | Constant | 0.5 |
| FIR | g/day | Fuzzy | Gauss ([170, 2.5]) |
| CF | - | Constant | 1x10⁻⁹ |
| PEC for As | µ g/l | Fuzzy | Cauchy([5, 0.1]) |
| BCF for As | l/kg | Fuzzy | Gauss(45,2) |
| Oral Rfd for As | mg / (kg.day) | Constant | 3x10⁻⁴ |
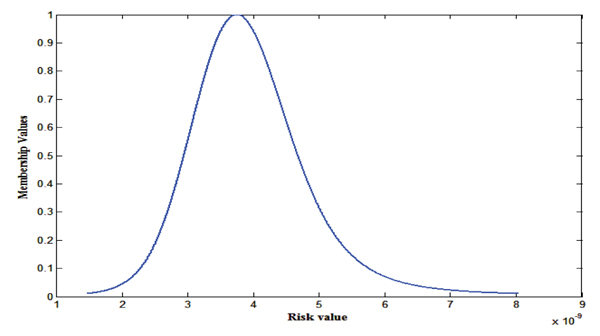
As representation of uncertain model components are BFNs which approach infinity on either side and for the purpose of simulation it is important to know minimum and maximum limit. For that, confidence intervals of Bell-Shaped Fuzzy numbers can be evaluated, but at the same confidence interval of Bell-Shaped Fuzzy numbers, their corresponding alpha values are different which create difficulties in execution of the model. To overcome this complexity, we relax the convexity condition of the BFNs by discretizing at 0.01 (i.e., membership functions of fuzzy numbers are defined on [0.01,1]). It will no way hamper the uncertainty involved in the system. To perform the computation of risk, interval arithmetic can be used [20]. The resultant risk value is a fuzzy number around 3.743 x 10⁻⁹ with the range [1.468 x 10⁻⁹ , 8.041 x 10⁻⁹ ]. It can be interpreted as that 3.743 10-9 is the most possible risk value while [1.468 10-9 , 8.041 10-9] has less degree of possibility. Graphical representation is depicted in the Fig. (12).
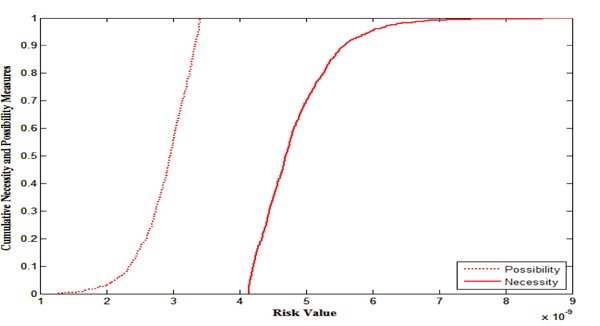
Next, the BFNs input model parameters are converted into cumulative necessity and possibility measures (section 3.2) and risk value has been evaluated, depicted in the Fig. (13). Here, risk values are obtained in interval at different fractiles. For example, at 95th fractile, the risk value is [3.375 x 10⁻⁹ , 5.955 x 10⁻⁹]. Other risk values at different fractiles can be obtained and given in Table (5).
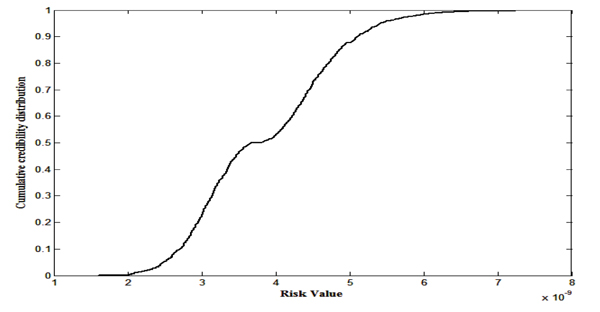
Using credibility simulation for credibility distribution health risk is evaluated in which credibility distributions are obtained by transforming fuzzy variables and same is depicted in Fig. (14). At 95th fractile risk value is 5.9485 x 10⁻⁹ and accordingly other risk values at different fractiles can be obtained and given in Table (5).
6.5. Scenario-III
At this juncture, representation of the uncertain parameters ED, EF and BCF are taken as BFNs while other uncertain parameters BW, FIR and PEC are TFNs respectively. Other parameters remain kept constant. Required for the calculation of non-cancer human health risk assessment are given in the Table (4).
| Parameter | Units | Type | Value/distribution |
|---|---|---|---|
| AT | Days | Constant | 25550 |
| BW | Kg | Fuzzy | [60, 70, 80] |
| ED | Years | Fuzzy | Gauss ([30,3.3]) |
| EF | Days/year | Fuzzy | Cauchy ([350,1]) |
| FR | - | Constant | 0.5 |
| FIR | g/day | Fuzzy | [160,170,180] |
| CF | - | Constant | 1x10⁻⁹ |
| PEC for As | µ g/l | Fuzzy | [1,5,9] |
| BCF for As | l/kg | Fuzzy | Gauss(45,2) |
| Oral Rfd for As | mg / (kg.day) | Constant | 3x10⁻⁴ |
Since some uncertain model parameters are BFNs and some others are TFNs, for computation of risk, interval arithmetic can be used [19, 21]. The resultant risk value is a fuzzy number around 3.743 x 10⁻⁹ which ranges over [3.596 x 10⁻¹⁰ , 1.287 x 10⁻⁸] and it is depicted in the Fig. (15).
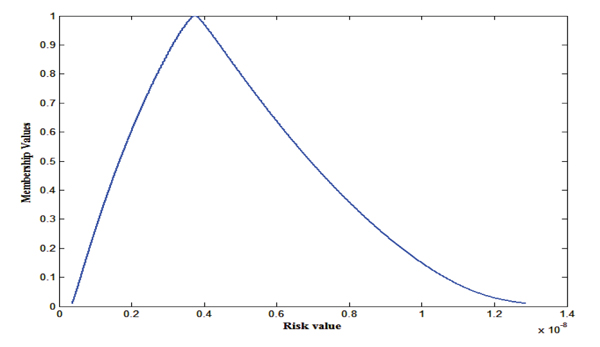
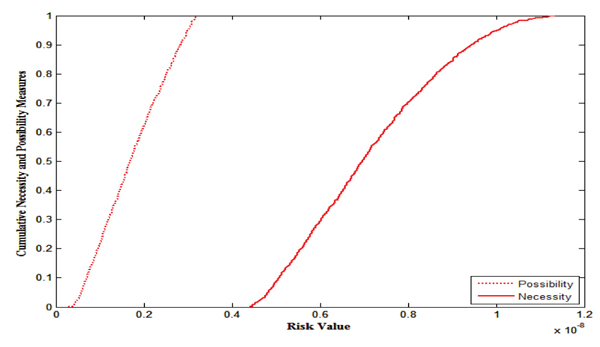
The BFNs and TFNs input model parameters are transformed into cumulative necessity and possibility measures (section 3.2) and risk values have been evaluated using Monte Carlo simulation which is depicted in the Fig. (16). Risk values at different fractiles are given in Table (5).
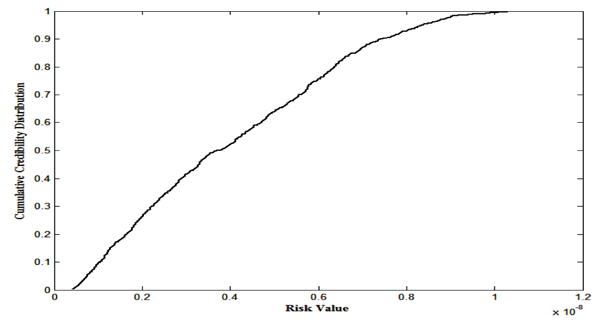
Using credibility simulation for credibility distribution health risk is evaluated in which credibility distributions are obtained by transforming fuzzy variables and the same is depicted in Fig. (17). Risk values for different fractiles are depicted in Table (5).
7. RESULTS AND DISCUSSIONS
Usually the majority of health risk evaluation problem engages treating with uncertainties. Therefore, we should be attentive of all such kind of uncertainties and attempt to include all the necessary information into the investigation. In this study, three different scenarios are taken to perform risk investigations. All uncertain data are hypothetical. In the scenario-I, the model parameters BW, ED, EF, FIR, PEC and BCF are taken as triangular fuzzy number due to lack of information about the data. In scenario-II, same uncertain model parameters are considered as BFNs. In scenario-III, some uncertain parameters are taken as GFNs while some are CFNs. Then, risk has been evaluated through the approaches described above (methodology section) and that are summarized in the following Table (5).
| Scenario-I | Nature | Risk Value | |||||
| Fuzzy | [2.661e-10, 3.743e-09, 1.522e-08] | ||||||
| Possibility | Fractiles | ||||||
| 95th | 85th | 65th | 45th | 25th | 15th | ||
| [3.028e-09, 1.243e-08] | [2.599e-09, 1.132e-08] | [1.87e-09, 9.391e-09] | [1.262e-09, 7.63e-09] | [7.609e-10, 6.057e-09] | [5.247e-10, 5.208e-09] | ||
| Credibility | 1.03e-08 | 8.524e-09 | 5.531e-09 | 3.25e-09 | 1.508e-09 | 9.766e-10 | |
| Scenario-II | Fuzzy | [1.468e-09, 3.743e-09, 8.041e-09] | |||||
| Possibility | Fractiles | ||||||
| 95th | 85th | 65th | 45th | 25th | 15th | ||
| [3.375e-09, 5.955e-09] | [3.282e-09, 5.378e-09] | [3.088e-09, 4.903e-09] | [2.916e-09, 4.642e-09] | [2.676e-09, 4.398e-09] | [2.465e-09, 4.253e-09] | ||
| Credibility | 5.485e-09 | 4.926e-09 | 4.334e-09 | 3.435e-09 | 2.996e-09 | 2.791e-09 | |
| Scenario-III | Fuzzy | [3.596e-10, 3.743e-09, 1.287e-08] | |||||
| Possibility | Fractiles | ||||||
| 95th | 85th | 65th | 45th | 25th | 15th | ||
| [3.015e-09, 1.005e-08] | [2.68e-09, 9.022e-09] | [2.073e-09, 7.706e-09] | [1.579e-09, 6.745e-09] | [1.073e-09, 5.788e-09] | [8.301e-10, 5.322e-09] | ||
| Credibility | 8.378e-09 | 6.854e-09 | 5.102e-09 | 3.284e-09 | 1.923e-09 | 1.284e-09 | |
| Note: ne-m is read as nx10-m. For example, 3e-04 is read as 3x10⁻⁴ | |||||||
In scenario-I, the output risk is a fuzzy number when input uncertain model parameters are fuzzy numbers due to lack of data and the risk value is around 3.743e-09 and range of risk is [2.661e-10, 1.522e-08]. That can also be interpreted in optimistic point of view that the human health risk is 3.743e-09, while from pessimistic point of view the same is [2.661e-10, 1.522e-08]. When fuzzy input parameters are converted to possibility distribution, the result risk is obtained in the form of closed interval. For example, at 95th, 85th, 65th, 45th, 25th and 15th fractiles, the risk is estimated as [3.028e-09, 1.243e-08], [2.599e-09, 1.132e-08], [1.87e-09, 9.391e-09], [1.262e-09, 7.63e-09], [7.609e-10, 6.057e-09] and [5.247e-10, 5.208e-09] respectively which can be reported from pessimistic point of view. In addition, for individual health risk, possibility measure can be deliberated from optimistic point of view while necessity measure can be contemplated from pessimistic point of view. On the other hand, when fuzzy input parameters are transformed to credibility distribution, the result risk is evaluated at 95th, 85th, 65th, 45th, 25th and 15th fractiles which are 1.03e-08, 8.524e-09, 5.531e-09, 3.25e-09, 1.508e-09 & 9.766e-10 respectively which can be interpreted of as the decisive factor of optimistic choice architects.
Similarly, in scenario-II, in the fuzzy environment, the risk value from optimistic decision maker’s point of view is 3.743e-09 and pessimistic point of view, the risk value is [1.468e-09, 8.041e-09]. In the pessimistic sense, the risk values at 95th, 85th, 65th, 45th, 25th and 15th fractiles are [3.375e-09, 5.955e-09], [3.282e-09, 5.378e-09], [3.088e-09, 4.903e-09], [2.916e-09, 4.642e-09], [2.676e-09, 4.398e-09] and [2.465e-09, 4.253e-09] respectively. For credibility distribution, resultant risk at 95th, 85th, 65th, 45th, 25th and 15th fractiles are 5.485e-09, 4.926e-09, 4.334e-09, 3.435e-09, 2.996e-09 and 2.791e-09 respectively.
In scenario-III, in the fuzzy environment, the risk value from optimistic decision maker’s point of view is 3.743e-09 and pessimistic point of view, the risk value is [3.596e-10, 1.287e-08]. In the pessimistic sense, the risk values at 95th, 85th, 65th, 45th, 25th and 15th fractiles are [3.015e-09, 1.005e-08], [2.68e-09, 9.022e-09], [2.073e-09, 7.706e-09], [1.579e-09, 6.745e-09], [1.073e-09, 5.788e-09] and [8.301e-10, 5.322e-09] respectively. For credibility distribution, resultant risk at 95th, 85th, 65th, 45th, 25th and 15th fractiles are 8.378e-09, 6.854e-09, 5.102e-09, 3.284e-09, 1.923e-09 and 1.284e-09 respectively.
8. SWOT ANALYSIS
A SWOT analysis is a planned setting up technique generally used to assess the Strengths, Weaknesses, Opportunities and Threats [39]. A SWOT analysis is an extensively used apparatus for analyzing internal and external environments in order to attain a systematic approach and support for decision situations [40]. When SWOTs are identified, strengths can be capitalized on, weaknesses minimized, and threats turned into opportunities [41]. A details SWOT analysis of health risk assessment is given in the Table (6).
| Strengths | Weaknesses |
|---|---|
| • It has the ability to represent imprecision, uncertainty of risk assessment model in its own way. • Application for wide range of hazardous materials. • Risk values can also be interpreted in terms of optimistic decision makers’ point of view. • Less financial cost for data collection • No additional effort required. • Readers’ friendly tools to understand. • Credibility distribution tool provides quite precise risk values. • Ability to define the range of risk values |
• Lack of data may leads to imprecise results • Two risk assessment techniques provide little bit imprecise values. • Under/over estimation of data. • Some parameters of risk model may overlook. • All tools have inherent limitations of their own. |
| Opportunities | Threats |
| • It provides assistance to scientists, environmentalists, experts to carry out health risk assessment providing better efficiency to the output. • It has more utility because of its ability to represent imprecision, uncertainty of risk assessment model in its own way. • People living in the locality of industries, nuclear power plant etc. from where radiation exposed will be benefited. • Although this study is carried out in non cancer risk assessment model, but it has the ability to use in any model where model parameters tainted with epistemic uncertainty. • All uncertainty modelling community of researchers can adopt these tools • Software module can be formulated for such types of study |
• Will accept the tools by scientists, environmentalists, experts? • Will the tools live up promise and results in deliverables? • Readers might get confronted with decision on acceptability of risk. |
CONCLUSION
The major contribution of this article is to present a way to perform health risk assessment using the uncertainty modeling tools. This paper presents three suitable algorithms and enables to successfully carry out risk assessment. The reason for choosing fuzzy numbers and converting to possibility as well as credibility distribution are the ability to address imprecision, uncertainty and vagueness in its own fashion that are involved in health risk assessment models. In this study, it is found that risk values are obtained imprecisely when input parameters are fuzzy nature as well as possibility & necessity nature. However, when input parameters are transformed into credibility distributions, it provides quite precise risk value at certain fractile. Therefore, it can be opined that the proposed tools can be employed in all the areas including clinical decision making/support if the model parameters [42-44] of the clinical decision supports are uncertain/imprecise and can be represented by fuzzy numbers.
In this study, the SWOT analysis provides a way to show the major strengths and opportunities. The tools have very limited weaknesses and that can be transformed into strengths by further study. Imprecision of the results can be précised by defuzzifying and by considering pessimistic view point. Imprecision or over/under estimation of data can also be handled by considering type-II fuzzy set in our future study. As a future extension of the work, similar kind of algorithms may be formulated to deal with such situations by taking type-II fuzzy sets.
Similar type of SWOT analysis can be made for other areas including clinical decision making/support systems.
ETHICS APPROVAL AND CONSENT TO PARTICIPATE
Not applicable
HUMAN AND ANIMAL RIGHTS
Not applicable.
CONSENT FOR PUBLICATION
Not applicable.
CONFLICT OF INTEREST
The authors declare no conflict of interest, financial or otherwise.
ACKNOWLEDGEMENTS
Declared none.

