All published articles of this journal are available on ScienceDirect.

Resampled Cox Proportional Hazards Models for Infant Mortality at the Kigali University Teaching Hospital
Abstract
Introduction:
Resampling technique as a way of overcoming instability in Cox Proportional hazard model is used for measuring the risk and related standard error for the infant mortality, given socio-economic and clinical covariates for mother and children at the Kigali University Teaching Hospital in Rwanda.
Methods:
Bootstrap and jackknife Cox proportional hazards models was applied to N=2117 newborn data collected in 2016 at the Kigali University Teaching Hospital in Rwanda.
Results:
The unadjusted models revealed significance of the age of female parents, information on previous abortion, gender of a newborn, number of newborns at a time, APGAR, the weight of a newborn and the circumference of the head of a newborn.
Conclusion:
Statistical analysis supports two major findings: 1) parents under 20 years of age indicate a relatively higher risk of infant death, and 2) abnormality in the newborn's head and weight indicates a relatively higher risk of infant mortality. Recommendations include avoidance of pregnancy until after age 20 and clinically recommended nutrition for the mother during pregnancy to decrease the risk of infant mortality.
1. INTRODUCTION
The resampling in Cox proportional hazards model consists of conducting the Cox Proportional Hazards Model (CPHM) on a given number of samples obtained after applying a relevant technique of resampling. The popular nonparametric techniques of resampling include bootstrap method which is based on random sampling with replacement [1], jackknife method which consists of making samples by leaving out one observation a time [1], and jackknife after bootstrap [2]. The interest in this study will be on Bootstrap Cox Proportional Hazards Model (BCPHM) and Jackknife Cox Proportional Hazards Model (JCPHM).
Hamada [3] points out the aim of using the resampling technique in CPHM. Firstly the resampling allows the assessment of the stability of the CPHM. The instability may be caused by the correlation of the covariates. Secondly, the resampling may be used when the sample size is relatively small. Model adequacy may be satisfied by selecting variables on which the model is stable rather than testing the proportionality of variables.
BCPHM and JCPHM have been extensively applied to different studies. In [4], bootstrap is applied for estimating the survival function and the hazard rate with respective standard errors. Belašková, Fišerová, and Krupicková [5] published a clinical study which used BCPHM with consideration of right censoring and delayed entries. The study of Belašková et al. adapted BCPHM due to the small sample size (N=61). Xu, Sen, and Ying [6] conducted the BCPHM with consideration of a change-point along the study time with right censored survival data. The study proved the consistency of the model by making a comparison with the model based on data simulation. The JCPHM was adopted by Xiao, Yao-Hua, and Dong-Sheng [7] together with a random weighting which consists of approximating the distribution of the maximum partial likelihood estimates in the CPHM [8-10]. Several other manuscripts also discussed the use of the resampled survival analysis including [11-17]. In this study, the BCPHM with 1000 bootstrap replicates and the JCPHM were used and compared to the CPHM in modeling the risk of infant death at the Kigali University teaching Hospital from 01-January-2016 to 31-December-2016. The study comprises five sections including the introduction presented in Section 1. Section 2 presents the methods of the study where mathematical formulation of bootstrap and jackknife are reviewed. Section 3 gives the main results. Section 4 discusses the results and Section 5 concludes the paper.
2. METHODOLOGY
2.1. Bootstrap Method
2.1.1. Bootstrap
Assume a sample
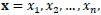 |
 are independent and identically distributed with distribution
 where
where
 is the statistical parameter of interest. Consider the distribution function
 of a random variable
 . The bootstrap method as described by Efron and Tibshirani [1], consists of generating
 |
where
 are random samples of size n drawn with replacement from the sample x. The varibles
are independent and identically distributed with distribution
are random samples of size n drawn with replacement from the sample x. The varibles
are independent and identically distributed with distribution
 given x;
is an estimator of
from x; B is a number of bootstrap samples (replications).
given x;
is an estimator of
from x; B is a number of bootstrap samples (replications).
2.1.2. Bootstrap Standard Error
Assume B bootstrap samples
 . Efron and Tibshirani [1] propose the estimated standard error of the bootstrap statistic of interest
 as:
as:
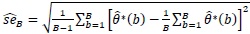 |
(1) |
where
*(b) is an estimate of the statistic of interest from the bth bootstrap sample, b=1,2, …, B.
2.1.3. Bootstrap Cox Proportional Hazard Model (BCPHM)
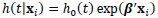
Assume a CPHM, h (t|xi) over the p fixed covariates with values
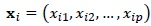 and the hazard function h0(t) when values of all covariates are zeros, that is
 |
(2) |
[18], where
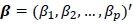 is a p-dimensional vector of model parameters.
Consider three approaches of approximating the partial likelihood in the presence of tied events namely Breslow [19] approximation of the partial likelihood function given by:
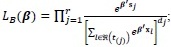 |
(3) |
Efron [20] approximation of the partial likelihood function is given by:
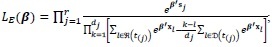 |
(4) |
and Cox [21] approximation of the partial likelihood function is given by:
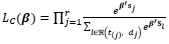 |
(5) |
where
 is the set of dj individuals drawn from the risk set
 at time t(j). The inference of model (2) based on bootstrap consists of applying model (2) to each of the B bootstrap samples
 of covariates
 . Bootstrap model parameter estimation uses either Breslow, Efron or Cox approach. The bootstrap standard error is obtained by using Equation (1).
2.2. Jackknife Method
2.2.1. Jackknife
Assume a sample
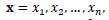 |
where
 are the values of the covariate x. Let
 be a statistic of interest. The jackknife samples consist of leaving out one observation at a time, that is n samples
 [1]. The jackknife standard error estimate as proposed [1], is given as:
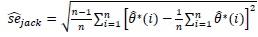 |
(6) |
where
 is a statistic of interest for the ith jackknife sample.
 [1, n] of covariates
 . Either Breslow, Efron or Cox approach is used for estimating the jackknife model parameters, with the standard error given by Eq (6).
2.3. Dataset
Table 1 describes the variables of interest and Table 2 summarises the dataset. The full dataset can be obtained from the authors of this article.
| Variable | Description | Codes/Values/Unit |
|---|---|---|
| Age | Age of parent | 0=under 20, 1=20 years old to 34 years old, 2=35 years old and above |
| Residence | Indicator of the residential area of a parent | 0=rural, 1=urban |
| Antecedents | Indicator on whether a new born is the first or not | 0=Not the first newborn, 1 = first newborn, |
| Abortion | Indicator on whether a parent aborted previously | 0=not aborted, 1=aborted once, 2= aborted more than once |
| Child birth | Type of child birth | 0=born using ventouse, 1=born naturally, 2= born after surgery |
| Gender | Gender of a newborn | 0=female, 1=male |
| Number | Indicator of the number of births at a time | 0=singleton, 1=multiple |
| APGAR | Score of appearance, pulse, grimaces, activity and respiration of a newborn | 0= APGAR less than 4/10, 1=APGAR from 4/10 to 6/10, 2=APGAR greater or equal to 7/10 |
| Weight | Weight of a newborn | 0 = under 2500 g, 1= 2500 g to 4500 g, 2= above 4500 g |
| Head | Head circumference of a newborn | 0= below 32 cm, 1=32 cm to 36 cm, 2=above 36 cm |
| Height | Height of a newborn | 0=below 46 cm, 1=46 cm to 54 cm, 2=above 54 cm |
| Time | Time from recruitment to study termination | Days |
| Event | Indicator describing if death occurred during the study time or not | 0=censored, 1=dead |
| n_events | Indicator on the rank of records per subject | 1=first record, 2=second record |
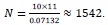
The time to event primary dataset of 2117 newborns at the Kigali University Teaching Hospital (KUTH) was recorded from 1st January to 31st December 2016. A complete case analysis is considered where the event is the death of the infant. Eighty-two babies died during the study time, 69 stillborn babies were recorded and 1966 babies were censored. Eleven covariates of interest are demographic covariates that include the age and the place of residence for parents; clinical covariates for parents include obstetric antecedents, type of childbirth and previous abortion. Clinical covariates for children include APGAR; gender, number of births at a time, weight, circumference of the head, and height. The minimum sample size according to Peduzzi et al. [22] is
 where k is the number of predictor variables and p is the number of events. This suggests the minimum sample size at KUTH as:
 |
| Total Observations | 2117 |
| Deaths during the study time | 82 (3.873%) |
| Stillborn babies | 69 (3.259%) |
| Total events | 151 (7.132 %) |
| Censored babies | 1966 (92.867%) |
3. RESULTS
STATA-15 displays the results in three tables: Table 3 presents estimates of unadjusted CPHM, BCPHM, JCPHM and corresponding adjusted models, by using Breslow estimation method. Both unadjusted and adjusted CPHM, BCPHM and JCPHM by Efron and Cox estimation are also presented in Tables 4 and 5. The results displayed by the jackknife model are relatively close to that of the Cox proportional hazards model (Table 3). The standard errors in JCPHM and CPHM are not critically different for all covariates except for the upper levels of covariates weight, head and height where the standard error in JCPHM is more than 40 times that of CPHM. The critical difference in standard error is also observed in BCPHM for the upper levels of covariates weight, head and height, for all levels of covariate childbirth and for the covariate number where the standard error is relatively higher in BCPHM. Also, BCPHM does not take age and number as significant covariates unlike the fact of JCPHM and CPHM where these covariates are included in significant covariates. Following suggestions in [23], the χ2 test statistics suggest a higher performance of the JCPHM as compared to the CPHM and BCPHM since the value of the χ2 is relatively everywhere lower for the JCPHM.
| CPHM | BCPHM | JCPHM | ||||||||||||||
|---|---|---|---|---|---|---|---|---|---|---|---|---|---|---|---|---|
| Covariate (Reference) | Level | HR | SE | z | P>z | 95% CI | HR | SE | z | P>z | 95% CI | HR | SE | z | P>z | 95% CI |
| Age (Under 20 years old) | 20 to 34 years old | 0.172 | 0.086 | -3.540 | p < 0.001 | [0.065; 0.456] | 0.172 | 0.254 | -1.190 | 0.234 | [0.009; 3.124] | 0.172 | 0.089 | -3.400 | 0.001 | [0.062; 0.475] |
| 35 years old and above | 0.216 | 0.117 | -2.840 | 0.005 | [0.075; 0.623] | 0.216 | 0.323 | -1.020 | 0.306 | [0.012; 4.058] | 0.216 | 0.124 | -2.660 | 0.008 | [0.070; 0.667] | |
| Residence (Rural) | Urban | 1.014 | 0.240 | 0.060 | 0.954 | [0.637; 1.614] | 1.014 | 0.277 | 0.050 | 0.960 | [0.594; 1.732] | 1.014 | 0.285 | 0.050 | 0.961 | [0.585; 1.758] |
| Antecedents (Not 1st newborn) | 1st newborn | 0.778 | 0.221 | -0.880 | 0.377 | [0.446; 1.358] | 0.778 | 0.223 | -0.880 | 0.381 | [0.444; 1.364] | 0.778 | 0.218 | -0.900 | 0.370 | [0.449; 1.347] |
| Abortion (Not aborted) | Aborted once | 1.646 | 0.648 | 1.270 | 0.206 | [0.761; 3.562] | 1.646 | 0.695 | 1.180 | 0.238 | [0.720; 3.763] | 1.646 | 0.664 | 1.230 | 0.217 | [0.746; 3.633] |
| Aborted more than once | 1.111 | 0.503 | 0.230 | 0.817 | [0.457; 2.700] | 1.111 | 2.084 | 0.060 | 0.955 | [0.028; 43.927] | 1.111 | 0.556 | 0.210 | 0.834 | [0.416; 2.966] | |
| Childbirth (Ventouse) | Natural | 0.593 | 0.449 | -0.690 | 0.490 | [0.135; 2.612] | 0.593 | 3.846 | -0.080 | 0.936 | [0.000; 1.963x 10⁵] | 0.593 | 0.469 | -0.660 | 0.509 | [0.126; 2.797] |
| Surgery | 0.777 | 0.580 | -0.340 | 0.736 | [0.180; 3.358] | 0.777 | 5.021 | -0.040 | 0.969 | [0.000; 2.443x 10⁵] | 0.777 | 0.611 | -0.320 | 0.749 | [0.166; 3.630] | |
| Gender (Female) | Male | 1.964 | 0.472 | 2.810 | 0.005 | [1.227; 3.146] | 1.964 | 0.480 | 2.760 | 0.006 | [1.217; 3.170] | 1.964 | 0.504 | 2.630 | 0.009 | [1.188; 3.248] |
| Number (Singleton) | Multiple | 0.306 | 0.136 | -2.660 | 0.008 | [0.128; 0.732] | 0.306 | 0.730 | -0.500 | 0.620 | [0.003; 32.826] | 0.306 | 0.136 | -2.670 | 0.008 | [0.128; 0.729] |
| APGAR (Below 4/10) | 4/10 to 6/10 | 0.335 | 0.133 | -2.760 | 0.006 | [0.154; 0.729] | 0.335 | 0.160 | -2.290 | 0.022 | [0.131; 0.856] | 0.335 | 0.157 | -2.340 | 0.020 | [0.134; 0.839] |
| 7/10 and above | 0.049 | 0.019 | -7.860 | p < 0.001 | [0.023; 0.103] | 0.049 | 0.020 | -7.300 | p < 0.001 | [0.022; 0.110] | 0.049 | 0.020 | -7.380 | p < 0.001 | [0.022; 0.109] | |
| Weight (Under 2500 g) | 2500 g to 4500 g | 0.227 | 0.089 | -3.790 | p < 0.001 | [0.105; 0.489] | 0.227 | 0.102 | -3.300 | 0.001 | [0.094; 0.548] | 0.227 | 0.105 | -3.210 | 0.001 | [0.091; 0.561] |
| Above 4500 g | 0.392 | 0.421 | -0.870 | 0.383 | [0.048; 3.213] | 0.392 | 8.103 | -0.050 | 0.964 | [0.000; 1.600x 10¹⁷] | 0.392 | 17.310 | -0.020 | 0.983 | [0.000; 1.740x 1037] | |
| Head (Below 32 cm) | 32 cm to 36 cm | 0.288 | 0.111 | -3.230 | 0.001 | [0.136; 0.613] | 0.288 | 0.121 | -2.960 | 0.003 | [0.127; 0.658] | 0.288 | 0.116 | -3.090 | 0.002 | [0.131; 0.635] |
| Above 36 cm | 0.122 | 0.128 | -2.010 | 0.045 | [0.016; 0.951] | 0.122 | 2.449 | -0.100 | 0.917 | [0.000; 1.670x 10¹⁶] | 0.122 | 5.426 | -0.050 | 0.962 | [0.000; 1.220x 1037] | |
| Height (Below 36 cm) | 46 cm to 54 cm | 0.567 | 0.235 | -1.370 | 0.171 | [0.251; 1.278] | 0.567 | 0.240 | -1.340 | 0.180 | [0.247; 1.300] | 0.567 | 0.247 | -1.300 | 0.193 | [0.241; 1.334] |
| Above 54 cm | 1.020 | 1.100 | 0.020 | 0.986 | [0.123; 8.444] | 1.020 | 21.073 | 0.000 | 0.999 | [0.000; 3.980x 10¹⁷] | 1.020 | 44.687 | 0.000 | 1.000 | [0.000; 2.150x 1037] | |
| Adjusted CPHM | Adjusted BCPHM | Adjusted JCPHM | ||||||||||||||
| Age (Under 20 years old) | 20 to 34 years old | 0.215 | 0.105 | -3.150 | 0.002 | [0.083; 0.559] | - | - | - | - | - | 0.215 | 0.104 | -3.190 | 0.001 | [0.084; 0.554] |
| 35 years old and above | 0.308 | 0.159 | -2.280 | 0.023 | [0.112; 0.848] | - | - | - | - | - | 0.308 | 0.160 | -2.270 | 0.023 | [0.111; 0.852] | |
| Gender (Female) | Male | 1.942 | 0.459 | 2.810 | 0.005 | [1.222; 3.085] | 1.562 | 0.350 | 1.990 | 0.046 | [1.007; 2.424] | 1.942 | 0.476 | 2.700 | 0.007 | [1.200; 3.142] |
| Number (Singleton) | Multiple | 0.264 | 0.115 | -3.060 | 0.002 | [0.112; 0.619] | - | - | - | - | - | 0.264 | 0.117 | -3.010 | 0.003 | [0.111; 0.629] |
| APGAR (Below 4/10) | 4/10 to 6/10 | 0.411 | 0.154 | -2.380 | 0.017 | [0.198; 0.856] | 0.695 | 0.288 | -0.880 | 0.379 | [0.308; 1.565] | 0.411 | 0.185 | -1.970 | 0.049 | [0.170; 0.995] |
| 7/10 and above | 0.059 | 0.021 | -7.850 | p < 0.001 | [0.029; 0.119] | 0.100 | 0.039 | -5.880 | p < 0.001 | [0.046; 0.215] | 0.059 | 0.024 | -6.810 | p < 0.001 | [0.026; 0.133] | |
| Weight (Under 2500 g) | 2500 g to 4500 g | 0.181 | 0.064 | -4.860 | p < 0.001 | [0.091; 0.361] | 0.200 | 0.084 | -3.840 | p < 0.001 | [0.088; 0.455] | 0.181 | 0.071 | -4.390 | p < 0.001 | [0.084; 0.389] |
| Above 4500 g | 0.372 | 0.384 | -0.960 | 0.338 | [0.049; 2.809] | 0.438 | 8.985 | -0.040 | 0.968 | [0.000; 1.280x 10¹⁷] | 0.372 | 16.296 | -0.020 | 0.982 | [0.000; 6.880x 1036] | |
| Head (Below 32 cm) | 32 cm to 36 cm | 0.208 | 0.068 | -4.830 | p < 0.001 | [0.110; 0.394] | 0.216 | 0.088 | -3.760 | p < 0.001 | [0.097; 0.480] | 0.208 | 0.080 | -4.060 | p < 0.001 | [0.098; 0.444] |
| Above 36 cm | 0.105 | 0.109 | -2.180 | 0.029 | [0.014; 0.797] | 0.109 | 2.234 | -0.110 | 0.914 | [0.000; 2.600x 10¹⁶] | 0.105 | 4.680 | -0.050 | 0.960 | [0.000; 9.160x 1036] | |
| X2= 300.360, p < 0.001 | X2= 296.290, p < 0.001 | X2= 32.310, p < 0.001 | ||||||||||||||
| CPHM | BCPHM | JCPHM | ||||||||||||||
|---|---|---|---|---|---|---|---|---|---|---|---|---|---|---|---|---|
| Covariate (Reference) | Level | HR | SE | z | P>z | 95% CI | HR | SE | z | P>z | 95% CI | HR | SE | z | P>z | 95% CI |
| Age (Under 20 years old) | 20 to 34 years old | 0.160 | 0.079 | -3.680 | p < 0.001 | [0.060; 0.424] | 0.160 | 0.323 | -0.910 | 0.364 | [0.003; 8.374] | 0.160 | 0.087 | -3.370 | 0.001 | [0.055; 0.464] |
| 35 years old and above | 0.199 | 0.107 | -2.990 | 0.003 | [0.069; 0.573] | 0.199 | 0.406 | -0.790 | 0.429 | [0.004; 10.896] | 0.199 | 0.120 | -2.680 | 0.007 | [0.061; 0.648] | |
| Residence (Rural) | Urban | 1.029 | 0.246 | 0.120 | 0.907 | [0.643; 1.645] | 1.029 | 0.307 | 0.090 | 0.925 | [0.573; 1.847] | 1.029 | 0.314 | 0.090 | 0.927 | [0.565; 1.871] |
| Antecedents (Not 1st newborn) | 1st newborn | 0.723 | 0.212 | -1.110 | 0.268 | [0.407; 1.283] | 0.723 | 0.227 | -1.030 | 0.301 | [0.391; 1.337] | 0.723 | 0.233 | -1.010 | 0.314 | [0.384; 1.359] |
| Abortion (Not aborted) | Aborted once | 1.588 | 0.628 | 1.170 | 0.242 | [0.732; 3.448] | 1.588 | 0.696 | 1.060 | 0.291 | [0.673; 3.749] | 1.588 | 0.659 | 1.110 | 0.265 | [0.704; 3.585] |
| Aborted more than once | 1.147 | 0.519 | 0.300 | 0.762 | [0.473; 2.782] | 1.147 | 4.651 | 0.030 | 0.973 | [0.000; 3.251x 10³] | 1.147 | 0.587 | 0.270 | 0.789 | [0.420; 3.127] | |
| Childbirth (Ventouse) | Natural | 0.532 | 0.400 | -0.840 | 0.401 | [0.122; 2.319] | 0.532 | 3.646 | -0.090 | 0.927 | [0.000; 3.605x 10⁵] | 0.532 | 0.448 | -0.750 | 0.454 | [0.102; 2.772] |
| Surgery | 0.695 | 0.515 | -0.490 | 0.624 | [0.163; 2.969] | 0.695 | 4.766 | -0.050 | 0.958 | [0.000; 4.743x 10⁵] | 0.695 | 0.579 | -0.440 | 0.663 | [0.136; 3.558] | |
| Gender (Female) | Male | 2.061 | 0.500 | 2.980 | 0.003 | [1.282; 3.315] | 2.061 | 0.556 | 2.680 | 0.007 | [1.215; 3.496] | 2.061 | 0.592 | 2.520 | 0.012 | [1.173; 3.621] |
| Number (Singleton) | Multiple | 0.243 | 0.113 | -3.040 | 0.002 | [0.098; 0.606] | 0.243 | 0.135 | -2.540 | 0.011 | [0.082; 0.724] | 0.243 | 0.141 | -2.440 | 0.015 | [0.078; 0.759] |
| APGAR (Below 4/10) | 4/10 to 6/10 | 0.207 | 0.084 | -3.880 | p < 0.001 | [0.094; 0.460] | 0.207 | 0.116 | -2.820 | 0.005 | [0.070; 0.618] | 0.207 | 0.120 | -2.710 | 0.007 | [0.066; 0.648] |
| 7/10 and above | 0.030 | 0.012 | -8.960 | p < 0.001 | [0.014; 0.065] | 0.030 | 0.015 | -7.070 | p < 0.001 | [0.011; 0.080] | 0.030 | 0.016 | -6.750 | p < 0.001 | [0.011; 0.083] | |
| Weight (Under 2500 g) | 2500 g to 4500 g | 0.222 | 0.088 | -3.800 | p < 0.001 | [0.102; 0.483] | 0.222 | 0.105 | -3.180 | 0.001 | [0.088; 0.562] | 0.222 | 0.107 | -3.110 | 0.002 | [0.086; 0.574] |
| Above 4500 g | 0.389 | 0.426 | -0.860 | 0.389 | [0.045; 3.338] | 0.389 | 8.081 | -0.050 | 0.964 | [0.000; 1.950x 10¹⁷] | 0.389 | 17.369 | -0.020 | 0.983 | [0.000; 4.530x 1037] | |
| Head (Below 32 cm) | 32 cm to 36 cm | 0.284 | 0.110 | -3.250 | 0.001 | [0.133; 0.607] | 0.284 | 0.115 | -3.100 | 0.002 | [0.129; 0.629] | 0.284 | 0.119 | -3.000 | 0.003 | [0.125; 0.647] |
| Above 36 cm | 0.110 | 0.117 | -2.070 | 0.038 | [0.014; 0.886] | 0.110 | 2.350 | -0.100 | 0.918 | [0.000; 1.590x 10¹⁷] | 0.110 | 3.679 | -0.070 | 0.947 | [0.000; 3.080x 1027] | |
| Height (Below 36 cm) | 46 cm to 54 cm | 0.569 | 0.238 | -1.350 | 0.177 | [0.251; 1.291] | 0.569 | 0.252 | -1.270 | 0.202 | [0.239; 1.354] | 0.569 | 0.273 | -1.180 | 0.240 | [0.222; 1.457] |
| Above 54 cm | 1.010 | 1.094 | 0.010 | 0.993 | [0.121; 8.431] | 1.010 | 21.269 | 0.000 | 1.000 | [0.000; 18.460x 10¹⁷] | 1.010 | 44.776 | 0.000 | 1.000 | [0.000; 5.730x 1037] | |
| Adjusted CPHM | Adjusted BCPHM | Adjusted JCPHM | ||||||||||||||
| Age (Under 20 years old) | 20 to 34 years old | 0.201 | 0.098 | -3.280 | 0.001 | [0.077; 0.524] | - | - | - | - | - | 0.201 | 0.102 | -3.170 | 0.002 | [0.075; 0.543] |
| 35 years old and above | 0.293 | 0.152 | -2.360 | 0.018 | [0.106; 0.811] | - | - | - | - | - | 0.293 | 0.160 | -2.250 | 0.025 | [0.101; 0.856] | |
| Gender (Female) | Male | 2.071 | 0.495 | 3.050 | 0.002 | [1.297; 3.308] | 1.562 | 0.400 | 1.740 | 0.081 | [0.946; 2.579] | 2.071 | 0.587 | 2.570 | 0.010 | [1.188; 3.611] |
| Number (Singleton) | Multiple | 0.205 | 0.092 | -3.520 | p < 0.001 | [0.085; 0.495] | - | - | - | - | - | 0.205 | 0.118 | -2.740 | 0.006 | [0.066; 0.637] |
| APGAR (Below 4/10) | 4/10 to 6/10 | 0.273 | 0.103 | -3.430 | 0.001 | [0.130; 0.573] | 0.545 | 0.273 | -1.210 | 0.226 | [0.204; 1.457] | 0.273 | 0.169 | -2.100 | 0.036 | [0.081; 0.919] |
| 7/10 and above | 0.038 | 0.014 | -8.980 | p < 0.001 | [0.019; 0.078] | 0.077 | 0.036 | -5.440 | p < 0.001 | [0.030; 0.193] | 0.038 | 0.023 | -5.530 | p < 0.001 | [0.012; 0.122] | |
| Weight (Under 2500 g) | 2500 g to 4500 g | 0.179 | 0.063 | -4.890 | p < 0.001 | [0.090; 0.356] | 0.201 | 0.083 | -3.880 | 0.000 | [0.089; 0.452] | 0.179 | 0.071 | -4.360 | p < 0.001 | [0.082; 0.388] |
| Above 4500 g | 0.379 | 0.396 | -0.930 | 0.353 | [0.049; 2.938] | 0.477 | 9.872 | -0.040 | 0.971 | [0.000; 2.040x 10¹⁷] | 0.379 | 16.849 | -0.020 | 0.983 | [0.000; 2.970x 1037] | |
| Head (Below 32 cm) | 32 cm to 36 cm | 0.205 | 0.067 | -4.860 | p < 0.001 | [0.108; 0.388] | 0.215 | 0.090 | -3.680 | p < 0.001 | [0.095; 0.487] | 0.205 | 0.081 | -4.030 | p < 0.001 | [0.095; 0.443] |
| Above 36 cm | 0.095 | 0.100 | -2.250 | 0.025 | [0.012; 0.740] | 0.105 | 2.180 | -0.110 | 0.914 | [0.000; 5.960x 10¹⁶] | 0.095 | 4.226 | -0.050 | 0.958 | [0.000; 5.340x 1036] | |
| X2= 316.160, p < 0.001 | X2= 297.200, p < 0.001 | X2= 29.760, p < 0.001 | ||||||||||||||
| CPHM | BCPHM | JCPHM | ||||||||||||||
|---|---|---|---|---|---|---|---|---|---|---|---|---|---|---|---|---|
| Covariate (Reference) | Level | HR | SE | z | P>z | 95% CI | HR | SE | z | P>z | 95% CI | HR | SE | z | P>z | 95% CI |
| Age (Under 20 years old) | 20 to 34 years old | 0.140 | 0.075 | -3.690 | p < 0.001 | [0.050; 0.398] | 0.140 | 0.257 | -1.070 | 0.283 | [0.004; 5.064] | 0.140 | 0.084 | -3.260 | 0.001 | [0.043; 0.457] |
| 35 years old and above | 0.171 | 0.098 | -3.090 | 0.002 | [0.056; 0.523] | 0.171 | 0.313 | -0.960 | 0.335 | [0.005; 6.216] | 0.171 | 0.111 | -2.710 | 0.007 | [0.048; 0.613] | |
| Residence (Rural) | Urban | 1.003 | 0.258 | 0.010 | 0.990 | [0.606; 1.660] | 1.003 | 0.347 | 0.010 | 0.993 | [0.510; 1.974] | 1.003 | 0.342 | 0.010 | 0.993 | [0.514; 1.956] |
| Antecedents (Not 1st newborn) | 1st newborn | 0.726 | 0.231 | -1.010 | 0.313 | [0.389; 1.353] | 0.726 | 0.280 | -0.830 | 0.406 | [0.341; 1.545] | 0.726 | 0.268 | -0.870 | 0.386 | [0.351; 1.498] |
| Abortion (Not aborted) | Aborted once | 1.671 | 0.686 | 1.250 | 0.211 | [0.748; 3.735] | 1.671 | 0.763 | 1.120 | 0.261 | [0.683; 4.091] | 1.671 | 0.722 | 1.190 | 0.234 | [0.717; 3.897] |
| Aborted more than once | 1.388 | 0.697 | 0.650 | 0.514 | [0.519; 3.712] | 1.388 | 0.756 | 0.600 | 0.548 | [0.477; 4.038] | 1.388 | 0.849 | 0.540 | 0.593 | [0.418; 4.609] | |
| Childbirth (Ventouse) | Natural | 0.533 | 0.422 | -0.790 | 0.427 | [0.113; 2.517] | 0.533 | 3.473 | -0.100 | 0.923 | [0.000; 1.883x 10⁵] | 0.533 | 0.449 | -0.750 | 0.456 | [0.102; 2.786] |
| Surgery | 0.759 | 0.590 | -0.360 | 0.722 | [0.166; 3.479] | 0.759 | 4.946 | -0.040 | 0.966 | [0.000; 2.683x 10⁵] | 0.759 | 0.628 | -0.330 | 0.739 | [0.150; 3.850] | |
| Gender (Female) | Male | 2.195 | 0.570 | 3.030 | 0.002 | [1.319; 3.652] | 2.195 | 0.672 | 2.570 | 0.010 | [1.204; 3.999] | 2.195 | 0.695 | 2.480 | 0.013 | [1.179; 4.086] |
| Number (Singleton) | Multiple | 0.203 | 0.110 | -2.950 | 0.003 | [0.071; 0.585] | 0.203 | 0.693 | -0.470 | 0.640 | [0.000; 162.000] | 0.203 | 0.196 | -1.650 | 0.099 | [0.031; 1.353] |
| APGAR (Below 4/10) | 4/10 to 6/10 | 0.167 | 0.085 | -3.500 | p < 0.001 | [0.061; 0.455] | 0.167 | 0.602 | -0.500 | 0.620 | [0.000; 197.300] | 0.167 | 0.180 | -1.660 | 0.098 | [0.020; 1.392] |
| 7/10 and above | 0.022 | 0.010 | -8.140 | p < 0.001 | [0.009; 0.055] | 0.022 | 0.078 | -1.070 | 0.284 | [0.000; 24.091] | 0.022 | 0.021 | -3.880 | p < 0.001 | [0.003; 0.151] | |
| Weight (Under 2500 g) | 2500 g to 4500 g | 0.221 | 0.088 | -3.790 | p < 0.001 | [0.101; 0.482] | 0.221 | 0.105 | -3.180 | 0.001 | [0.087; 0.560] | 0.221 | 0.105 | -3.170 | 0.002 | [0.087; 0.562] |
| Above 4500 g | 0.324 | 0.362 | -1.010 | 0.313 | [0.036; 2.892] | 0.324 | 6.266 | -0.060 | 0.954 | [0.000; 9.150x 10¹⁵] | 0.324 | 10.526 | -0.030 | 0.972 | [0.000; 1.450x 1027] | |
| Head (Below 32 cm) | 32 cm to 36 cm | 0.285 | 0.110 | -3.240 | 0.001 | [0.133; 0.609] | 0.285 | 0.119 | -3.020 | 0.003 | [0.126; 0.644] | 0.285 | 0.117 | -3.050 | 0.002 | [0.127; 0.639] |
| Above 36 cm | 0.106 | 0.114 | -2.090 | 0.036 | [0.013; 0.866] | 0.106 | 2.091 | -0.110 | 0.909 | [0.000; 5.660x 10¹⁵] | 0.106 | 3.780 | -0.060 | 0.950 | [0.000; 1.910x 1029] | |
| Height (Below 36 cm) | 46 cm to 54 cm | 0.539 | 0.226 | -1.480 | 0.140 | [0.237; 1.225] | 0.539 | 0.236 | -1.410 | 0.158 | [0.229; 1.270] | 0.539 | 0.252 | -1.320 | 0.186 | [0.216; 1.346] |
| Above 54 cm | 1.037 | 1.120 | 0.030 | 0.973 | [0.125; 8.613] | 1.037 | 20.074 | 0.000 | 0.998 | [0.000; 3.080x 10¹⁶] | 1.037 | 41.221 | 0.000 | 0.999 | [0.000; 7.290x 1033] | |
| Adjusted CPHM | Adjusted BCPHM | Adjusted JCPHM | ||||||||||||||
| Age (Under 20 years old) | 20 to 34 years old | 0.173 | 0.092 | -3.310 | 0.001 | [0.061; 0.488] | - | - | - | - | - | 0.181 | 0.096 | -3.230 | 0.001 | [0.064; 0.511] |
| 35 years old and above | 0.250 | 0.139 | -2.490 | 0.013 | [0.084; 0.745] | - | - | - | - | - | 0.248 | 0.139 | -2.490 | 0.013 | [0.083; 0.744] | |
| Gender (Female) | Male | 2.150 | 0.550 | 2.990 | 0.003 | [1.302; 3.549] | 2.031 | 0.473 | 3.050 | 0.002 | [1.287; 3.205] | 1.778 | 0.506 | 2.020 | 0.043 | [1.018; 3.106] |
| Number (Singleton) | Multiple | 0.176 | 0.091 | -3.350 | 0.001 | [0.064; 0.486] | - | - | - | - | - | - | - | - | - | - |
| APGAR (Below 4/10) | 4/10 to 6/10 | 0.249 | 0.114 | -3.030 | 0.002 | [0.101; 0.612] | - | - | - | - | - | 0.516 | 0.330 | -1.030 | 0.301 | [0.147; 1.809] |
| 7/10 and above | 0.030 | 0.013 | -8.220 | p < 0.001 | [0.013; 0.069] | - | - | - | - | - | 0.060 | 0.035 | -4.820 | p < 0.001 | [0.019; 0.188] | |
| Weight (Under 2500 g) | 2500 g to 4500 g | 0.176 | 0.062 | -4.910 | p < 0.001 | [0.088; 0.352] | 0.149 | 0.053 | -5.380 | p < 0.001 | [0.075; 0.299] | 0.209 | 0.082 | -3.990 | p < 0.001 | [0.097; 0.451] |
| Above 4500 g | 0.325 | 0.347 | -1.050 | 0.293 | [0.040; 2.636] | 0.367 | 6.399 | -0.060 | 0.954 | [0.000; 2.450x 10¹⁴] | 0.425 | 16.781 | -0.020 | 0.983 | [0.000; 1.840x 1033] | |
| Head (Below 32 cm) | 32 cm to 36 cm | 0.196 | 0.064 | -5.020 | p < 0.001 | [0.103; 0.370] | 0.120 | 0.038 | -6.700 | p < 0.001 | [0.065; 0.224] | 0.198 | 0.077 | -4.180 | p < 0.001 | [0.093; 0.423] |
| Above 36 cm | 0.090 | 0.095 | -2.290 | 0.022 | [0.011; 0.706] | 0.073 | 1.284 | -0.150 | 0.882 | [0.000; 7.170x 10¹³] | 0.098 | 4.324 | -0.050 | 0.958 | [0.000; 3.360x 1036] | |
| X2= 316.430, p < 0.001 | X2= 210.070, p < 0.001 | X2= 31.380, p < 0.001 | ||||||||||||||
4. DISCUSSION
The resampling methods adopted in the Cox Proportional Hazard Model (CPHM) include Bootstrap Cox Proportional Hazards Model (BCPHM) and Jackknife Cox Proportional Hazards Model (JCPHM) with three approaches of ties handling. The results by different approaches of ties handling are not critically different as expected. The analysis is then made on the STATA-15 default method [19]. The similarity observed between the results of JCPHM and those of CPHM is relatively stronger than that of BCPHM and CPHM. The similarity between CPHM and JCPHM suggests that the CPHM may be stable. The overall analysis confirms the significant difference of levels of covariates age, gender, number, APGAR, weight and head. The results show relatively higher risk of babies from under 20 years old parents as compared to the older parents, that is 4.651 times that of babies whose parents’ ages range from 20 to 34 years, and 3.247 times that of babies whose parents are 35 years old and above. The risk of male babies is 1.942 times that of female babies. The risk of multiple babies is 0.264 times that of singleton babies. Babies with APGAR below 4/10 are at a relatively higher risk, that is 2.433 times that babies with APGAR ranging from 4/10 to 6/10 and 16.949 times that of babies whose APGAR range from 7/10 to 10/10. The risk of babies whose weight is below 2500 g is 5.525 times that of babies whose weight range from 2500 g to 4500 g and 2.688 times that of babies with weight above 4500 g. The risk for babies born with a circumference of head below 32 cm is 4.808 times that of newborns whose circumference of head ranges from 32 cm to 36 cm, and 9.524 times that of newborns whose circumference of head is above 36 cm.
The results of BCPHM are also close to that of JCPHM and CPHM for all significant covariates but the model shows a relatively high standard error for non-significant levels of covariates. The critical discrepancy between standard errors after resampling for some covariates suggests instability of the CPHM at these specific covariates and this emphasizes their non-significance in the CPHM.
The dataset was recorded for one year. The stability of the adjusted CPHM is justified by the non-critical difference between the adjusted resampled models.
CONCLUSION
This paper reviewed different methods of resampling in Cox Proportional Hazards Model (CPHM) namely the Bootstrap Cox Proportional Hazards Model (BCPHM) and the Jackknife Cox Proportional Hazards Model (JCPHM). The results after resampling are compared to that of the CPHM for three different ties handling methods namely Breslow, Efron and Cox approximation. The test statistics show everywhere a higher performance of the JCPHM as compared to the CPHM and BCPHM.
The results displayed by the JCPHM and CPHM are very close and suggested the significance of the age of female parent, information on previous abortion, the gender of a newborn, the number of newborns at a time, APGAR, the weight of a newborn and the circumference of the head of a newborn. Male babies are at a relatively higher risk as compared to female babies. The risk is higher for babies whose parents are under 20 years old as compared to older parents. Babies born with APGAR less than 4/10 were found to have a higher risk as compared to newborns with APGAR greater than 4/10. Underweight babies were found to have a higher risk as compared to babies with normal weight and overweight. Babies with a normal circumference of the head were found to survive better than those with a relatively big head and relatively small head. Under-height babies were found to have a higher risk as compared to babies born with normal height and over-height newborns. The results of the BCPHM are not far from that of JCPHM and CPHM but the non-significant covariates displayed relatively higher standard error. The overall results for non-significant covariates showed a relatively higher standard error after resampling. Due to a relatively higher risk to death of an infant from under 20 years old parents, the pregnancy of parents belonging in such range of age should be avoided. Also as abnormality lead to a relatively higher risk to infant mortality, clinically recommended nutrition during pregnancy would decrease abnormality of the newborn; this would decrease the infant mortality.
Analysis was limited to one event which is the death of the infant. Resampling with multiple events could improve models where an alternative event is attracting a chronic disease or clinical complication for the infant during the study time.
LIST OF ABBREVIATIONS
| APGAR | = Appearance, Pulse, Grimace, Activity and Respiration |
| CPHM | = Cox Proportional Hazards Model |
| BCPHM | = Bootstrap Cox Proportional Hazards Model |
| JCPHM | = Jackknife Cox Proportional Hazards Model |
| KUTH | = Kigali University Teaching Hospital |
ETHICS APPROVAL AND CONSENT TO PARTICIPATE
The study was approved by the Kigali University Teaching Hospital where dataset was taken from the hospital database, with consent that the names of both the parents and the children cannot be published.
HUMAN AND ANIMAL RIGHTS
No animals/ humans were used for the studies that are the basis of this research.
CONSENT FOR PUBLICATION
Not applicable.
AVAILABILITY OF DATA AND MATERIALS
The data supporting the findings of the article is available in the School of Mathematics, Statistics and Computer Science, University of KwaZulu Natal at http://smscs.ukzn.ac.za/ Homepage.aspxL, reference number 00033 260 5610.
FUNDING
This work was funded by the University of KwaZulu Natal and Sub-Saharan Africa Consortium for Advanced Biostatistics (SSACAB) programme.
CONFLICT OF INTEREST
The authors declare that there is no conflict of interest, financial or otherwise.
ACKNOWLEDGEMENTS
This work was supported through the DELTAS Africa Initiative. The DELTAS Africa Initiative is an independent funding scheme of the African Academy of Sciences (AAS)’s Alliance for Accelerating Excellence in Science in Africa (AESA) and supported by the New Partnership for Africa’s Development Planning and Coordinating Agency (NEPAD Agency) with funding from the Wellcome Trust [grant 107754/Z/15/Z- DELTAS Africa Sub-Saharan Africa Consortium for Advanced Biostatistics (SSACAB) programme] and the UK government. The views expressed in this publication are those of the author(s) and not necessarily those of AAS, NEPAD Agency, Wellcome Trust or the UK government.

