All published articles of this journal are available on ScienceDirect.
Exploring Mortality Rates for Major Causes of Death in Korea
Abstract
Background:
The trends and patterns of the mortality rates for causes of death are meaningful information. They can provide a basis for national demographic and health care policies by identifying the number, causes, and geographical distribution of deaths.
Objective:
To explore and analyze the characteristics of the mortality rates for major causes of death in Korea.
Methods:
Some common data analysis methods were used to describe the data. We also used some visualization techniques such as heat maps and line plots to present mortality rates by gender, age, and year.
Results:
Our analysis shows the crude mortality rates have continually decreased over the last 25 years from 1983, though they have increased slightly since 2006. In addition, the top eight causes of death accounted for 80% of all Korean deaths in 2015. During the period 2005-2015, the leading cause of death was cancer in male and circulatory diseases in female. The trend for respiratory diseases shows a steep upward trend in males, while a similar trend can be observed for respiratory and nervous system diseases in females.
Conclusion:
The deaths for circulatory, respiratory, nervous system, digestive, and infectious diseases are the highest in the age 80 to 84, while cancer is the leading cause of death for ages 75 to 79. In addition, the mortality rates for circulatory, nervous, and respiratory diseases increase rapidly after the age of 80. Therefore, policies on health and welfare for the elderly are getting more and more important.
1. INTRODUCTION
The mortality rate is one of the indicators that reflect the health status of a population [1]. The proportion of the number of deaths in a country to its total population has steadily declined in most regions of the world [2-4]. Korea is no exception, experiencing substantial drops of its mortality rates, though there is a slight reversal in the trend since 2010 [5]. Life expectancy at birth in Korea saw a dramatic increase from 52.4 in 1960 to 82.3 years in 2015 [6]. The major reasons for mortality rates reductions are attributed to continuous improvements in public health measures [5] and the standard of living along with easy access to various medical services.
However, as Lim et al. [7] stated, to speed up the favorable trend in the overall mortality, understanding cause-specific mortality rates and their temporal trends seem necessary. The trends and patterns of mortality rates for major causes of death are potentially useful not just for clinicians and researchers seeking to improve health and reduce high risk factors in the medical scene, but also for public health officials because they identify the number, causes, and geographical distribution of deaths, providing a basis for national demographic and health care policies. Examining the changes that occur in the causes of death over a long period of time may even provide some insights regarding how to cope with issues of public health and welfare in developing countries as well as in other countries [8].
The aim of this study is to explore and analyze the characteristics of the mortality rates for major underlying causes of death in Korea. For this purpose, we analyze and visualize Korea’s death data. First, we explore the patterns of death by seasons and months, and examine the mortality rate for each cause of death. Second, we analyze frequencies of deaths according to gender and age and investigate the causes that affect most Korean deaths. Lastly, we visualize mortality rates using various graphs including heat map plots, with which we can better explore and understand the relationships between the variables and secular trends, which are inherent in the data. The features and main contributions of this study can, therefore, be summarized as follows: We present the mortality rate patterns for major causes of Korean deaths, which may serve as a reference for the government to establish strategies on the prevention of disease and grasp indirectly the demand of health medicine. Furthermore, we use some visualization techniques including heat maps to investigate the information and associations among the variables. With these visualizations, we can provide a clearer and more accurate understanding of death data.
2. MATERIALS AND METHODS
2.1. Data Sources
Public health data are constructed from different sources e.g., birth and death records, medical records, interview surveys, or through direct physical examinations and laboratory testings. The National Statistics Office (NSO) of South Korea aggregates demographic trends every month. The National Health Insurance Service (NHIS) and the Ministry of Health and Welfare (MOHW) report the statistics on health examination and community health indicators every year, respectively.
In South Korea, the medical certification of death is not mandatory and there may be a problem with the quality of death statistics data for several reasons. Korean death statistics have been perceived as less reliable until the late 1990s [9]. The Korean government, however, has attempted to make various changes to the death registration since 1999. e.g., they have expanded the link to the registered death database to other databases. As the result of these efforts, the quality of the death statistics and the accuracy of identifying the underlying causes have improved [9, 10], and the erroneous misclassification of cause of death has decreased [11]. The underlying cause of death was specifically defined as the disease or injury that initiated the train of morbid events leading directly to death or the circumstances of the accident or violence that produced the fatal injury [12].
To analyze and visualize mortality rates, we collected relevant data for the period 2005-2015 from the micro data service and 1983-2015 from data service by subjects of the Korean Statistical Information Service (KOSIS, https://www. kosis.kr). As a gateway for Korea’s official statistics, KOSIS offers a convenient one stop service to a full range of major domestic and international statistics. The micro data set consists of about 3 million subjects and some indicators/ variables including causes of death. The data set obtained from the data service by subjects has information relating to the number of deaths and mortality rates by the causes of death and age groups.
2.2. Statistical Analysis
To explore and analyze the data, common data analysis methods were used. A two sample proportion test was used to compare the proportions of the variables in two groups [13, 14]. Hypothesis testing for a proportion was used to determine if a sampled proportion is significantly different from the other sampled proportion. In addition, exploratory data analysis methods were primarily used to explore the data with more quantitative traditional methods. We also used some visualization techniques such as heat map and line plots to present mortality rates by gender, age and year.
Heat maps are a popular graphical way to summarize data, observe relationships among several statistical variables (the columns in a heat map), and organize the observations from numerous participants (the rows in a heat map) all in one single graph [15]. Heat maps have been made widely popular by Eisen et al. [16]. But, as Wilkinson and Friendly [17] pointed out, heat maps and related graphs can be dated back to the 19th century. The underlying idea for heat maps is that the data is split into different intervals that are assigned to a color.
3. RESULTS
3.1. Number of Deaths and Mortality Rate
The crude mortality rates, in deaths per 100,000, have continually decreased over the last 25 years in Korea since 1983, though they have increased slightly since 2006. In contrast, the number of deaths is more or less on an upward trend over the last 30 years [8]. Table 1 summarizes the trends of the number of deaths and crude mortality rates from 1983 to 2015. The crude mortality rate in 2015 was 541.5 per 100,000, which was an increase of 14.2 (2.7%) compared to the rate observed in 2014. The rate in males was 591.0 per 100,000, which was 1.2-fold higher than in female (492.1 per 100,000). The number of deaths in 2015 was the highest since 1983, and the crude mortality rate was the highest since 1992. The total number of deaths in 2015 was 275,895, which was about 0.54% of the population and an increase of 32,012 (13.1%) and 8,203 (3.1%) from 2005 and 2014, respectively. The number of deaths in males was 150,449 with an increase of 3,128 (2.1%) from 2014, while the number of deaths in females was 125,446 with an increase 5,075 (4.2%). Table 2 presents the mortality rates for the major causes of death and age in 2015. The rates for suicide and circulatory were the highest for ages of 10 to 39 and over 80, respectively, and the rate for cancer was the highest in all other age groups.
| Year | No. of deaths | Crude mortality rate | Gender ratio | Average daily no. of deaths | ||||
|---|---|---|---|---|---|---|---|---|
| Total | Male | Female | Total | Male | Female | |||
| 1983 1984 1985 1986 1987 1988 1989 1990 1991 1992 1993 1994 1995 1996 1997 1998 1999 2000 2001 2002 2003 2004 2005 2006 2007 2008 2009 2010 2011 2012 2013 2014 2015 |
254,563 236,445 240,418 239,256 243,504 235,779 236,818 241,616 242,270 236,162 234,257 242,439 242,838 241,149 241,943 243,193 245,364 246,163 241,521 245,317 244,506 244,217 243,883 242,266 244,874 246,113 246,942 255,405 257,396 267,221 266,257 267,692 275,895 |
148,101 137,799 140,671 139,773 141,028 136,912 137,528 138,730 138,270 134,231 133,099 137,683 137,059 136,328 135,995 136,543 136,397 136,486 134,058 134,742 134,887 135,218 134,382 133,725 134,922 136,932 137,735 142,358 143,250 147,372 146,599 147,321 150,449 |
106,462 98,646 99,747 99,483 102,476 98,867 99,290 102,886 104,000 101,931 101,158 104,756 105,779 104,821 105,948 106,650 108,967 109,677 107,463 110,575 109,619 108,999 109,501 108,541 109,952 109,181 109,207 113,047 114,146 119,849 119,658 120,371 125,446 |
637.8 585.2 589.2 580.5 585.0 561.0 557.9 563.6 559.6 539.8 523.5 536.3 532.1 523.5 520.6 519.2 520.2 517.9 504.5 509.7 506.1 503.7 501.0 495.6 498.4 498.2 497.3 512.0 513.6 530.8 526.6 527.3 541.5 |
735.8 676.3 683.7 672.9 672.8 647.2 643.9 643.2 634.7 609.8 592.2 606.3 597.8 589.1 582.6 580.5 576.0 571.9 557.8 557.9 556.6 556.1 550.5 545.7 547.9 553.1 553.7 570.0 571.1 585.1 579.8 580.6 591.0 |
538.2 492.5 493.1 486.7 496.0 473.6 470.8 483.0 483.5 469.0 454.1 465.6 465.8 457.3 458.0 457.4 464.0 463.3 450.7 461.2 455.4 451.0 451.1 445.2 448.7 443.0 440.7 454.0 456.0 476.4 473.4 474.1 492.1 |
1.37 1.37 1.39 1.38 1.36 1.37 1.37 1.33 1.31 1.30 1.30 1.30 1.28 1.29 1.27 1.27 1.24 1.23 1.24 1.21 1.22 1.23 1.22 1.23 1.22 1.25 1.26 1.26 1.25 1.23 1.22 1.22 1.20 |
697 648 659 655 667 646 649 662 664 647 642 664 665 661 663 666 672 674 662 672 670 669 668 664 671 674 677 700 705 732 729 733 756 |
| Rank | Total | ~ 9 | 10 ~ 19 | 20 ~ 29 | 30 ~ 39 | |||||
|---|---|---|---|---|---|---|---|---|---|---|
| 1 2 3 4 5 6 7 8 |
Cancer Circulatory Respiratory Suicide Digestive Endocrine Nervous Infectious |
153.6 116.9 54.6 26.5 23.0 22.9 21.1 14.3 |
Cancer Nervous Circulatory Respiratory Endocrine Infectious Digestive Suicide |
2.3 1.9 1.1 0.7 0.5 0.4 0.2 0.0 |
Suicide Cancer Nervous Circulatory Infectious Endocrine Digestive Respiratory |
4.2 2.4 1.4 0.9 0.2 0.2 0.2 0.2 |
Suicide Cancer Circulatory Nervous Respiratory Digestive Infectious Endocrine |
16.4 5.1 2.3 1.8 0.5 0.5 0.5 0.5 |
Suicide Cancer Circulatory Digestive Infectious Nervous Endocrine Respiratory |
25.1 15.4 7.3 3.2 1.2 1.2 1.0 1.0 |
| Rank | 40 ~ 49 | 50 ~ 59 | 60 ~ 69 | 70 ~ 79 | 80 ~ | |||||
| 1 2 3 4 5 6 7 8 |
Cancer Suicide Circulatory Digestive Endocrine Infectious Respiratory Nervous |
47.7 29.8 23.4 15.6 3.7 3.4 2.8 2.4 |
Cancer Circulatory Suicide Digestive Endocrine Respiratory Infectious Nervous |
138.2 52.1 34.3 30.2 12.5 10.1 8.2 5.7 |
Cancer Circulatory Respiratory Digestive Suicide Endocrine Nervous Infectious |
335.1 130.2 43.1 39.3 36.9 32.4 17.2 16.7 |
Cancer Circulatory Respiratory Endocrine Nervous Digestive Suicide Infectious |
815.2 520.9 242.7 122.7 83.5 75.5 62.5 61.5 |
Circulatory Cancer Respiratory Nervous Endocrine Infectious Digestive Suicide |
2273.6 1475.7 1287.8 476.6 363.2 262.3 252.0 83.7 |
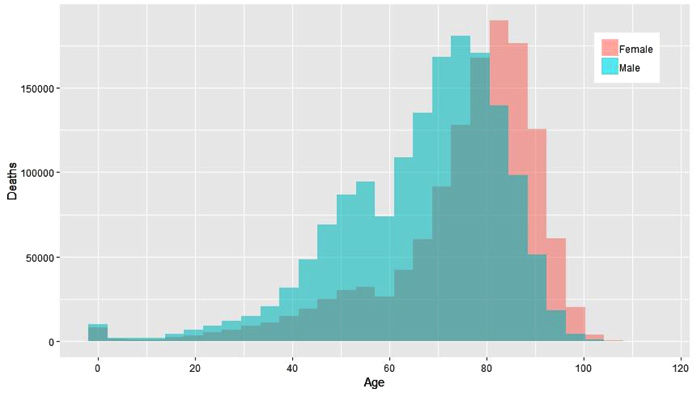
From 2005 to 2015, the gender ratio of the population according to age is reversed starting at age 56. The ratio of male population to female population is 1.06 until age 55, but the ratio of female population to male population is 1.25 after age 55. Fig. (1) presents the total number of deaths from 2005 to 2015 by gender and age. The total numbers of deaths of males are higher than those of females in the age groups under 80. The gender ratio of deaths was the highest at 2.9-fold in the age group of 50, while the gender ratio of the population in the same age group is only 1.005-fold. In the age group over 80, however, the deaths of females are overwhelmingly larger than those of males as the proportion of women is higher e.g., in 2005 and 2015, the ratio of the female population is 2.42 and 2.29 fold higher than the male population. The deaths of females over 80 are 47,022 and 70,836 in 2005 and 2015, which are 1.9 and 1.7-fold larger than 25,079 and 41,802 males, respectively.
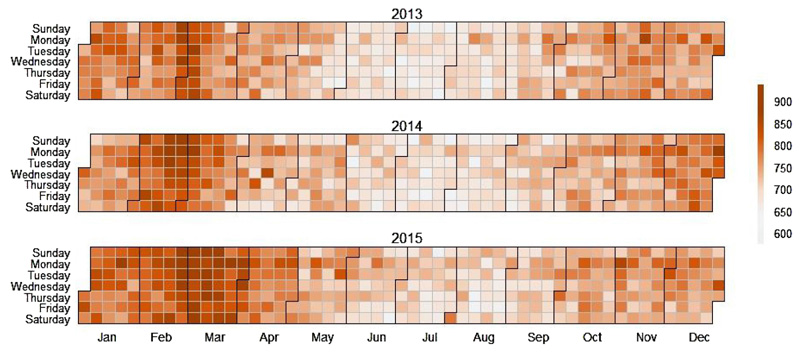
Fig. (2) presents the number of monthly deaths from 2013 to 2015 using heat maps. In the heat maps, darkish colors represent a high density of deaths, while lightish colors represent a low density of deaths. The heat maps show a seasonal trend that can be associated with cold weather. This observation confirms the results from many previous studies that have investigated the association between temperature and mortality and found a significant association [18, 19].
Recently, there has been a growing body of literature on the temperature mortality relationship among older people in both developed [20-24] and developing countries [25-28]. Both hot temperatures and temperature variability have been found to impact mortality rates [29]. Cold weather and being cold from living in a home with persistently low temperatures and lack of thermal comfort have been shown to have impacts on physical health and cause death from circulatory and lung diseases that would not have occurred in warmer temperatures and warmer homes [30].
3.2. Exploring the Causes of Death
Statistics Korea has published an annual report on the cause-of-death statistics of the Korean population since 1983. In order to determine the ranking of causes of death, Statistics Korea used the selection list of 103 causes of death for the tabulation of mortality statistics recommended by the World Health Organization to better fit the Korean society. The eight leading causes of death were, in order of mortality rates, cancer, circulatory, respiratory, suicide, digestive, endocrine, nervous system, and infectious disease. The top eight causes of death accounted for 80% of all Korean deaths in 2015.
Temporal trends in mortality rates for the leading causes of death varied by cause of death and by gender. Fig. (3) compares the trends of mortality rates from 2005 to 2015 by causes of death for the rates for males and females. The rates for cancer and circulatory diseases are considerably higher than the rates for other causes. Most causes display slightly changing trends in both males and females except for cancer, respiratory, and nervous system diseases. The leading cause of death each year from 2005 to 2015 was cancer in males and circulatory diseases in females. The trend for respiratory diseases shows a steep upward trend in males, while a similar trend can be observed for respiratory and nervous system diseases in females. In particular, endocrine diseases have a slightly decreasing trend in males, and suicide, as well as endocrine diseases, show a slightly changing trend in females.
Table 3 shows the comparison results of mortality rates by gender in all ages and in the 75 or older group, respectively. In all age groups, the rates for cancer and suicide were significantly different between male and female at the 1% level for the two-tailed test (p-value<0.001 and 0.004, respectively). There were no significant statistical differences between the two gender groups for the remaining variables. In the 75 or older group, however, the rates for all causes except for nervous system diseases were significantly higher in males. The p-values were 0.008 for digestive diseases and 0.001 or smaller for the remaining six diseases.
Noticeably, about 91% (male: 89%, female: 93%) of all Korean deaths in 2015 occurred after age 50. Fig. (4) presents the deaths and mortality rates after age 50 by causes of death. The death toll for cancer is the highest at age 75-79, while the highest death tolls for most other diseases (except for suicide) occur at the age of 80 or older. The death toll for suicide has a tendency to decrease after the age of 50, but death tolls continue to increase until age 80 for most diseases. The mortality rates for circulatory, nervous system and respiratory diseases increase rapidly after the age of 80, while the rate for cancer tends to decrease after the age of 85.
In the eight leading causes of death, on the other hand, about 55% of deaths occurred in people aged 75 or older. Exploring the mortality rates, therefore, has a considerable implication in figuring out the influence of each cause of death for those over 75 years of age. Table 4 presents the differences in mortality rates for men and women aged 75 or older. The leading causes of death are cancer, circulatory, and respiratory diseases in males, while circulatory, cancer, and respiratory diseases in females. The rates for males, compared to females, are higher in all causes of death except for nervous system diseases. The absolute difference of the rate for cancer between males and females is the greatest, while the difference is about 33.5 and 12.1 times that for digestive diseases and suicide, respectively. However, the relative difference is the greatest in suicide, which is about 1.6 and 15.5 times that for cancer and circulatory diseases, respectively. The cause that has the greatest difference in mortality rate for men and women aged 75 or older is consequently suicide.
| Age(all) | Age (75 or older) | |||||
|---|---|---|---|---|---|---|
| Male | Female | p-value | Male | Female | p-value | |
| Cancer | 190.2 | 117.1 | <0.001*** | 4066.7 | 1644.2 | <0.001*** |
| Circulatory | 110.8 | 123.0 | 0.464 | 3287.1 | 2851.7 | <0.001*** |
| Respiratory | 60.9 | 48.2 | 0.263 | 2551.9 | 1199.1 | <0.001*** |
| Suicide | 37.5 | 15.5 | 0.004** | 286.5 | 86.2 | <0.001*** |
| Digestive | 29.2 | 16.8 | 0.093 | 397.0 | 324.7 | 0.008** |
| Endocrine | 22.8 | 22.9 | 0.999 | 598.5 | 492.9 | 0.001*** |
| Nervous | 17.0 | 25.2 | 0.502 | 593.2 | 596.1 | 0.956 |
| Infectious | 14.7 | 13.9 | 0.999 | 443.7 | 302.0 | <0.001*** |
| Male | Female |
Absolute Difference (Male-Female) |
Ratio of the difference (Male-Female)/Female |
|
|---|---|---|---|---|
| Cancer | 4066.7 | 1644.2 | 2422.5 | 1.47 |
| Circulatory | 3287.1 | 2851.7 | 435.4 | 0.15 |
| Respiratory | 2551.9 | 1199.1 | 1352.8 | 1.13 |
| Suicide | 286.5 | 86.2 | 200.3 | 2.32 |
| Digestive | 397.0 | 324.7 | 72.3 | 0.22 |
| Endocrine | 598.5 | 492.9 | 105.6 | 0.21 |
| Nervous | 593.2 | 596.1 | -2.9 | -0.01 |
| Infectious | 443.7 | 302.0 | 141.7 | 0.47 |
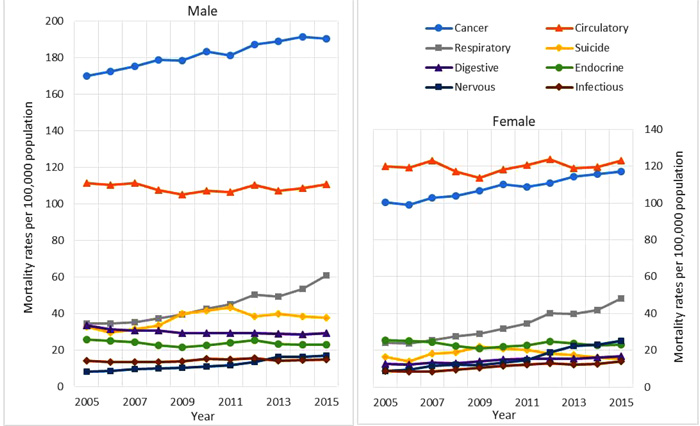
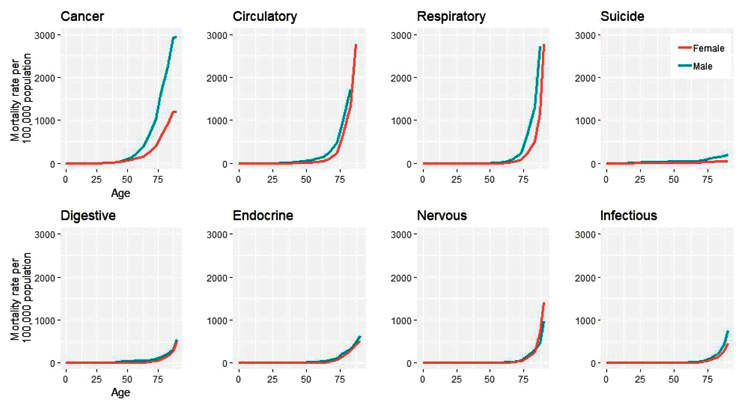
Fig. (5) compares the trend in mortality rates depending on age for males and females by causes of death in 2015. The difference in the mortality rate for males and females for cancer dramatically increased after the age of 50. There are similar trends related to gender in the rates for respiratory, endocrine, and digestive diseases. The suicide rate began to vary between males and females after the age of 25, and it increased drastically in the case of male after the age of 70. In particular, the rate for nervous system diseases was slightly higher in males until the age of 70, but higher in females after the age of 70. This is a unique pattern among the leading eight causes of death.
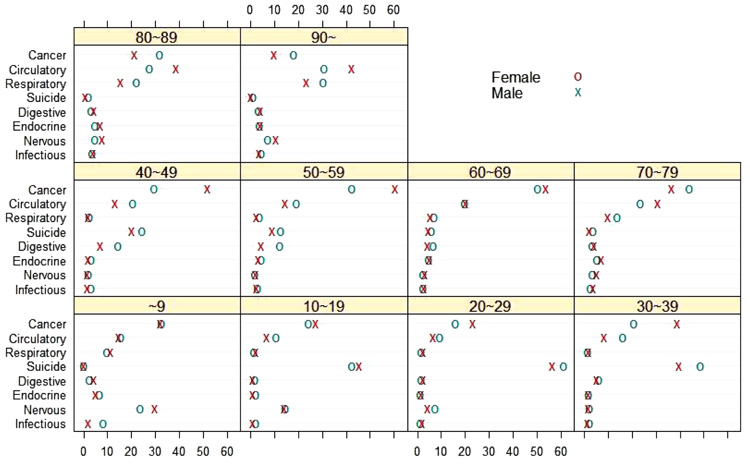
Fig. (6) presents the proportions of deaths for eight causes of death in each age group. Under the age of 9, the proportions for cancer and nervous diseases were relatively high. However, suicide deaths were overwhelmingly high from the age of 10 to 39, and the death proportion from cancer was noticeably high from the age of 40 to 79. The proportions from cancer were higher in females up to the age of 69, and they reversed after the age of 70. In addition, there was a substantial difference in the proportion of deaths from cancer between male and female, and it especially showed the biggest difference from the age of 40 to 49. After the age of 70, the diseases with the highest death proportions were cancer, circulatory, and respiratory.
4. DISCUSSION
The annual average number of births in South Korea was about 457,000, while the annual average number of deaths was about 256,000 from 2005 to 2015. The number of births was over 1 million in the early 1970s, but it decreased to about 438,000 in 2015. This has led to the lowest population growth since the publication of demographic statistics. The number of deaths has continued to grow slightly from about 259,000 in 1970 to 276,000 in 2015 while the number of births has reduced and the proportion of the aging population has increased. The proportion of deaths for the eight leading causes of death increased from 74% in 2005 to 80% in 2015.
The highest mortality rate among the eight leading causes of death was cancer, and the lowest was nervous system diseases in 2005. The mortality rate for nervous system diseases, however, increased steeply in 2015, with its former place replaced by infectious diseases. The most remarkable changes from 2005 in mortality rates were the increase in nervous system diseases and the decrease in endocrine diseases, such that the rate of nervous system diseases increased by 148% and the rate of endocrine diseases decreased by 10% in 2015, compared to 2005. Nervous system diseases include meningitis, Alzheimer, and other diseases associated with the nervous system. Endocrine diseases consist of diabetes, malnutrition, endocrine, and other diseases related to nutrition and and metabolism. In terms of the mortality rates by gender, the highest was cancer for males and circulatory diseases for females in both 2005 and 2015. The lowest was nervous and infectious diseases for males and females, respectively, in 2005, but it changed to infectious diseases for males in 2015.

The age-standardized mortality rate of Korea was the 13th lowest among 34 Organization for Economic Co-operation and Development (OECD) countries in 2012 [31]. The rate for cancer was 24.2 per 100,000 lower than the OECD average of 207.5 per 100,000, and it was ranked 29th. The rate is at a quite low level compared to Hungary with 293.3 and Slovenia with 257.3 per 100,000. On the contrary, suicide (1st), gastric cancer (3rd), diabetes (5th), and cerebrovascular disease (10th) rates were considerably higher. In 2012, the mortality rate for suicide in Korea was 29.1 per 100,000, which was 17.0 per 100,000 more than the OECD average of 12.1 per 100,000. The suicide rate was the highest among OECD countries, followed by Hungary with 22.0 per 100,000. The rate for gastric cancer in Korea has been much lower than in the past, but it was still the third-largest in the OECD countries. Chile with 27.9 per 100,000 had the highest risk of gastric cancer among OECD countries, followed by Japan with 25.4 per 100,000. The rate for cerebrovascular diseases in Korea was 8.4 per 100,000 higher than the OECD average of 68.1 per 100,000. The country with the highest mortality rate for cerebrovascular diseases was Slovakia with 136.7 per100,000, followed by Hungary with 122.3 per 100,000. With the advances of preventive medicine and medical insurance systems, diseases that require advanced medical technologies have shown reduced rates. However, the rates for some causes such as suicide and diabetes show an increasing tendency, thus requiring some appropriate countermeasures.
It should be noted that Korea is experiencing a rapidly aging population. Older people aged 65 and over were only 4.5% in 1992, but increased to 8.8% in 2005, and accounted for 13.2% of the population in 2015 [32]. This is a substantially larger percentage than the 8.5% worldwide in 2015 [33]. In addition, the life expectancy at birth in 2015 is 82.3 years which gives Korea a world life expectancy ranking of 11 [34, 35]. Therefore, policies on health and welfare for the elderly are very important issues.
This study has some limitations. As mentioned above, the quality of the death statistics and the accuracy of identifying the causes have improved over time in Korea. Nevertheless, the data sources used in this study may be subject to potential misclassification of causes of death in official death certificates. Second, the study explored and analyzed the characteristics of mortality for only eight major causes of death, but not all causes such as the full WHO table for causes of death. The results, therefore, should only be interpreted for the causes analyzed in this article.
CONCLUSION
In this study, we analyzed and visualized the characteristics of the mortality rates for major causes of death in Korea. The age-standardized mortality rate in Korea has steadily declined since the 1980s. The crude mortality rate, however, has changed from a decreasing to an increasing trend starting from 2010. In the case of nervous system and respiratory diseases, there is a large increase in 2015 compared to 2010. The rates for cancer and circulatory diseases, among the eight leading causes of death, are significantly higher than the other diseases from 2005 to 2015. The administrative agencies related to health and welfare should establish relevant preventive policies/strategies in order to reduce the mortality rates. Korea is rapidly aging as the population growth rate decreases. We explored the mortality rate focusing on data from the elderly in this study. The deaths for circulatory, respiratory, nervous system, digestive, and infectious diseases are the highest in the age 80 to 84 group, while cancer is the leading cause of death for ages 75 to 79. In addition, the mortality rates for circulatory, nervous, and respiratory diseases increase rapidly after the age of 80. Therefore, policies on health and welfare for the elderly are getting more and more important.
ETHICS APPROVAL AND CONSENT TO PARTICIPATE
Not applicable.
HUMAN AND ANIMAL RIGHTS
No Animals/Humans are used for studies that are bases of this research.
CONSENT FOR PUBLICATION
Not applicable.
CONFLICT OF INTEREST
The authors declare no conflict of interest, financial or otherwise.
ACKNOWLEDGEMENTS
Declared none.


