All published articles of this journal are available on ScienceDirect.

Modelling Deaths Associated with Road Traffic Accidents and other Factors on Great North Road in Zambia between the Years 2010 and 2016 Using Poisson Models
Abstract
Background:
According to the World Health Organization (WHO), 1.24 million people die annually on the world’s roads, with 20-50 million sustaining non-fatal injuries. More than 85% (1.05 million) of the global deaths due to injuries occur in the developing world. Road traffic deaths and injuries are a major but neglected public health challenge that requires concerted efforts for effective and sustainable prevention. The objectives of the study were to estimate the incidence rate of death from RTAs, to determine factors associated with serious and fatal Road Traffic Accidents (RTAs) and to determine which of the poisson models fit the count data better.
Methods:
Data was collected from Zambia Police (ZP), Traffic Division on accidents that occurred on the Great North Road (GNR) highway between Lusaka and Kapiri-Mposhi in Zambia from January 1, 2010 to December 31, 2016. Results from standard Poisson regression were compared to those obtained using the Negative Binomial (NB), Zero-Truncated Negative Binomial (ZTNB) and the Zero-Truncated Poisson (ZTP) regression models. Diagnostic tests were used to determine the best fit model. The data was analysed using STATA software, version 14.0 SE (Stata Corporation, College Station, TX, USA).
Results:
A total of 1, 023 RTAs were analysed in which 1, 212 people died. Of these deaths, 82 (7%) were Juveniles and 1, 130 (93%) were adults. Cause of accident such as pedestrians crossing the road accounted for 30% (310/1,023) while 29% (295/1,023) were as a result of driver’s excessive speed. The study revealed that driving in the early hours of the day (1AM-6AM) as compared to driving in the night (7PM-12AM) had a significant increase in the incidence rate of death from RTAs, Incidence Rate Ratio (IRR) of 2.1, (95% CI={1.01-4.41}), p-value=0.048. Results further showed that public transport as compared to private transport had an increased incidence rate of death from RTAs (IRR=5.65, 95% CI={2.97-10.73}), p-value<0.0001. The two competing models were the ZTP and the ZTNB. The ZTP had AIC=1304.55, BIC= 1336.55, whereas the ZTNB had AIC=742.25 and BIC=819.69. This indicated that the ZTNB with smaller AIC and BIC was the best fit model for the data.
Conclusion:
There is a reduced incidence of dying if one is using a private vehicle as compared to a public vehicle. Driving in the early hours of the day (1AM and 6AM) had an increased incidence of death from RTAs. This study suggests that when dealing with counts in which there are a few zeros observed such as in serious and fatal RTAs, ZTNB fits the data well as compared to other models.
1. INTRODUCTION
The World Health Organization (WHO) defines a Road Traffic Accident (RTA) as a collision involving at least one vehicle in motion on a public or private road that results in at least one person being injured or killed [1]. A traffic collision, also known as a Motor Vehicle Collision (MVC) among others occurs when a vehicle collides with another vehicle, pedestrian, animal, road debris, or other stationary obstruction, such as a tree or pole. These traffic collisions may result in injury, death and property damage. Road Traffic Accidents (RTAs) are one of the major causes of deaths, injuries and disabilities globally. According to WHO, the epidemic of road traffic injuries is increasing in most regions of the world [2]. In fact, it has a great impact on the Disability-adjusted Life Years (DALYs). As a result, it is now a public health problem, particularly in developing countries. A DALY is a measure of overall disease burden, expressed as the number of years lost due to ill-health, disability or early death [2].
The WHO reports that about 1.24 million people die annually on the world’s roads, with 20-50 million sustaining non-fatal injuries [2]. Globally, road traffic injuries are reported as the leading cause of death among young people aged 15-29 years and are among the top three causes of mortality among people aged 15-44 years [3]. More than 85% (1.02 million out of 1.24 million deaths) of the global deaths due to injuries occur in the developing world, consuming substantial health sector resources [4]. Further, road traffic deaths and injuries are a major but neglected public health challenge that requires concerted efforts for effective and sustainable prevention as the people dying on the roads keep increasing worldwide. The increased burden from road traffic injuries and deaths is partly due to economic development, which has led to an increased number of vehicles on the road [4].
The dynamic nature of this multi-causal phenomenon affects victims to different degrees depending on the type of accident (run over pedestrian, motorbike accident or another type of accident involving a vehicle or motorbike) and demographic characteristics (sex, age, skin colour, marital status and level of education) [5, 6]. There are several factors that contribute to the occurrence of a RTA. Factors that contribute to accidents among others are socio-demographic factors such as the age of the driver and the sex of the driver. The vehicle condition also contributes to these accidents because a vehicle which is not roadworthy is prone to accidents. Driving under the influence of alcohol is also one factor that has been documented. There is also an appreciation that inclement weather is associated with more hazardous driving conditions. Various studies show that precipitation in the form of rainfall and snowfall generally results in more accidents [7, 8]. Another study [9] supports these findings and added that causes of RTAs’ among others include human or driver errors, vehicle characteristics, traffic infrastructures including engineering design, road maintenance and traffic regulation. Driver attitude including road courtesy and behaviour, driving under the influence of drugs especially alcohol, male sex, use of seat belts, driver age (teenage drivers and elderly drivers), are among the recognised human factors [10]. Another study [11] looked at urban RTA risks for the city of Zagreb, Croatia, from 1999 through 2000. The accidents were analysed with the aim of reducing the increasing injury incidence and results indicated that more fatal accidents occurred during night hours, on urban road links, and at exceeding the speed limit.
In estimating the incidence rate [12], examined the effect of age on driver performance and safety in professional heavy vehicle drivers. In their study, they modelled the incidence rate ratios involving male drivers of rigid trucks 45-54 year olds compared to those older than 65 years old, results showed that older drivers 65 years of age and older were significantly less likely to have a crash. For drivers in the 55-64 age group there was no difference between their crash rate and their younger peers.
Globally, Zambia is ranked 29th in the world in RTAs and has a death rate of 26.51 per 100, 000 people [2]. Statistics from Zambia Police [13] indicate that Road deaths in Zambia have increased by 85% between 2012 and 2014 from 1,000 to 1,858 respectively. Despite the growing body of literature on factors (for example., socio-economic and demographic factors, road way geometric and environmental characteristics along with human behaviours) that are associated with RTAs on highways in other countries, to our knowledge, there have been no appropriate modelling techniques employed to estimate the incidence rate of death from RTAs and identification of factors associated with RTAs on the Great North Road (GNR) highway from Lusaka to Kapiri-Mposhi in Zambia.
Statistical techniques known and applied to model these scenarios are limited to basic statistics such as linear and Poisson regression that do not account for over dispersion. Further, Road Traffic Accident data violates most of the assumptions that standard Poisson regression models is based. Appropriate extensions of this model, even though available, are rarely used by most applied statisticians. For modelling approaches in count data, several studies have used different models in different scenarios, in this regard [14] studied the relationship between highway geometric factors and truck accidents in Virginia using both linear and Poisson regression models. In comparing these regression models, they concluded that linear regression techniques used in their research did not describe the relationship between truck accidents and the independent variables adequately but that the Poisson models did. In addition to this, recent research has shown that the NB model can be significantly affected by datasets characterized by a heavy tail [15].
The main objective of this study was to apply Poisson models in estimating the incidence rate of death from RTAs and to identify factors associated with death from RTAs. In modelling the number of deaths associated with RTAs and other factors on the GNR between the years 2010 and 2016 using Poisson models, the study also determined which of the models fitted the data on RTAs better. This work therefore utilizes a series of Poisson models which include among others the Poisson model, Negative Binomial (NB), Zero-Truncated Poisson (ZTP), the Zero-Truncated Negative Binomial (ZTNB) model to analyse the impacts of various explanatory variables on daily serious and fatal crash frequencies on GNR over a seven-year period (2010-2016) in Zambia. Findings of this study may assist policy makers to know and understand the areas they need to focus on in order to enhance the planning and evaluation of policies in the transport sector to prevent deaths from RTAs and to improve in the transport system in Zambia. The study will also help other researchers dealing with count outcomes to know when best to apply these models.
2. METHODS AND MATERIALS
2.1. Study Design
The study design was a cross sectional study in which secondary data was used to model the number of deaths associated with road traffic accidents on the great north road between the years 2010 and 2016.
2.2. Study Site
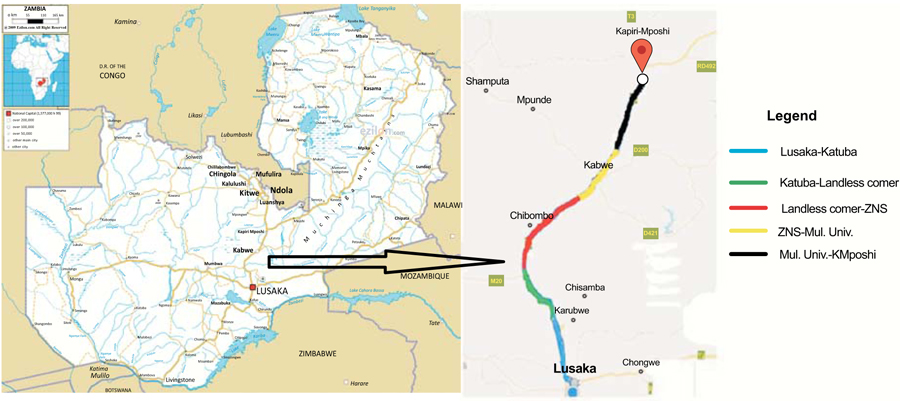
The study used secondary data on RTAs that had occurred between Lusaka and Kapiri-Mposhi highway. This data was obtained from Zambia Police traffic section at four police stations along the GNR road these include Emmasdale, Matero, Kabangwe, Chisamba, Prospect, Kasanda and Kapiri-Mposhi Police stations. The total distance from Lusaka to Kapiri-Mposhi is approximately 200.8 kilometres. This study site was selected due to the high number of deaths from accidents that have been recorded. The stretch on the GNR under study is a single carriageway, approximately 204 kilometres and was divided into five stretches (Fig. 1), this was done so as to determine which stretch of the road had a higher/lower incident rate of death as compared to other stretches. The five stretches are Lusaka to Katuba, Katuba to Landless corner, Landless corner to ZNS, ZNS to Mulungushi and Mulungushi to Kapiri-Mposhi. The five stretches are not of equal distances as these mainly depended on the coverage of these different Police stations where the data was collected.
2.3. Study Variables
The outcome variable in this study was the number of deaths. It is a count because a number of deaths are non-negative and they take whole numbers only. The explanatory variables in the study included sociodemographic factors, such as age and gender of driver. Other variables included time of accident, quarter of the year, vehicle type, cause of the accident and stretch of the road where an accident occurred. For the purposes of this study, the cause of accident in this paper refers to the fault that gave rise to a particular accident.
2.4. Sampling and Sample Size
The minimum sample size was calculated using the prevalence formula.
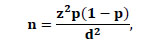 |
Where;
n=sample size, z= (1.96), d=degree of error (0.05), P= Proportion (0.5). This gave a sample size of 384.16 deaths which is approximately 385 deaths. In this study, all fatal and serious RTAs that had occurred on this stretch between the years 2010 to 2016 along the GNR (Lusaka to Kapiri-Mposhi) were considered, as a result, we had a sample size of 1, 023. This large sample size will in turn increase the power of the study to detect the size effect.
2.5. Statistical Methods
The outcome variable being the number of deaths is a count variable. The aim of regression analysis in such instances is to model the dependent variable (deaths) as the estimate of outcome using some or all of the explanatory variables (in mathematical terminology estimating the outcome as a function of some explanatory variables). In this instance, the Poisson distribution (rather than the Normal) is more appropriate since the Poisson mean is always greater than or equal zero. The normal mean can be less than zero. One of the main assumptions of the Poisson model is that the mean should be equal to the variance. However, other Poisson models which do not have the assumption of the mean being equal to the variance such as the NB, ZTP and the ZTNB were also explored so as to select the best fit model. The zero truncated models were explored in this case because there were very few accidents which had no deaths, hence the data generating process naturally truncated zero counts.
Descriptive statistical analysis was done to estimate the counts, giving frequencies and percentages. Many of the methods for count data have been advanced and these include the Poisson Model, the Zero-Truncated Poisson (ZTP), the Negative Binomial (NB) and the Zero-Truncated Negative Binomial (ZTNB). We explored all these models and the Akaike Information Criterion (AIC) and Bayesian Information Criterion (BIC) statistics were used in selecting the best fit model. The four models, the Poisson, ZTP, NB and ZTNB were compared to see which one fits the data well. All p-values reported were two-tailed, and values below 0.05 were considered statistically significant. All analyses were performed using STATA software, version 14.0 SE (Stata Corporation, College Station, TX, USA).
3. RESULTS
Due to the presence of overdispersion in the data (Variance greater than the mean), the NB model was favoured over the Poisson model. The equi-dispersion of crash data is unlikely to be truly observed, as crash-frequency data are typically overdispersed. Unobserved dispersion arises when the covariates are not fully capable of capturing the heterogeneity across the cities in the country [16]. In addition to the overdispersion of the outcome variable, the number of zeroes in the data was very minimal as most of the accidents were fatal, this is another problem often faced with count data and a more robust model such as the ZTNB model was employed. Table 1 gives the characteristics of the accidents that were analysed.
3.1. Descriptive Statistics
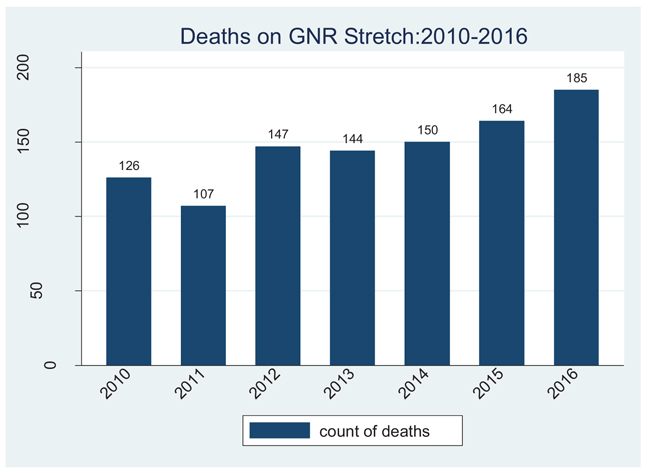
A total of 1,023 RTAs were analysed in which 1, 212 people died, 7% (82/1, 212) Juveniles and 93% (1,130/1, 212) adults. Accidents that happened as a result of pedestrians crossing the road accounted for 30% (310/1,023) and 29% (295/1,023) of the RTAs were as a result of driver’s excessive speed. The mean age of the drivers was 37 years and standard deviation of 9.7 with minimum age 15 years and maximum of 76 years. The mean deaths were 1.2 and variance was 4.6 (variance>mean, overdispersion, Poisson cannot be used). The distribution of deaths over the years is given in the bar chat (Fig. 2).
| Continuous variables | - | Total |
|---|---|---|
| Number of deaths, Median (IQR) | 1 (1, 1) | 1, 023 |
| Drivers age, mean (SD) | 37.1 (9.7) | 800* |
| Categorical Variables | Frequency (%) | Total |
| Driver’s sex: Male | 803 (96.8) | 830* |
| Female | 27 (3.3) | - |
| Quarter: Jan-Mar (1st) | 231 (22.6) | - |
| April-June (2nd) | 251 (24.5) | - |
| July-Sept (3rd) | 277 (27.1) | - |
| Oct-Dec (4th) | 264 (25.8) | 1, 023 |
| Time of accident: Early morning | 161 (15.8) | - |
| Morning | 157 (15.4) | - |
| Afternoon | 300 (29.4) | - |
| Night | 403 (39.5) | 1,021* |
| Vehicle type: Private | 466 (54.31) | - |
| Public | 134 (15.62) | 858* |
| Truck | 258 (30.07) | - |
| Cause: Crossing road | 310 (30.30) | - |
| Excessive speed/overtaking | 295 (28.84) | - |
| Cutting in/FTKNS | 175 (17.11) | 1,023 |
| Unlicensed/Inexperienced | 22 (2.15) | - |
| Hit & Run/Unknown | 221 (21.60) | - |
| Adults: Juveniles | 82 (6.77) | - |
| Adults | 1,130 (93.23) | 1,212b |
| Stretch: Lusaka-Katuba | 217 (21.21) | - |
| Katuba-Landless corner | 87 (8.50) | - |
| Landless corner-ZNS | 150 (14.66) | - |
| ZNS-Mul. University | 168 (16.42) | - |
| Mul. Univ.-K/Mposhi | 401 (39.20) | 1,023 |
3.2. Model Explorations
In order to model these traffic deaths there is need for a careful selection of one or more models that may provide a good description of the traffic type, estimation of parameters such as mean and variance for the selected models and statistical testing for selection of one of the considered models and analysis of its suitability to describe the traffic type under analysis.
Since RTAs are non-negative integers, and random event count, the distribution of such events follow a Poisson distribution. The methodologies to model accident counts are well developed. Since in this study the variance was greater than the mean, resulting in over-dispersion, the negative binomial was used we therefore applied a Negative Binomial (NB) regression model which is a Poisson-gamma mixture [17-19]. In our data the numbers of zeros were very minimal as most of the accidents had at least one person dying. Due to this, we applied the Zero-Truncated Poisson and the Zero Truncated Negative binomials. The results from these models were compared to select the best fit model for this data using Akaike Information Criterion (AIC) and Bayesian Information Criterion (BIC). The ZTNB was the best fit model which gave the lowest values of AIC and BIC. The two competing models were the ZTP and the ZTNB. The ZTP had AIC=1304.55, BIC= 1336.55 whereas the ZTNB had AIC=742.25 and BIC=819.69. This indicated that the ZTNB with the lower AIC and BIC was the best fit model for the data. (Table 2) shows the results from the best fit Model ZTNB.
| Unadjusted Estimates | Adjusted Estimates | |||||
|---|---|---|---|---|---|---|
| Variable | IRR | (95% CI) | P-value | IRR | (95% CI) | P-value |
| Driver’s age (years): | 1.04 | (1.03,1.05) | <0.0001 | 1.01 | (0.99, 1.03) | 0.358 |
|
Driver’s sex: Female Male |
Ref 4.92 |
1 (1.07, 22.58) |
1 0.040 |
Ref 9.57 |
1 (0.96, 95.46) |
1 0.054a |
|
Time:Night (7pm-12am) Early morning (1-6am) Morning (7am-12pm) Afternoon (1pm-6pm) |
Ref 2.59 5.03 1.17 |
1 (1.59, 4.24) (3.26, 7.74) (0.75, 1.84) |
1 <0.0001 <0.0001 0.489 |
Ref 2.11 1.78 0.93 |
1 (1.01, 4.41) (0.91, 3.49) (0.51, 1.70) |
1 0.048a 0.094 0.805 |
|
Vehicle type: Private Public Truck |
Ref 8.90 2.10 |
1 (5.66, 13.98) (1.37, 3.21) |
1 <0.0001 0.001 |
Ref 5.65 2.19 |
1 (2.97, 10.73) (1.25, 3.82) |
1 < 0.0001a < 0.0001a |
|
“Cause” of accident: Exces.speed/overtaking Crossing road Cutting in/FTKNS Unlicensed/Inexperience Hit&Run/Unknown Stretch: Lusaka-Katuba Katuba-Landless corner Landless corner-ZNS ZNS-Mul. Univ. Mul. Univ.-K/mposhi |
N/A Ref 0.03 0.29 1.20 2.04 Ref 4.93 20.49 7.95 8.64 |
N/A 1 (0.01, 0.09) (0.16, 0.51) (0.41, 3.55) (1.37, 3.04) 1 (2.01, 12.10) (9.57, 43.85) (3.63, 17.38) (4.15, 17.98) |
N/A 1 < 0.0001 < 0.0001 0.738 < 0.0001 1 < 0.0001 < 0.0001 < 0.0001 < 0.0001 |
N/A Ref 0.04 0.17 1.29 1.05 Ref 4.41 9.01 3.60 5.73 |
N/A 1 (0.01, 0.12) (0.07, 0.42) (0.35, 4.83) (0.60, 1.85) 1 (1.39,14.01) (3.29, 24.62) (1.33,9.74) (2.23, 14.73) |
N/A 1 <0.0001a <0.0001a 0.701 0.860 1 0.012a < 0.0001a 0.012a < 0.0001a |
3.3. Socio-demographic and Social-economic Factors
The social demographic factors that were considered in this study included age of the driver, sex of the driver and a dummy variable adults (1=adult, 0=Juvenile) whereas the accident related factors included quarter of the year the accident happened, time of accident, vehicle type, cause of accident and stretch of the road. The description of each of these factors is given in the next sub-section.
3.3.1. Age of Driver
Due to the missing data problem encountered as a result of hit and run by the drivers in this study, the complete case analysis that was used had 800 drivers information. The mean age of the drivers was 37 years, standard deviation of 9.7, minimum age 15 years and maximum age of 76 years. Fr the age variable, we found no evidence of an association between the age of a driver and having a serious or fatal crash that will lead to injury or death (IRR=1.01, 95% CI=0.99, 1.03), p-value=0.358. The sex of the driver is a crucial variable in the analysis of Road traffic crashes.
3.3.2. Quarter of the Year
The accidents in the study were evenly distributed throughout the year, 27.1 percent (277) of the accidents happened in the third quarter (July-Sept). In the fourth quarter, there were 25.8 percent happened in this particular quarter (October to December). Further, 251 (24.5%) accidents out of 1, 023 happened in the first quarter of the year (January to March). However for the inferential statistics, the quarter of the year in this study did not contribute in the final model.
3.3.3. Sex of Driver
A total of 830 drivers whose information on sex was available was abstracted of which, 803 (96.7%) were male drivers and 27 (3.30%) were female drivers. Due to the fact that these are deaths on the spot, there were instances where the sex of the driver was indicated for a particular RTA but the age of the driver for the same RTA was not indicated. This is because it is easy to identify the sex of the deceased (especially in cases where the driver dies) individual unlike knowing the age of the deceased. As a result of this, we had more observations with the sex of the driver (830) than observations with age of driver (800). The sex of the driver is a crucial variable in the analysis of Road traffic crashes. Results from this study indicated an increase rate of death if one is a male driver compared to female driver (IRR=9.57, 95% CI=0.96-95.46) with borderline evidence, p-value=0.054.
3.3.4. Time of Accident
Time of the accident in this study was categorised as Early morning, Morning, Afternoon and Night (between AM and 6AM, between 7AM and 12PM, between 1PM and 6PM and between 7PM and 12AM) respectively. With this time of the accident variable, 403 out of 1,021 (39.50%) of the accidents happened in the night between 7PM and 12AM, 29.4% (300/1021) of the accidents happened in the afternoon between 1PM and 6PM, 15.8% (161/1,021) happened in the early morning (1AM-6AM) and 15.4% (157/1,021) happened in the morning (7AM-12PM). Results further showed that driving in the early hours of the day (between 1AM and 6AM) was significantly associated with a high incidence rate of death (IRR=2.1, 95% CI=1.01-4.41), adjusting for all other variables in the model.
3.3.5. Cause of Accident
The cause of the accident in this paper refers to the fault that gave rise to a particular accident. This cause of accident included pedestrians crossing the road inappropriately, excessive speed/overtaking inappropriately by the driver, cutting in or Failure To Keep Near Side (FTKNS), unlicensed or inexperienced driver and unknown causes or cause not traced due to hit and run cases. The majority of these accidents were as a result of pedestrians crossing the road inappropriately which were at 30.30% (310/1,023). Road Traffic Accidents that were as a result of Excessive speed and overtaking inappropriately accounted for 28.84% (295/1023). Results indicated that there was a statistically significant reduction in the incidence rate of death from RTAs for pedestrians crossing road compared to excessive speed (IRR=0.04, CI=0.01-0.12), p-value<0.0001. There was also a reduced incidence of death from a RTA from cutting in or FTKNS compared to excessive speed (IRR=0.17, CI=0.07-0.42). This finding was statistically significant, p-value<0.0001.
3.3.6. Stretch of the Great North Road (GNR)
The stretch on the GNR under study is 200.8 kilometres and was divided into five stretches (Fig. 1), this was done so as to determine which stretch of the road had a higher/lower incidence rate as compared to others. The five stretches are Lusaka to Katuba, Katuba to Landless corner, Landless corner to ZNS, ZNS to Mulungushi and Mulungushi to Kapiri-Mposhi. The five stretches are not of equal distances as these mainly depended on the coverage of these different Police stations where the data was collected. The greater number of the accidents (39.20%) (401/1,023) occurred on the stretch between Mulungushi University and Kapiri-Mposhi with the fewest (8.50%), (87/1,023) being between Katuba and Landless corner (Table 1). The study further found an increased incidence of death if one is driving between Katuba and Landless corner compared to driving between Lusaka and Katuba (IRR=4.41, CI=1.39-14.01) and this was statistically significant p-value 0.012. The results also revealed that there was an increased incidence of death between Landless corner and ZNS as compared to driving between Lusaka and Katuba (IRR=9.06, CI=3.29-24.62) p-value<0.0001. There was also over five times increase in the incidence of death if one is driving between Mulungushi University and Kapiri-Mposhi compared to one driving between Lusaka and Katuba (IRR=5.73, CI=2.23-14.73), p-value<0.0001.
3.3.7. Mode of Transport
The common mode of transport on this road was private, trucks and public transport. Out of all the accidents that happened in this period, the majority 466 out of 858 (54.31%) involved Private transport whereas trucks accounted for 30.30%, (310/858). Results from the best fit model (ZTNB) revealed that public transport as compared to private transport had an increased incidence of death from RTAs (IRR=5.65, 95% CI=2.97-10.73), p-value<0.0001.
4. DISCUSSION
The incidence rate of death from RTAs was estimated in this study and factors that were associated with an increased incidence rate of death were male sex of the driver, driving in the early hours of the day, using public transport and trucks. Other factors that were associated with an increase in the incidence rate of death from RTAs included the stretch between Katuba and landless corner, Landless corner to ZNS, ZNS to Mulungushi University and Mulungushi University to Kapiri-Mposhi as compared to Lusaka to Katuba.
It has been shown in this study that the number of deaths on this stretch of the road (GNR) has been increasing over time from 2010 to 2016. One of the studies [20] has documented a high likelihood of younger drivers being involved in RTAs and this study found that young people were at a high risk of Road Traffic Injuries among car and motorcycle users, while among bicycle and public transport users, the risk was greater in older people. However in this study, there was no evidence of an association between the driver’s age and the incidence of death from RTAs.
The sex of the driver is a crucial variable in the analysis of Road traffic accidents. Results from this study indicated an increase rate of death if one is a male driver compared to female driver. This finding is with borderline statistical evidence and we cannot rule out chance finding, further the wide confidence interval is an indication that this finding is not very reliable. On the other hand, this finding established here regarding greater risk of serious and fatal injuries in males is consistent with other studies that used travel time [21] and found that males compared to females were more likely to be involved in road traffic accidents.
Driving in the early hours of the day (between 1 AM and 6 AM) as compared to driving in the night (7PM-12AM) had a significant increase in the incidence rate of death from RTAs adjusting for all other variables in the model. This increase in the incidence at these hours could be due to driver’s fatigue or excessive speed as there is less traffic in the early hours of the day. Contrary to what has been found in this study, a study by [22] in which they grouped the time as daylight and night found greater risk of injury for drivers traveling during daylight hours more than those driving at night.
The study found an increased incidence rate of death if one is driving between Katuba and Landless corner compared to driving between Lusaka and Katuba. The results also revealed that there was an increased incident of death between Landless corner and ZNS as compared to driving between Lusaka and Katuba. This increase in the incidence of death on this stretch could be as a result of the curvature, a blind spot as the road is not straight on this particular stretch. Several other studies have analysed these accident-prone road sections [23], considered one of the basic steps to reduce road accident rates. In this direction, several methods to identify blackspots have been proposed which include accident frequency method; accident rate methods; quality control method; empirical Bayesian method; and many more [24-28]. Further, Geographical Information Systems (GIS) have been incorporated in the analysis of blackspots [23] the effectiveness of blackspot programs has been evaluated in different countries [29, 30] and it still remains as an active field of research. Further research is needed in Zambia on these blackspots especially on the highway roads.
Results also revealed that Public transport compared to private transport had an increased incidence of death from RTAs, this finding was statistically significant. Similar Studies done in developing countries also show that public (that is, bus/minibus) transport has serious safety concerns as a result of frequent involvement in severe accidents [31]. In these countries, bus/minibus accidents are rampant with alarming consequences [32, 33]. This could have been due to the fact that private vehicle owners tend to be more careful on the roads as compared to bus drivers as the later drive long distances and are fatigued hence they are prone to have a crash. This finding is important to influence government policy so as to limit the number of kilometres as well as the number of hours a public vehicle driver can handle in a day to reduce on numbers of RTAs. The study further showed that the ZTNB fits the fatal and serious accident data well as compared to the ZTP, NB and poisson models. This finding is in agreement with findings from [34] where the ZTNB model when applied to total number of vehicles involved in the accident and the number of casualties in a particular accident, ZTNB was found to be the best fit model compared to other models.
CONCLUSION
The study showed that there was an increased incidence of death if the driver is male, driving in the early hours (1AM-6AM) of the day and using public transport. There is also an increased incidence of death if one is driving between landless corner and ZNS compared to driving between Lusaka and Katuba. The study further revealed that the ZTNB is the best fit model for data in which there are few zeros as is the case with serious and fatal RTAs. The majority of these accidents on this particular stretch happen as a result of human error which include excessive speed, FTKNS to mention but a few.
RECOMMENDATIONS
From the findings of this study, expansion of highways like GNR is highly recommended as the number of vehicles in the country has been increasing while the roads have remained the same. As a result of this, there is heavy traffic on this stretch especially on peak hours and inpatient drivers tend to overtake unnecessarily especially on blind spots and this lead to RTAs. This high number of RTAs could be due to lack of enough pedestrian crossing on this highway especially in built-up areas like Chibombo and Kabangwe areas. There is a need for massive sensitization to citizens especially pedestrians as most of these deaths are as a result of pedestrians crossing the road inappropriately. There is a need for the Road development Agency to put speed humps especially in built-up areas, such as Chibombo and Kabangwe areas. The government needs to limit drivers on the number of kilometres one can drive per day as driving more kilometres result in RTAs.
LIMITATIONS OF THE STUDY
The study had limitations as the data used was collected for different purposes and not specifically to answer our research questions. As a result of this, problems encountered included having inaccurate/missing data on the observations and some vital variables such as drinking of alcohol/use of drugs while driving and use of hand held mobile phones whilst driving. Administrative data, which is not originally collected for research, were not available in the usual research formats and in this case the variables to consider were limited to the variables that were found and as recorded by the ZP traffic division. Despite these limitations, the study sample was large enough to make inferences and also considering the years of these accidents, a good number accidents for different periods/times were captured in this study. Statistical theory suggests that the larger the sample, the more reliable the estimates are going to be with respect to the population where the data arises from. Hence we used this principle in analysing a larger sample than the minimum sample size calculation suggested. The methodologies that were employed in this study were robust methods and are appropriate methods for modelling count data.
LIST OF ABBREVIATIONS
| CI | = Confidence Interval |
| DALYs | = Disability Adjusted Life Years |
| FTKNS | = Failure To Keep Near Side |
| GNR | = Great North Road |
| GIS | = Geographic Information System |
| MVC | = Motor Vehicle Collision |
| NB | = Negative Binomial |
| RTAs | = Road Traffic Accidents |
| WHO | = World Health Organisation |
| ZP | = Zambia Police |
| ZIP | = Zero Inflated Poisson |
| ZTNB | = Zero Truncated Negative Binomial |
| ZTP | = Zero Truncated Poisson |
AUTHORS CONTRIBUTIONS
RF came up with the idea on the research area (RTAs), RF and PM designed the research problem. RF acquired the data, performed the analysis, and drafted the manuscript with the help of PM. CN and CM helped extensively in editing the work. All authors discussed the results and implications and commented on the manuscript at all stages. All authors contributed extensively to the work presented in this paper. All authors read and approved the final manuscript.
AVAILABILITY OF DATA AND MATERIAL
The data used for this study can be obtained by requesting the Zambia Police, Headquarters.
FUNDING
This study was supported through the DELTAS Africa Initiative Sub-Saharan Africa Consortium for Advanced Biostatistics (SSACAB) (Grant No. 107754/Z/15/Z). The DELTAS Africa Initiative is an independent funding scheme of the African Academy of Sciences (AAS) Alliance for Accelerating Excellence in Science in Africa (AESA) and is supported by the New Partnership for Africa’s Development Planning and Coordinating Agency (NEPAD Agency) with funding from the Wellcome Trust (Grant No. 107754/Z/15/Z) and the UK government. The views expressed in this publication are those of the authors and not necessarily those of the AAS, NEPAD Agency, Wellcome Trust or the UK government.
ETHICS APPROVAL AND CONSENT TO PARTICIPATE
Ethical clearance for this study was provided by the UNZABREC Board reference number 021-06-17, the Inspector General of Police Ministry of Ministry of Home Affairs Headquarters.
HUMAN AND ANIMAL RIGHTS
No animals/ humans were used for the studies that are basis of this research.
CONSENT FOR PUBLICATION
Not applicable.
CONFLICT OF INTERESTS
The authors declare no conflict of interest, financial or otherwise.
ACKNOWLEDGEMENTS
We thank, with deep appreciation, the Zambia Police Headquarters through the Inspector General of Police for giving us access to this accident data in their books.
PM would like to acknowledge that some of his time is supported by the Research Council of Norway through its Centres of Excellence Scheme to the Centre of Intervention Science in Maternal and Child Health (CISMAC; project number 223269) and through the Global Health and Vaccination Programme (GLOBVAC; project number 248121). In addition, some of his time is also supported by the welcome trust; the Department for International Development; the Alliance for Accelerating Excellence in Science in Africa (DELTAS) Grant Number: [107754/Z/15/Z]. None of these organisations has contributed in any way in writing of this manuscript; any error arising in this publication is thoroughly the author’s problem.

