All published articles of this journal are available on ScienceDirect.

An Analysis of Health Insurance Data Using the Directed Acyclic Graph: An Application in Nigeria
Abstract
Background:
In this study, we used the total amount of insurance claims from patients in Nigeria as the data to investigate the direct and indirect effects of the diagnoses.
Methods:
We applied the Directed Acyclic Graph (DAG) with the total amount of the claims for each month for 89 diagnoses using datasets drawn from private insurance companies in Nigeria from January 2015 to September 2016, which provided 21 records for each diagnosis.
Results:
The result from DAG showed three pairs of direct effects: (1) Absolute Neutrophil Count (ANC) had a direct effect on appendectomy, (2) Sexually Transmitted Infections (STIs) had a direct effect on caesarean section, and (3) Glaucoma had a direct effect on insomnia.
Conclusion:
The most interesting result pertained to the third pair of diagnoses which is pertinent to research worldwide. We not only explored the relationship in a scientific way, but also the direction of the effect provided a basis for recommendations for healthcare in Nigeria and worldwide.
1. INTRODUCTION
In the present study, the Directed Acyclic Graph (DAG) was used for the first time to analyze health insurance data. The objective was to find relationships between 89 diagnoses in reference to health insurance data from Nigeria. Unlike regression analysis, a classical method was used to explore relationships between variables, and DAG had the key advantage of establishing the direction of the relationships identified.
Established techniques that had been used to analyze insurance data included neural networks [2-6], decision tree [7, 8], association rules [9], Bayesian network [10], and genetic algorithms [11, 12]. However, these techniques were used primarily for detecting fraud, not for investigations related to healthcare. In addition, researchers applied other techniques such as naïve Bayes to evaluate the risk to people carrying life insurance [13], association rules, neural segmentation to detect patterns in pathology services ordered, and to classify general practitioners into groups based on the nature and style of their practice [14].
In our application of DAG to health insurance data, the most interesting result in terms of the 89 diagnoses is that glaucoma has a direct effect on insomnia. Research studies have been undertaken worldwide [15-25] focusing on relationships between these two symptoms, but most theories have yet to be subjected to adequate scientific testing [26]. In addition to identifying this relationship, we considered possible reasons for it, including the possibility that the medication used to treat glaucoma may cause insomnia, which is covered in the discussion section.
2. DATASET
This study is based on monthly health insurance data from the information technology department of a local Health Management Organization (HMO) in Nigeria. Covering the period from January 2015 to September 2016, the original data consisted of private insurance company and federal (Nigerian Health Insurance Scheme (NHIS)) records. However, we limited our analysis to the data drawn from the private sector because this sector had a much larger number of claims than the federal sector. It should be noted, however, that we did not have access to demographic information, such as the age and sex of the people who had made the claims.
We summarized the data by finding the total monetary amount of the claims made each month for each diagnosis. Numerous diagnoses had claims totaling less than 100,000 Nigerian Naira for the focal period, and we eliminated these diagnoses from the analysis. For the focal period, one U.S. dollar was equal to 727,415 Naira and 727,776 Naira, in 2015 and 2016, respectively. The diagnoses for each of which all the claims made fell short of 100,000 Nigerian Naira and a few claims with unclear definitions were eliminated. 89 diagnoses remained for the analysis. The variables of interest in our analysis were the total monetary amount of the claims made each month for each of the 89 diagnoses, for which we had monthly data over the 21-months period from January 2015 to September 2016. Therefore, there were 21 observations for 89 variables. The 89 variables considered in the study are listed in Table 1.
3. MATERIALS AND METHODS
In this study, we focused on exploring the relationship between diagnoses based on insurance data in a scientific way. We were interested in both; discovering any relationship that existed, and determining the directions of those relationships, specifically in regard to the direct and indirect effects of one diagnosis on another.
In this section, we constructed a Directed Acyclic Graph (DAG) (also referred to as a Bayesian network [27, 28]) to help identify the direct and indirect effects between the total monetary amount of the claims each month for each of 89 diagnoses on each other as found in an investigation of private insurance data in Nigeria for the focal period. A number of algorithms exist for constructing DAGs, falling essentially into three categories: Constraint-based algorithms, Greedy Search (GS) algorithms [29], and score-based algorithms [30].
| Variable | Total Amount of Claims each Month for Diagnosis | Variable | Total Amount of Claims each Month for Diagnosis | Variable | Total Amount of Claims each Month for Diagnosis |
|---|---|---|---|---|---|
| x1 | Abdominal pain | x31 | Diarrhoea | x61 | Mss pain/myalgia |
| x2 | Allergy | x32 | Dyspepsia | x62 | Muscle spasms |
| x3 | Amenorrhea | x33 | Ear wax impaction | x63 | Myopia |
| x4 | Anaemia | x34 | Enteritis | x64 | Neonatal jaundice |
| x5 | ANC (absolute neutrophil count) | x35 | Family planning | x65 | Neonatal sepsis |
| x6 | Appendicectomy (appendectomy) | x36 | Food poisoning | x66 | Normal delivery |
| x7 | Appendicitis | x37 | Gastritis | x67 | Otitis media |
| x8 | Arthralgia | x38 | Gastroenteritis | x68 | Ovarian cyst |
| x9 | Arthritis | x39 | Gingivitis | x69 | Paronychia/whitlow |
| x10 | Asthma | x40 | Glaucoma | x70 | Pelvic inflammatory disease |
| x11 | Boil/furunculosis | x41 | Haemorrhoids | x71 | Peptic ulcer disease |
| x12 | Breast lump | x42 | Heartburn/GERD | x72 | Pharyngitis |
| x13 | Bronchitis | x43 | Helminthiasis | x73 | Pneumonia |
| x14 | Burns | x44 | Hepatitis | x74 | Presbyopia |
| x15 | Caesarean section | x45 | Hernia | x75 | Pterygium |
| x16 | Carbuncle | x46 | Hyperemesis gravidarum | x76 | Road traffic accident |
| x17 | Cellulitis | x47 | Hyperlipidemia | x77 | RTI (respiratory tract infection) |
| x18 | Cervical spondylosis | x48 | Hypertension | x78 | Sepsis |
| x19 | Chicken pox | x49 | Immunization | x79 | Sprain/fracture |
| x20 | Circumcision/ear piercing | x50 | Impetigo | x80 | Sexually transmitted infection (STI) |
| x21 | Cold/catarrah | x51 | Infertility | x81 | Stress |
| x22 | Colitis | x52 | Injury | x82 | Tension headache |
| x23 | Conjunctivitis | x53 | Insomnia | x83 | Threatened abortion |
| x24 | Constipation | x54 | Lipoma NOS | x84 | Tonsilitis |
| x25 | Consultation/review | x55 | Lower respiratory tract infection (LRTI) | x85 | Typhoid fever/enteric fever |
| x26 | Coryza/allergic rhinitis | x56 | Lumbar spondylosis | x86 | Urinary tract infection (UTI) |
| x27 | Cyesis | x57 | Malaria fever/plasmodiasis | x87 | Upper respiratory tract infection (URTI) |
| x28 | Dental caries | x58 | Measles | x88 | Uterine myoma/fibroid |
| x29 | Dermatitis | x59 | Menorrhagia | x89 | Vaginal candidiasis |
| x30 | Diabetes mellitus | x60 | Miscarriage | - | - |
We employed an algorithm implemented by the Bayesialab software (http://www.bayesia.com). Note that all the variables are discretized in the Bayesialab implementation. We tried all the search algorithms available in the Bayesialab software—which included Maximum Spanning Tree, Taboo, EQ, SopEQ, and Taboo Order—and found that they all yielded the same results.
4. RESULTS
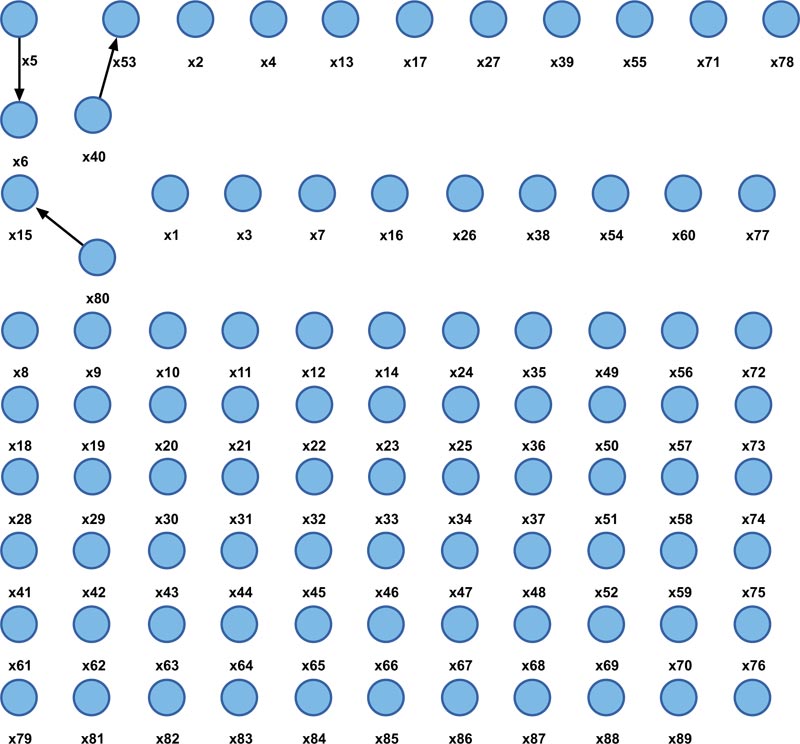
Our analysis on the total monetary amount of claims each month for each of the 89 diagnoses are represented by x1–x89. The results from DAG are shown in Fig. (1).
In Fig. (1), a direct effect is identified for only three pairs of the 89 diagnoses. In the first pair, ANC (absolute neutrophil count) (x5) had a direct effect on appendectomy (x6). In the second pair, STIs (sexually transmitted infections) (x80) had a direct effect on caesarean section (x15). In the third pair, glaucoma (x40) had a direct effect on insomnia (x53).
The relationship between the first pair, ANC and appendectomy, is easily understood given that a high ANC value is an inflammation marker that indicates the need for an appendectomy procedure [31]. As stated by Al-Gaithy, ANC and the preoperative evaluation of white blood cells (WBCs) are certainly the most widely used references in determining the severity of acute appendicitis [32].
For the second pair, STIs and caesarean section, the relationship can be explained by the recommendation from the Centers for Disease Control and Prevention (CDC) according to which pregnant women who have been diagnosed with an STI should give birth by caesarean section. As indicated in the CDC’s treatment guidelines for sexually transmitted diseases, “Cesarean section is recommended for all women in labor with active genital herpes lesions or early symptoms, such as vulvar pain and itching” [33, 34].
For the relationship between the third pair, glaucoma and insomnia, related studies connect Obstructive Sleep Apnea (OSA), a very common sleep disorder, with a number of eye diseases, including glaucoma, the second leading cause of blindness worldwide [26].
5. DISCUSSION
Several studies link OSA to glaucoma. McNab [15] and Robert et al. [16] noticed the occurrence of primary open angle glaucoma or POAG, the most common type of glaucoma, in groups of patients with OSA and floppy eyelid syndrome. Further, researchers have shown that this kind of glaucoma co-occurs with OSA [17-24]. In these studies, 20 to 57% of the sample of patients with POAG or Normal-Tension Glaucoma (NTG), another common kind of glaucoma, were also diagnosed with OSA. In other studies of patients with OSA, researchers have estimated that 2 to 27% of this population have POAG or NTG, as compared with an estimate of 2% in the general population [24, 26]. In addition, Seixas et al. investigated the relationship between visual impairment, insomnia, and anxiety/depression symptoms among Russian immigrants [25]. The results show that after the data were adjusted for the effect of anxiety/depression symptoms, those with a visual impairment were twice as likely as those without a visual impairment to report insomnia.
Most of the previous work has shown that many patients with OSA also have glaucoma. However, none of the work has shown the direction of this relationship.
In this study, the new technique, DAG, is used for the first time in the literature to explore relationships and their directions between diagnoses based on health care insurance data from the private sector in Nigeria in a scientific way. We found that glaucoma had a direct effect on insomnia. With this direction, a factor that may cause a direct effect from glaucoma to insomnia is the medication used for patients with certain kinds of glaucoma. It should be noted, too, that beta-blockers, which are often used to treat glaucoma [35], can cause insomnia [36-38].
CONCLUSION
Given the evidence of a relationship between glaucoma and insomnia found in the present study, future research should focus on investigating (i) The prevalence rate of insomnia among patients with glaucoma in Nigeria, (ii) The medication used to treat glaucoma in Nigeria, and (iii) The effects of this medication. Based on this research, physicians who treat patients with glaucoma have a basis for educating patients in regard to possible adverse reactions [35]. Research in this area could be extended to include a consideration of the medication used to treat glaucoma in Nigeria and worldwide.
ETHICS APPROVAL AND CONSENT TO PARTICIPATE
Not applicable.
HUMAN AND ANIMAL RIGHTS
Not applicable.
CONSENT FOR PUBLICATION
Not applicable.
AVAILABILITY OF DATA AND MATERIALS
The data supporting the findings of the article is available from corresponding author [P.C] upon reasonable request.
FUNDING
None.
CONFLICT OF INTEREST
The authors declare no conflict of interest, financial or otherwise.
ACKNOWLEDGEMENTS
Declared none.

