All published articles of this journal are available on ScienceDirect.

Health Expenditure Difference according to Individual Copayment in National Health Insurance System
Abstract
Background:
South Korea adopt a mandatory national health care system covering all citizens and consisting of the National Health Insurance System (NHIS) and Medical Aid Program (MAP), which cover individuals of non-low and low Socioeconomic Status (SES), respectively.
Objective:
We investigated and compared the medical expenses per claim in South Korea for SES individuals, to predict health care expenditure and provide fundamental data regarding care for individuals with limited finances.
Methods:
The inpatient data on NHIS and MAP beneficiaries were derived from the National Health Insurance Statistical Annual Report of South Korea from 2011 to 2015. Medical expenses per claim for the NHIS and MAP were investigated by gender and age, and the ratio of expenses per claim under MAP to that under NHIS was calculated.
Results:
The ratio from 2011 to 2015 was consistently larger than 1 and increased at an inconsistent rate with each consecutive age group until 30-39 years, and decreased thereafter (Males: 1.09-3.47, Females: 1.07-1.95).
Conclusion:
The results of this study indicated that higher medical expenditures and longer durations of claim in the low SES group may become obstacles to developing a sustainable health care system. The government should induce social activities of working-age low-SES people to reduce the burden on the government and help them lead a healthy life.
1. INTRODUCTION
South Korea has been encountering socioeconomic changes and medico-social problems [1-3]. The national health care system covers the entire population by way of the National Health Insurance System (NHIS) and Medical Aid Program (MAP). The NHIS covers all citizens except MAP beneficiaries and is managed comprehensively in the form of compulsory social insurance. The NHIS is mainly financed by contributions from the insured and subsidies from the government [4, 5]. The government's medical benefit program, MAP, is a form of public assistance to secure the minimum livelihood of low-income households, and to assist with self-help by providing medical services funded by governments, to bring this group of people at par with those in the non-low income brackets in terms of access to medical services [4].
The relationship between Socioeconomic Status (SES) and health has been under scrutiny for a long time [1, 6-9]. As many countries demonstrate socioeconomic stratification, it is critical to provide people of low SES equitable access to a certain level of health care services at an affordable cost [1, 2, 10-12]. Ameliorating and distributing health care expenditure efficiently is important for setting up a sustainable health care system in these countries.
The purpose of this study is to investigate and compare the medical expenses for the SES, using data regarding the medical expenses per claim and/or day for beneficiaries of both the NHIS and MAP in South Korea, so as to predict health care expenditure and provide fundamental data to effectively channelize the limited finances available.
2. MATERIALS AND METHODS
2.1. Conceptual Description
Medical expense in South Korea refers to the total valid cost incurred during treatment. This is the sum of the copayment made by the patient as well as the insurance benefit paid by NHIS. The latter refers to the amount paid by the insurer (NHIS) to the provider (medical institute), out of the total medical fee determined under law, excluding the copayment made by the patient. Under MAP, medical expense refers to the sum of the amount paid by the medical aid fund and the copayment made by the patient. MAP beneficiaries pay 0-15% of the share of the medical cost, as per the grade determined by MAP and the medical institution. Therefore, MAP beneficiaries gain equitable access to health care services at little or no cost [4]. An eligible recipient of medical benefits shall be a person who has no obligatory provider, has obligatory providers that are practically unable to provide support, or is unable to receive support by obligatory providers, and whose recognized income is smaller than the amount determined through the deliberation and resolution by the Central Livelihood Security Committee. In such cases, the medical benefit selection standard shall be at least 40/100 of the standard median income [13].
2.2. Subjects
The data were sourced from the part of the National Health Insurance Statistical Annual Report of South Korea that contains medical statistical information from 2011 to 2015, accessible on its website (http://www.hira.or.kr). In 2015, the number of beneficiaries under NHIS was about 50.5 million, that of class I MAP was about 1.08 million, and class II was 0.465 million (Table 1).
3. RESULTS
3.1. Medical Expenses Per Claim
The ratio of medical expenses per claim under MAP to that under NHIS from 2011 to 2015, was consistently larger than 1 (1.85 to 1.90). When patients' copayments were excluded, the ratio increased from 2.43 to 2.49. The ratio of medical expenses per claim for male beneficiaries of MAP to that of NHIS was 2.13 to 2.20. When patients' copayments were excluded, the ratio reached 2.79 and 2.87. In females, the ratio was in the range of 1.67 and 1.71. When patients' copayments were excluded, the ratio reached 2.21 and 2.26. Males spent 1.12 to 1.16 times as much as females did under the NHIS. In MAP, the medical expenses per claim for males were 1.41 to 1.50 times as much as that of females (Table 2).
MAP, Medical Aid Program; NHIS, National Health Insurance System; MAP(A): Medical expenses per claim under MAP; NHIS(A): Medical Expenses per claim under NHIS; MAP(B); Medical expenses per claim under MAP, excluding copayments; NHIS(B): Medical expenses per claim under NHIS, excluding copayments.
3.2. Medical Expense Ratio Per Claim of MAP to NHIS by Gender and Age
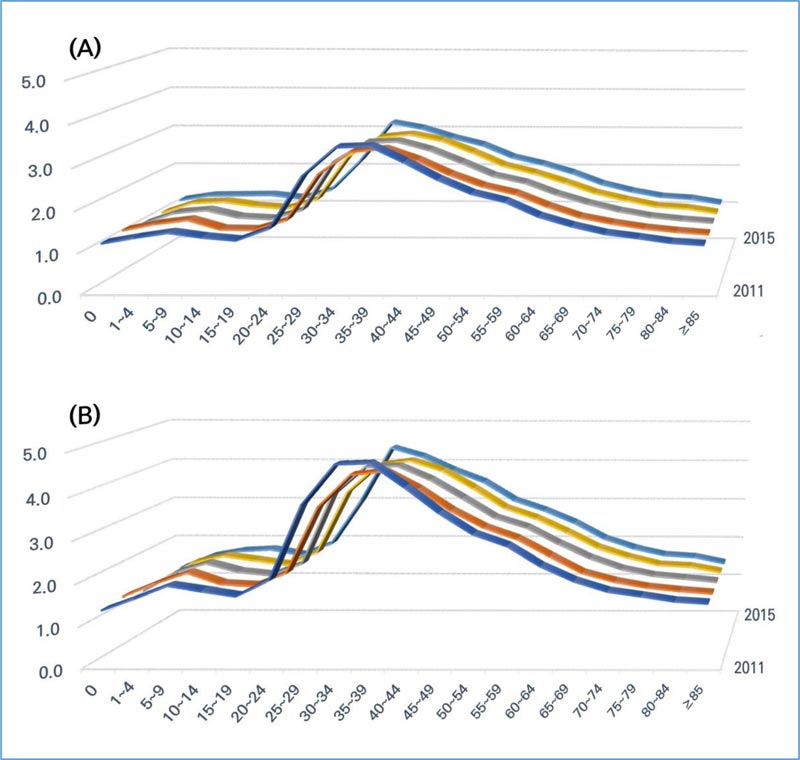
The MAP to NHIS ratio of medical expenses for male was more than 1 in all age groups and all years. The ratio remained relatively constant within the range of 1.0 and 1.5 in the age groups of 12 months after birth to 24 years, and from 70 to more than 85 years. There was a sharp increase in the 25 to 29, and peaked in the 35 to 39, with a value of more than 3.0. After that, the ratio decreased steadily as people grew older. When the patients' copayment was not included, the ratio was greater than 1.5 in all age groups, except that of 12 months, and more than 85 years. There was a peak in the 30 to 39, which had a value of more than 3.0 (Fig. 1).
| - | 2011 | 2012 | 2013 | 2014 | 2015 |
|---|---|---|---|---|---|
| NHIS | 49,299 | 49,662 | 49,990 | 50,316 | 50,490 |
| MAP Class 1 | 1,087 | 1,058 | 1,039 | 1,036 | 1,078 |
| MAP Class 2 | 522 | 449 | 419 | 404 | 465 |
| Total | 50,908 | 51,169 | 51,448 | 51,756 | 52,033 |
| Sex | Class/Year | 2011 | 2012 | 2013 | 2014 | 2015 |
|---|---|---|---|---|---|---|
| Total | MAP(A) | 69,203 | 66,680 | 71,609 | 75,909 | 80,397 |
| NHIS(A) | 36,859 | 36,005 | 37,975 | 40,012 | 42,826 | |
| Ratio | 1.88 | 1.85 | 1.89 | 1.90 | 1.88 | |
| Male | MAP(A) | 87,779 | 82,642 | 88,116 | 92,930 | 97,360 |
| NHIS(A) | 39,933 | 38,704 | 40,685 | 42,773 | 45,683 | |
| Ratio | 2.20 | 2.14 | 2.17 | 2.17 | 2.13 | |
| Female | MAP(A) | 58,328 | 56,881 | 61,299 | 65,036 | 69,237 |
| NHIS(A) | 34,565 | 33,976 | 35,927 | 37,926 | 40,653 | |
| Ratio | 1.69 | 1.67 | 1.71 | 1.72 | 1.70 | |
| Total | MAP(B) | 68,017 | 65,613 | 70,497 | 74,775 | 79,178 |
| NHIS(B) | 27,602 | 26,947 | 28,459 | 30,036 | 32,075 | |
| Ratio | 2.46 | 2.43 | 2.48 | 2.49 | 2.47 | |
| Male | MAP(B) | 86,402 | 81,455 | 86,896 | 91,707 | 96,054 |
| NHIS(B) | 30,055 | 29,110 | 30,652 | 32,278 | 34,409 | |
| Ratio | 2.87 | 2.80 | 2.83 | 2.84 | 2.79 | |
| Female | MAP(B) | 57,254 | 55,887 | 60,254 | 63,959 | 68,076 |
| NHIS(B) | 25,770 | 25,321 | 26,802 | 28,342 | 30,299 | |
| Ratio | 2.22 | 2.21 | 2.25 | 2.26 | 2.25 |
MAP, Medical Aid Program; NHIS, National Health Insurance System.
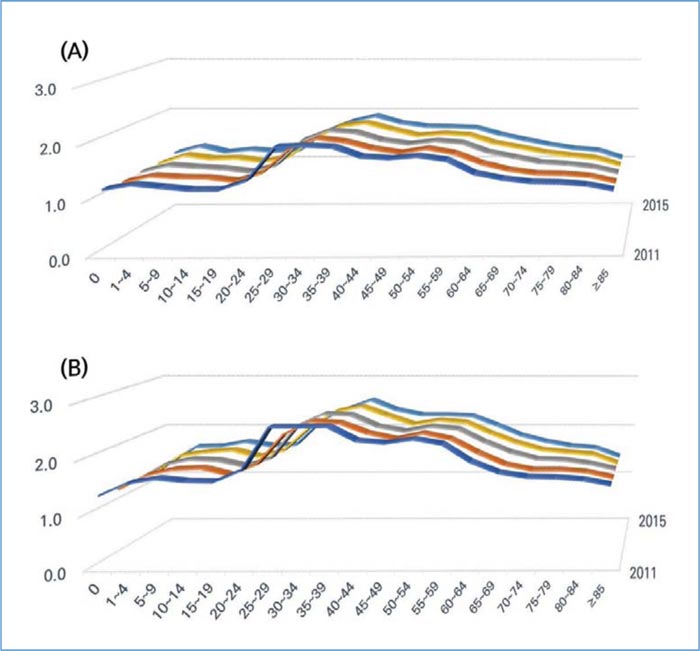
The ratio was more than 1 in all age groups and all years in the case of females. The ratio remained relatively constant within the range of 1.0 to 1.5 in the 12 months to 24 years, and 65 to more than 85 years. There was an increase in the 25 to 29, and this remained constant till the 55 to 59. After that, the ratio decreased steadily within the range of 1.0 to 1.5 as people grew older. When patients' copayment was not included, the ratio was greater than 1.5 in all age groups except that of 12 months, and more than 85 years. There was an increase in the 25 to 39, with a value of around 2.5. After that, the ratio decreased steadily to about 1.5 as people grew older (Fig. 2).
3.3. Ratio of Medical expense per claim by gender and Age and Day
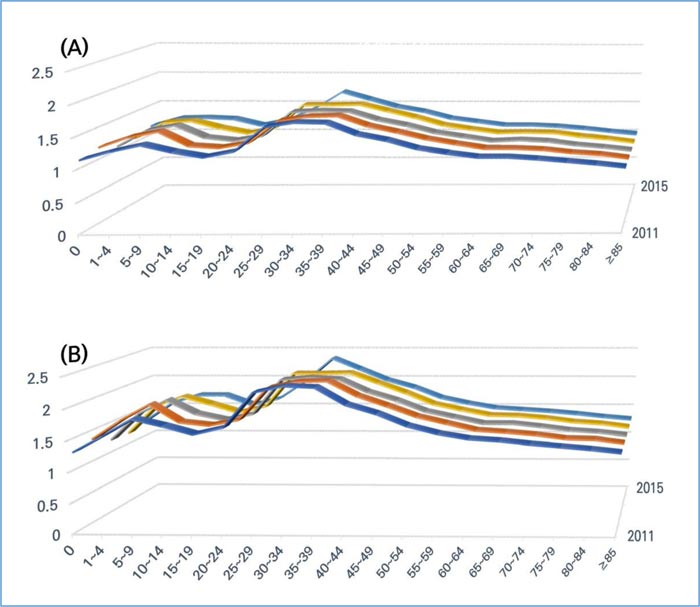
The ratio of medical expenses per claim by age and day in males was more than 1 till the 80 to 84 age group. The ratio remained relatively constant within the range of 1.0 to 1.2 in the 12 months, 15 to 19, and more than 65. There was an increase in the 25 to 29 to more than 1.4, which remained 35 to 39. After that, the ratio decreased steadily as people grew older. When patients' copayment was not included, the ratio was greater than 1 in all age groups. The ratio remained within the range of 1.0 to 1.5 in the 12 months, and more than 65. There was an increase of the ratio to more than 2.5 in the 25 to 29, which remained till the 35 to 39. Then, it decreased gradually (Fig. 3).
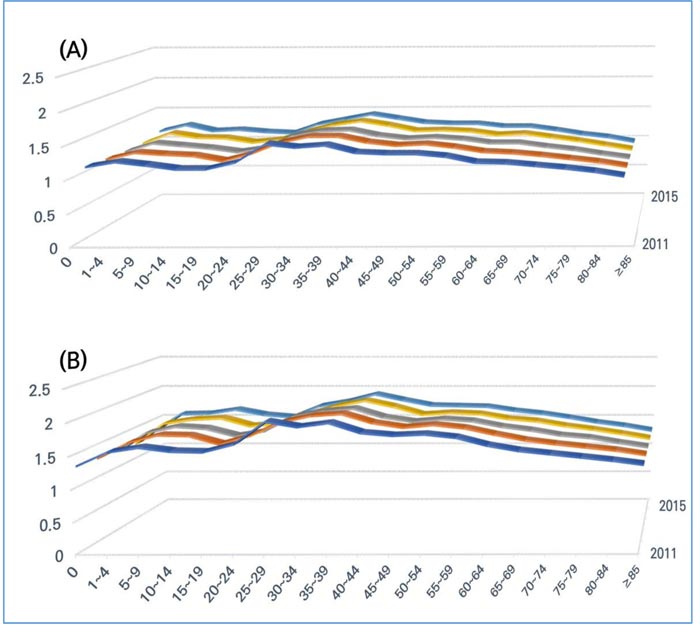
The ratio in females was more than 1 till the 80 to 84 (2011-2015). The ratio remained relatively constant, within the range of 1.0 to 1.2 in the 12 months, 5 to 24, and more than 70. There was an increase in the 25 to 29 to around 1.4, which remained till the 35 to 39. After that, the ratio decreased steadily as people grew older. When patients' copayment was not included, the ratio was greater than 1 in all age groups. The ratio remained within the range of 1.0 to 1.5 in the 12 months and more than 75 age group. There was an increase of more than 1.5 in the 25 to 29, which remained till the 35 to 39. Then it decreased gradually (Fig. 4).
MAP, Medical Aid Program; NHIS, National Health Insurance System.
MAP, Medical Aid Program; NHIS, National Health Insurance System.
MAP, Medical Aid Program; NHIS, National Health Insurance System.
4. DISCUSSION
Medical expenses for public health care in low SES are mostly financed by the government using general revenues [4]. In South Korea, as per the reports from NHIS, the number of MAP beneficiaries, which occupy about 3% of that of NHIS, spend 10-14% of the medical expenses of NHIS. If patients’ copayments are not included, MAP beneficiaries spend up to 13-18% of NHIS [5]. In this study, medical expenses per claim were higher in MAP than in NHIS. We inferred the following regarding these findings. First, NHIS beneficiaries might spend more undetected money for their own care than MAP beneficiaries. Low-SES people may not be able to afford to pay uncovered medical services, unlike non-low SES people. Secondly, the moral hazards associated with low SES patients and the medical professionals caring for them would cause excessive expenditure. Low SES patients may be able to receive a longer duration, and better quality of medical services, covered by the government, at little or no cost to themselves [2, 14, 15]. Many of them may find respite in the hospital, and skilled help with daily activities, that is unavailable elsewhere, and hence, prefer to remain admitted in hospitals [2, 14]. From the point of view of medical professionals, this could maximize their profits with little or no burdens to treat low SES patients. Some reports mention that low SES patients are more likely to return to the hospital after discharge, hence requiring multiple hospitalizations for any given illness. They express concerns that this pattern of use is costly for the health care system [14-16]. Several reports men- tion that low SES has been linked to low health status [17-21]. In this study, we found that MAP beneficiaries representing low SES usually spent more to care for their own health status, which became a burden for the government. This could be a hindrance to a sustainable health care system.
The ratio of the medical expenses per claim under MAP to that under NHIS was more than 1.0 in all age groups. In the 30 to 39 age group, this ratio reached more than 4.0 in males. This means that the medical expenditure per claim is higher in the working age group in low SES. Considering that the government takes on almost the entirety of the financial burden in low-SES people, two to four times the financial burden as that spent by NHIS beneficiaries could be a serious challenge to the health care system. Thus, we investigated the medical expenses per claim and day by gender and age. This was higher in MAP than in NHIS, but not to the same extent as in the case of medical expenses per claim. For example, while the peak ratio of medical expense per claim in males of the 35 to 39 age group was more than 3.0, the ratio added by factor-day did not reach beyond 1.8. From these results, it can be inferred that a longer duration is required for the management of treatment of MAP beneficiaries than NHIS beneficiaries.
Billings et al. (1993) report that the incidence of asthma in low-income group areas is 6 to 12 times that of high-income groups in the 25 to 64 age group. The admission rate for pneumonia is also higher in the low income and working (24 to 44) age group [16]. Although it is still unclear whether a higher incidence of certain diseases in low SES working age groups is directly linked to higher medical expenditure per claim, this tendency could lead to higher medical expenditure in the low SES group if the severity and costs remain the same. There are two pathways for the association of SES and health. One is that SES influences health status (social causation) [22, 23] and vice versa (social drift or selection) [24]. Although there is some reciprocal interaction between SES and health, social drift is more likely for diseases with early onset, that have more profound effects on life [24, 25]. In this study, these two pathways may explain the reasons for which working age patients in the low SES group incurred more medical expenditure per claim. In either situation, SES is more deeply linked to young and middle-aged groups in MAP than any other age group in MAP, and all age groups in NHIS [26]. A few studies reported the relationship between education, income, and occupation and SES. Arnold et al. (1990) reported that the total medical charge for hospitalization is lower in long education period, high income, and skilled or professional occupation patients [27]. Therefore, the medical expenses of MAP patients representing low-SES, most of whom have usually short education period, low income, and manual occupation will be higher than that of NHIS. However, analysis of the relationship of social activity and abnormal medial expense of the working age group of NHIS and MAP was not clearly identified in this study. Further investigation is required for this purpose.
Medical expenses per claim in MAP compared with NHIS were higher in males by gender and in non-elderly groups by age. This state was associated with both, high medical expenditure per claim by day and a longer duration of medical care. Medical expenses per claim do not truly compare to medical expenditure according to SES. There are more factors affecting medical expenses, such as cost for non-covered services, and medical expenditure for certain medical services for various diseases. The beneficiaries of MAP are also eligible for basic living security. Thus, an increase in income above a certain level means a drop in the eligible population. This makes it difficult for the beneficiaries of MAP to actively participate in economic activities and may be the reason why hospitalization and discharge are repeated even with minor diseases. In addition, low-SES people are expected to spend less on uncovered items in MAP, because their purchasing power is low. So, it is estimated that they will spend more on covered items than NHIS, which has the ability to purchase uncovered items. In the non-low SES of working ages, proper diet and exercise can prevent diseases, and early detection of diseases through health check-ups can be the cause of reducing medical expenses for covered items. The increase in medical expenses and the loss of labor in these working ages can be a national burden. In order for low-SES people to actively participate in social activities and lead a healthy life, the government should research ways to protect the vulnerable through various methods other than medical expenses based on income standards. In addition, it will be necessary to check the MAP/NHIS for the same disease group of the working ages and to identify other socio-economic, psychological, and personal factors in addition to the factors caused by the medical necessity to reduce the increasing medical expenses. Although this study did not verify the reasons for which medical expenses per claim in low SES of the working age group are high, we found the pattern of medical expenses of SES by sex and age when medical services are uniform irrespective of SES in South Korea, in which medical expenses for low SES were supported by Government.
Unfortunately, this study did not examine uncovered items and private insurances which guarantee co-payments. We did not compare the baseline status of NHIS and MAP, which may act as a causal factor for high medical expenditure; we simply compared the two groups as surrogates for SES. Despite these limitations, we used national data covering the entire population of South Korea. We also discovered the patterns of medical expenditure by gender, age, and SES.
CONCLUSION
High medical expenditure per claim by day and longer duration of medical care in low SES could become an impediment to a sustainable health care system. To improve the health status of low-SES people, efficient distribution of health care expenditure and the creation of a sustainable health care system is required. The reasons for which male and non-elderly low SES patients incur larger medical expenditures should be further investigated. To this end, the medical expenses of the same age group for the same disease group should be analyzed. In addition, the government should induce social activities of working-age low-SES people to reduce the burden on the government and help them lead a healthy life.
LIST OF ABBREVIATIONS
| NHIS | = National Health Insurance System |
| MAP | = Medical Aid Program |
| SES | = Socioeconomic Status |
ETHICS APPROVAL AND CONSENT TO PARTICIPATE
This study is a study that uses information disclosed to the public by the Health Insurance Review and Assessment Service of South Korea or a study that does not collect and record personal identification information, and is exempted from the review of the Institutional Review Board for research using existing data or documents.
HUMAN AND ANIMAL RIGHTS
No animals/humans are used for studies that are the basis of this research.
CONSENT FOR PUBLICATION
Not applicable.
AVAILABILITY OF DATA AND MATERIALS
Not applicable.
FUNDING
This research was supported by the Soonchunhyang University Research Fund.
CONFLICT OF INTEREST
The authors declare that no conflict of interest, financial or otherwise, impacted the current study.
ACKNOWLEDGEMENTS
Declared none.

