All published articles of this journal are available on ScienceDirect.

Socioeconomic and Demographic Determinants of Body Mass Index in Sudan: A Predictive Model
Abstract
Background:
This paper aimed to determine the socioeconomic and demographic determinants related to Body Mass Index (BMI) for children under five years in Sudan. The objective of the study was to identify the factors of BMI for under-five children.
Methods:
This study used the Sudan Multiple Indicator Cluster Survey (MICS) conducted in the year 2014. The multinomial logistic regression model was adopted.
Results:
Results revealed that the prevalence of underweight infants under five years was 86.3% in females and 85.3% in males, while the proportion of the normal weight of infants under five years of age for males was slightly higher than females; there was a correlation amid geographic determinants, state, and BMI status. Also, there was a significant association between the mother’s education and body mass index status and the wealth index and body mass index status. The variables place of residence and sex did not show a statistically significant relationship with body mass index status for children under five years of age in Sudan.
Conclusion:
The risk factors significantly associated with body mass were the state, whether the child had ever been breastfed, sex, mother’s education, wealth index, and age in the month.
1. BACKGROUND
In medical terms, Body Mass Index (BMI) is expressed as the square of a person's height divided by the person's weight in kilograms. This definition identifies weight categories that indicate health problems in an easy-to-use way. Children and teens have BMIs based on their age and gender. Alternatively, it is called BMI-for-age. High body fatness may be reflected in a high BMI. Generally, BMI relates more directly to fat measurements. The National Institute of Health (NIH) defines standard mass and obesity as a BMI of 27.3 or above for females and 27.8 for males, while obesity is defined as a BMI over 30 for both genders [1].
165 million children under five years of age are predicted to have been stunted globally in 2011. In Africa (36%) and Asia (27%), this phenomenon is prevalent; it remains a public health issue. However, it usually goes unnoticed. These percentages represent 90% of the globe's undersized infants [2]. Yetubie et al. (2010) found no significant variations in the percentage of overweight people. Being skinny was associated with age, the number of banquets, level of parents’ schooling, the origin of food, and quantity of stock possessed [3]. Akinsola et al. (2018) revealed that BMI was positively correlated with gender (females), but it was negatively connected to age and educational standard [4]. A study conducted in Bulgaria in 2015 found the factors associated with overweight, obesity, and underweight among examined Bulgarian children and adolescents were those associated with feeding and eating behaviors, particularly overeating by both sexes and daily meal frequency of boys. In addition, preliminary results showed a non-significant difference in BMI or nutritional status between children and adolescents in the Smolyan area based on factors such as family’s education level, place of residence, daily diet, physical activity, or place of residence [5]. In a study conducted in Kenya, it was revealed that despite adjusting for potential confounders, BMI and wealth index were positively correlated. The association between BMI and wealth index was higher among women across all wealth quartiles, suggesting that, within each wealth quartile, women were more likely to be overweight/obese and experience its consequences. BMI and wealth index are strongly associated in urban slum settings, making wealth index a reliable indicator of BMI. As a consequence, health promotion interventions aimed at reducing obesity must consider the distribution of wealth indexes among the population as an important factor that affects health status, including obesity prevalence in low-income settings [6]. The results of a study conducted in Nigeria showed that the majority of school children enrolled in the study were obese, emphasizing the need for prevention strategies to prevent childhood obesity [7]. A study conducted in Ethiopia concluded that the weight of an infant at birth, the BMI, as well as the region (Affar, Dire Dawa, Gambela, Harari & Somalia) significantly influenced an under-five infant's nutritional status [8]. According to a study conducted in Khartoum, Sudan, 20.9% of the infants were severely stunted, and approximately 15.4% were skinny, 8.8% were fairly skinny, and 6.6% were seriously underweight [9]. A study conducted in Ghana by Boah et al. (2019) showed that the occurrence of underweight, wasting, and stunting children was 10.4%, 5.3%, and 18.4%, respectively [10]. The age of the infant was associated with underweight, wasting, and stunting, while gender was associated with wasting and stunting. Regular or overweight/obese, the mother’s BMI class, female's self-sufficiency, and middle-class fortune index were related to smaller odds of malnutrition [11]. The study conducted by Alhadi (2019) concluded that the incidence of overweight and obesity was 34% and 5%, respectively [12]. Women possessed a higher frequency of obesity (38.3%) compared to 30% among men. Obesity was more common among women (7.4%) than men (2.4%); most participants had healthy weight (50.9%). A study conducted by [13] found that the existence of overweight and obesity was high among both genders; it was 23.7% and 9.7% respectively for men and 20.3%% and 29.3% respectively among women. Sex, age, monthly revenue, spousal status, schooling, and alcohol intake had a considerable impact on both overweight and obesity.
2. MATERIALS AND METHODS
2.1. Study Variables
The response variable for this study was BMI for the under-five child in Sudan, which is a multinomial variable. The independent variables used in this research were the place of residence, state, mother’s education, sex, age of the child, breastfeeding child, and wealth index. The demographic and socioeconomic factors used in this study were proposed by different authors [7, 10].
2.2. Source of Data
For this study, the 2014 Sudan Multiple Indicator Cluster Survey (MICS) was used. The survey was carried out by the Central Bureau of Statistics in collaboration with several national institutions. During the survey, data were collected from 15,801 households selected from a sample of 18,000 households drawn from all regions of Sudan. The response percentage was found to be 98 percent. A total of 20,327 women ranging between 15-49 years of age and 14,751 children under five years of age were included in the survey. This survey had basic information to track the progress of MDGs related to health and mortality. In general, 18,302 women aged 15-49 were interviewed from a sample of 16,801 households, and 14,081 questionnaires were completed for children under five years of age.
3. STATISTICAL METHODS
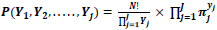
The multinomial logistic regression models are an extension of the ordinary logistic models where we study a categorical response variable with more than two possible outcomes [14]. Let J represent the number of categories for the response Y. Let π1, π2,........, πj represent the response probabilities, satisfying  =1. With n independent observations, the probability for the number of responses of the J is multinomial distribution and can be expressed as follows:
The logit link function will be adopted for the multinomial logistic regression model. A response variable that has more than two nominal categories can be modeled adopting multinomial logistic regression. It is important to notice whether the response variable is nominal or ordinal. Multinomial logit models handle all pairs of categories by specifying the odds of the outcome in one category instead of another. For models of this section, the order of listing the categories is irrelevant because the model treats the response scale as nominal (unordered categories).
Assume that Y can take on values coded as 0,1,2, ......., J. Later select one of the response levels to assert J as the reference level. Suppose we have P covariates, then the model can be expressed as follows:
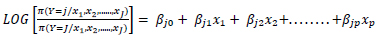
where j = 1,2,....,J - 1; J is the outcome from the baseline category, which can be any category but is commonly the highest one; βjo represent the constants, and βj1x1, βj2x2, ......, βjpxp are the coefficients of the multinomial regression model. As the model has J - 1 comparisons, it estimates the J - 1 logit function for each predictor [13].
To predict the multinomial logistic regression model, the maximum likelihood technique will be used. Regarding the nominal categories, one of the categories is considered a reference or baseline category, and the rest of the categories are compared with the reference category [14].
4. RESULTS
Firstly, bivariate tests were carried out before performing the multinomial logistic regression analysis. A basic approach of descriptive analysis, cross-tabulation, was performed adopting the tests of chi-square to explore the association between the response of body mass index and many categorical socio-economic, demographic, and geographic variables at the 5% level of significance. Table 1 displays the relationship between body mass index and selected socio-economic, demographic, and geographic categorical variables. There was a statistically significant association at the 5% level among geographic factors; state, and body mass index status (p-value < 0:0001). A significant association was noticed among demographic variables and body mass index, i.e., between the mother’s education and body mass index status (p-value < 0.0001). Similarly, a significant relationship was found between the wealth index and body mass index status (p-value < < 0.0001). In contrast, place of residence (p-value = 0.588) and sex (p-value=0.095) did not show a statistically significant association with body mass index status.
For this study, the proportional odds model was adopted to the 2014 Sudan Multiple Indicator Cluster Survey. The basis for outcomes with most multinomial regression models is the logit function. The distinction between logit and probit functions is found in small samples. This is because the probit link considers the normal distribution of the probability of an event but the logit link assumes the logistic distribution. For the data derived from complex survey design, it is unsuitable for running the proportional odds model analysis for the ordinal response variable, ignoring the design of the survey sample. Disregarding the survey sampling information may provide biased estimates of parameters, incorrect variance, and parameter estimates. This is due to overestimated or underestimated parameters and variance estimates. For this kind of situation, a specialized method to obtain suitable estimates and standard errors for the ordinal outcome variable should be adopted. This technique includes the weight in the survey sampling design.
| Covariates | Classification for Body Mass Index | Chi-square Test (P-Value) | |||||
|---|---|---|---|---|---|---|---|
| Under Weight | Normal | Overweight | |||||
| Number | % | Number | % | Number | % | ||
| Place of residence | 0.588 | ||||||
| Urban | 3171 | 85.3% | 210 | 5.7% | 335 | 9.0% | |
| Rural | 8599 | 86.0% | 530 | 5.3% | 870 | 8.7% | |
| State | < 0.0001 | ||||||
| Northern | 194 | 84.8% | 13 | 5.7% | 22 | 9.4% | |
| River Nile | 339 | 87.4% | 14 | 3.6% | 35 | 9.0% | |
| Red Sea | 163 | 68.3% | 22 | 9.1% | 54 | 22.5% | |
| Kassala | 403 | 81.3% | 15 | 3.1% | 77 | 15.6% | |
| Gadarif | 642 | 85.2% | 64 | 8.4% | 48 | 6.4% | |
| Khartoum | 1592 | 92.5% | 53 | 3.1% | 77 | 4.5% | |
| Gezira | 1800 | 85.2% | 262 | 12.4% | 50 | 2.3% | |
| White Nile | 589 | 84.0% | 36 | 5.1% | 76 | 10.9% | |
| Sinnar | 467 | 84.8% | 16 | 2.9% | 68 | 12.3% | |
| Blue Nile | 626 | 92.1% | 36 | 5.4% | 17 | 2.5% | |
| North Kordofan | 730 | 81.7% | 42 | 4.7% | 121 | 13.6% | |
| South Kordofan | 430 | 83.4% | 30 | 5.8% | 56 | 10.8% | |
| West Kordofan | 751 | 84.9% | 32 | 3.6% | 101 | 11.4% | |
| North Darfor | 952 | 86.3% | 25 | 2.3% | 126 | 11.5% | |
| West Darfor | 425 | 88.6% | 32 | 6.7% | 22 | 4.7% | |
| South Darfor | 1137 | 93.4% | 29 | 2.4% | 51 | 4.2% | |
| Central Darfor | 205 | 82.7% | 20 | 8.1% | 23 | 9.2% | |
| East Darfor | 451 | 92.7% | 11 | 2.20% | 25 | 5.0% | |
| Sex | 0.095 | ||||||
| Male | 5970 | 85.3% | 405 | 5.8% | 623 | 8.9% | |
| Female | 5800 | 86.3% | 335 | 5.0% | 582 | 8.7% | |
| Mother's education | < 0.0001 | ||||||
| None | 5501 | 85.6% | 329 | 5.1% | 600 | 9.3% | |
| Primary | 3940 | 86.8% | 222 | 4.9% | 376 | 8.3% | |
| Secondary | 1671 | 85.0% | 125 | 6.4% | 169 | 8.6% | |
| Higher | 643 | 83.9% | 64 | 8.4% | 59 | 7.7% | |
| Wealth Index | < 0.0001 | ||||||
| Poor | 5502 | 85.5% | 323 | 5.0% | 612 | 9.5% | |
| Middle | 2783 | 86.6% | 154 | 4.8% | 276 | 8.6% | |
| Higher | 3485 | 85.7% | 263 | 6.5% | 317 | 7.8% | |
Therefore, the findings of the analysis are given in Table 2, which displays the results for the Multinomial logistic model. The log-likelihood value at each iteration step displays the ordinal logistic regression using the maximum likelihood estimation method. The log-likelihood increased at each iteration because the purpose was to maximize the log-likelihood function. For the model to converge, the iterations had to be very small. The likelihood value of the fitted model was found to be 7923.67. This value was adopted in the likelihood ratio chi-square test when all predictors’ regression coefficients in the model were included at the same time equal to zero and in tests of nested models. The likelihood ratio chi-square (LR x2) examines whether at least one of the explanatory’s regression coefficients is not equal to zero. The p-value of the log-likelihood ratio chi-square test with 50 degrees of freedom, LR x2(50) =500.55, was p-value < 0.0001. This value expressed that at least one of the logit regression coefficients of the predictors was statistically different from 0. Therefore, the full model with all predictors included gave a better fit than the null model.
| Covariates | OR | P-value | 95% C. I. | OR | P-value | 95% C. I. | ||
|---|---|---|---|---|---|---|---|---|
| Lower | Upper | Lower | Upper | |||||
| Overweight (Base Outcome) | ||||||||
| Underweight | Normal | |||||||
| Place of residence (Ref. Urban) | ||||||||
| Rural | 1.021 | 0.860 | 0.808 | 1.291 | 1.043 | 0.799 | 0.757 | 1.437 |
| State (Ref. Northern) | ||||||||
| River Nile | 0.311 | 0.001 | 0.154 | 0.627 | 0.742 | 0.539 | 0.286 | 1.925 |
| Red Sea | 0.272 | 0.000 | 0.140 | 0.528 | 0.360 | 0.039 | 0.136 | 0.949 |
| Kassala | 0.080 | 0.000 | 0.044 | 0.146 | 0.404 | 0.037 | 0.173 | 0.945 |
| Gadarif | 0.150 | 0.000 | 0.085 | 0.265 | 0.268 | 0.003 | 0.113 | 0.634 |
| Khartoum | 0.377 | 0.002 | 0.206 | 0.693 | 1.523 | 0.305 | 0.681 | 3.406 |
| Gezira | 0.560 | 0.113 | 0.274 | 1.147 | 0.731 | 0.531 | 0.274 | 1.949 |
| White Nile | 1.169 | 0.713 | 0.509 | 2.686 | 4.643 | 0.003 | 1.700 | 12.680 |
| Sinnar | 0.260 | 0.000 | 0.143 | 0.473 | 0.524 | 0.134 | 0.225 | 1.221 |
| Blue Nile | 0.251 | 0.000 | 0.138 | 0.456 | 0.344 | 0.018 | 0.142 | 0.832 |
| North Kordofan | 2.239 | 0.068 | 0.942 | 5.323 | 4.788 | 0.003 | 1.704 | 13.454 |
| South Kordofan | 0.222 | 0.000 | 0.124 | 0.400 | 0.596 | 0.217 | 0.262 | 1.356 |
| West Kordofan | 0.205 | 0.000 | 0.117 | 0.358 | 0.678 | 0.323 | 0.314 | 1.465 |
| North Darfor | 0.488 | 0.028 | 0.258 | 0.924 | 1.065 | 0.886 | 0.449 | 2.525 |
| West Darfor | 0.248 | 0.000 | 0.138 | 0.446 | 0.323 | 0.014 | 0.131 | 0.794 |
| South Darfor | 0.784 | 0.493 | 0.390 | 1.574 | 2.556 | 0.038 | 1.055 | 6.193 |
| Central Darfor | 0.553 | 0.065 | 0.295 | 1.037 | 0.738 | 0.504 | 0.303 | 1.798 |
| East Darfor | 0.313 | 0.000 | 0.171 | 0.572 | 1.265 | 0.568 | 0.565 | 2.835 |
| Sex (Ref. Male) | ||||||||
| Female | 1.020 | 0.819 | 0.863 | 1.204 | 1.245 | 0.061 | 0.990 | 1.567 |
| Mother's education (Ref. No education) | ||||||||
| Primary | 1.285 | 0.251 | 0.838 | 1.970 | 0.703 | 0.218 | 0.402 | 1.231 |
| Secondary | 1.448 | 0.034 | 1.029 | 2.038 | 0.990 | 0.940 | 0.761 | 1.289 |
| Higher | 2.087 | 0.000 | 1.417 | 3.073 | 1.264 | 0.266 | 0.836 | 1.910 |
| Child ever been breastfed (Ref. Yes) | ||||||||
| No | 2.010 | 0.002 | 1.290 | 3.130 | 1.142 | 0.697 | 0.585 | 2.227 |
| Wealth Index | 0.982 | 0.019 | 0.967 | 0.997 | 0.957 | 0.000 | 0.940 | 0.975 |
| Age in month | 0.096 | 0.000 | 0.046 | 0.201 | 0.111 | 0.000 | 0.042 | 0.294 |
The risk factors significantly associated with body mass index were found to be the state, child breastfeeding, sex, mother’s education, wealth index, and age in the month (Table 2). Children of mothers who had completed secondary high school (OR= 1.45, C.I. (1.03,1.04) and higher education (OR=2.09, C.I. (1.42, 3.07) were more likely to be underweight than children of mothers who had not completed secondary high school. Children from mothers who had not breastfed their children had an increased chance of being underweight compared to children who were breastfed (OR=2.01, C.I. (1.2,3.13)). A unit increase in the wealth index of the household (OR=0.98, C.I. (0.967, 0.997)) and age of a child in a month (OR=0.096, C.I. (0.046, 0.201)) were associated with decreased odds of a child being underweight. Similarly, a unit increase in the wealth index of the household (OR=0.957, C.I. (0.94, 0.975)) and age of a child in the month (OR=0.111, C.I. (0.042, 0.294)) were associated with decreased odds of a child being normal weight. On the other hand, female under-five children were most likely to be normal weight compared to male under-five children (OR=1.245, C.I. (0.990, 1.567)). Under-five children who lived in the River Nile (OR=0.311, C.I. (0.154,0.627), Red Sea (OR=0.272, C.I. (0.140, 0.528)), Kassala (OR=0.080, C.I. (0.044, 0.146)), Gadarif (OR=0.150, C.I. (0.085, 0.265)), Khartoum (OR=0.377, C.I. (0.206, 0.693)), Sinnar (OR=0.260, C.I. (0.143, 0.473)), Blue Nile (OR=0.251, C.I. (0.138, 0.456)), South Kordofan (OR=0.222, C.I. (0.124, 0.400)), West Kordofan (OR=0.205, C.I. (0.117, 0.358)), North Darfor (0.488, C.I. (0.258, 0.924)), West Darfor (OR=0.248, C.I. (0.138, 0.446)) and East Darfor (OR=0.313, C.I. (0.171, 0.572)) states were less likely to be underweight compared to the Northern state. On the other hand, under-five children who lived in the White Nile (OR=4.643, C.I. (1.704, 13.454), North Kordofan (OR=4.788, C.I. (1.704, 13.454)) and South Darfur (OR=2.556, C.I. (1.055, 6.193)) were more likely to be normal weight compared to the Northern region. In contrast, under-five children who lived in the Red Sea (OR= 0.360, C.I. (0.136, 0.949)), Kassala (OR=0.404, C.I. (0.173, 0.945)), Gadarif (OR=0.268, C.I. (0.113, 0.634)), Blue Nile (OR=0.344, C.I. (0.142, 0.832)) and West Darfor (OR=0.323, C.I. (0.131, 0.794) were less likely to be normal weight compared to the Northern State.
This study aimed to identify the socioeconomic and demographic determinants of body mass index in Sudanese children under the age of five. According to the survey, 85.3% of men and 86.3% of women were underweight. There was a significant difference between being underweight in males and females. Males had a higher proportion of normal weight than females. This result contradicted the result obtained by Yetubie et al. (2010) [3]. The results of the study showed that there was an association between geographic factors, state, and the body mass index status. There was also a significant relationship between a mother’s education and body mass index status. Also, a significant association was found between the wealth index and body mass index status. On the other hand, the place of residence and sex did not show a statistically significant relationship with body mass index status. The risk factors significantly associated with body mass index were found to be the state, child breastfeeding, sex, mother’s education, wealth index, and age in the month. This result is in the same line as [13].
Under-five children who lived in the River Nile, Red Sea, Kassala, Gadarif, Khartoum, Sinnar, Blue Nile, South Kordofan, West Kordofan, North Darfor, West Darfor, and East Darfor states were less likely to be underweight compared to the Northern state. On the other hand, under-five children who lived in the White Nile, North Kordofan, and South Darfur were more likely to be normal weight compared to the Northern region. This result may be due to the variation between Sudanese states in terms of resources, size, location, etc. Also, the community values and habits could affect the behaviors of individuals in these states.
5. DISCUSSION
Under-five malnutrition was the main focus of different researchers. Based on studies conducted on malnutrition, poor condition, and practice by parents and the surrounding poor environment were the main reasons for malnutrition [19]. Furthermore, under-five children in East Africa are primarily affected by their body weight at birth, the mother's age, and the region in which they live [3]. In addition, age, sex, learning in classes, playing outside, reading books or using the internet, current maternal smoking and television viewing (both with higher BMI) had an impact [15-19].
This study used multinomial regression to analyze the under-five children’s BMI using the 2014 MICS. The point estimates of the multinomial regression allowed us to identify the effects of predictors for the under-five BMI. In consequence, the result showed a full association between the outcome and the explanatory variables. With assessments across different levels, we could examine the influence of predictors on a different response variable (BMI of under-five children) and thus obtain a comprehensive picture of the relationship between different covariates and responses. This study disclosed that place of residence, state, mother’s education level, sex, age of the child, and wealth index were found to have an important effect significantly affecting under-five children’s BMI at different quantile levels. Therefore, our findings support the findings of previous studies.
CONCLUSION
According to the study, the factors associated with the body mass index of Sudanese under-five children were breastfeeding, sex, the mother's education, wealth index, age in the month, and state. Additionally, there was a high percentage of underweight children under five in most Sudanese states. There was evidence that the body mass index correlates with a wealth index. This study will help policymakers identify the critical factors to improve policies that enhance the normal status of under-five children in Sudan. Moreover, the study recommends that improving the mothers' nutritional status can enhance their children's malnutrition status. Thus, the Sudanese government has a crucial obligation to implement programs focused on the states of Red Sea, Kassala, Gadarif, Blue Nile, and West Darfur that will improve policies for the development of good nutrition status among under-five children in Sudan.
LIST OF ABBREVIATIONS
| BMI | = Body Mass Index |
| MICS | = Multiple Indicator Cluster Survey |
| NIH | = National Institute of Health |
| LR | = Likelihood Ratio |
| OR | = Odd Ratio |
| CI | = Confident Interval |
AUTHORS’ CONTRIBUTIONS
AA wrote the main manuscript text; MO prepared theoretical statistics and literature; DA did the statistical analysis and prepared the results. All three authors reviewed the manuscript.
ETHICAL STATEMENT
Data used in this study were the 2014 Sudan Multiple Indicator Cluster Survey (MICS). The survey was carried out by the Central Bureau of Statistics of Sudan in collaboration with several national institutions.
CONSENT FOR PUBLICATION
Not applicable.
AVAILABILITY OF DATA AND MATERIALS
All data analyzed were included in the submission. The datasets generated and/or analyzed during the current study are not publicly available due to their not being owned by the authors. It is owned by UNICEF, so authors do not have a right to disseminate these data, but they are available from the corresponding author on reasonable request.
FUNDING
None.
CONFLICT OF INTEREST
The authors declare no conflict of interest, financial or otherwise.
ACKNOWLEDGEMENTS
We thank UNICEF for giving us access to the data file.

