All published articles of this journal are available on ScienceDirect.

Prevalence of Risk Factors Associated with Intimate Partner Violence in Women of Reproductive Age from South Africa and Uganda
Abstract
Background:
Intimate partner violence (IPV) remains a primary health concern in both developing and developed countries. Even though some countries are intervening through awareness campaigns to boost IPV knowledge, the high prevalence remains a concern. This study's main objective was to assess IPV factors utilizing the generalized additive mixed model (GAMM).
Methodology:
The current research used datasets from the 2016 South Africa and Uganda Demographics and Health Surveys involving a total of 8514 and 18506 women, respectively. GAMM was used to examine the data. The result assessed if a woman has experienced some form of intimate violence or not.
Results:
This study found that 26.93% and 32.25% of women from South Africa and Uganda, respectively, have experienced intimate partner violence. Additionally, the results from this work using GAMM showed the following independent variables as significant risk factors of IPV: age of the woman's partner, marital status, region where the woman lives, age of the woman, media exposure, size of the family, polygamy, wife-beating attitude, sex of the household head, wealth index, pregnancy termination status, body mass index, marital status, cohabitation duration, partner's desire for children, partner's education level, woman's working status, woman's income compared to partner's income, and the person who usually decide on what to do with the woman's earnings.
Conclusion:
The study shows that socioeconomic and demographic variables are significant factors that can be used in policy development and contingency plans when tackling intimate partner violence. The results of this study can assist general health workers and organizations responsible for gender monitoring in the two countries in developing successful strategies to reduce intimate partner violence against women.
1. INTRODUCTION
Large numbers of African women live in rural areas and are subject to traditional African law, which reinforces the subordinate place of women within the family [1]. The lifetime prevalence of sexual and physical violence against women of reproductive age in the central Africa regions is high compared to the sub-regions [2]. Gender-based violence (GBV) is a form of human rights infringement, and intimate partner violence (IPV) is a significant aspect of GBV [3, 4]. GBV is usually regarded as the 'tip of the iceberg’ or ‘the silent epidemic' as sufferers are uncertain about disclosing violence incidents due to numerous barriers [5]. Some of the negative consequences of IPV for women involve loss of pregnancy through stillbirths and miscarriages, and acquisition of sexually transmitted infections (STIs) [6]. Sub-Saharan Africa has a high prevalence of IPV compared to the rest of the world [4], with a total prevalence of 36%, compared to the worldwide average of 30% [7].
There are many consequences of IPV that are of concern. Several studies show the association between IPV and a wide range of unfavorable reproductive health results, including unintended pregnancy [8-10]. Other consequences include poor outcomes of pregnancy [11] and gynecological morbidity [12, 13]. Furthermore, women can contract STIs and human immunodeficiency virus (HIV) [9, 14]. There is a strong relationship between socioeconomic status and IPV, with the index of household wealth or the partner's education level being significantly inversely related to the dangers of violence [13].
Habyarimana et al. [15] investigated whether the violent incidents were associated with the female or her partner, husband or partner, and the involvement of community or family members in the matter [15]. The socio-demographic attributes of women were as follows: age group in years, education level attained, employment status, number of sexual partners in the last 12 months, ownership of assets such as a house or land, and the woman's income as compared to that of her partner [15]. The socioeconomic and demographic attributes of the partner that were considered comprised educational level, employment status, alcohol drinking status, polygamy status, and the partner's income [15]. The family or community attributes comprised the number of family members, wealth index, type of residence, province, the person who makes decisions about family visits, significant household expenses, the woman's healthcare, and what to do with the income the partner earns [15].
The lifetime percentage of experiencing violence from an intimate partner was 24.6% in South Africa, whereas in Nigeria, like in many developing countries where domestic violence (DV) commonly occurs, reliable population-based data on violence against women by their partners is scarce [16]. Household violence was associated with lower social class, alcohol drinking status, age difference between partners, and employment status [16]. In a study by Obi and Ozumba [16], about 70% of the male respondents disclosed a history of household violence in their families; in 92% of cases, the female partners were the victims, while 8% of victims were male [16]. Demographic attributes are also remarkable risk factors for IPV, with some researchers having discovered that age disparity and the number of children are associated with a lowered risk of violence [17]. As assessed by their educational achievements, degree of self-governance or authority over resources, women with a well-established status are more protected from the risk of IPV [13]. Some studies in developing countries have also found an association between alcohol consumption status or drugs and the risk of violence [18-20].
2. MATERIALS AND METHODS
The study focused on women between 15-49 years so that the contraceptive use by these women can be investigated as to how it contributes to IPV. Several studies have defined a woman of reproductive age as a woman who is between the ages of 15-51 years [21, 22]. From the DHS datasets for women, the ages are between 15-49 years.
2.1. South Africa
The current scientific study utilized the 2016 South African Demographic and Health Survey (SADHS) data. The 2016 SADHS observes a stratified two-stage sample design with a probability in proportion to size sampling of primary sampling units (PSUs) at the initial stage and systematic sampling of dwelling units (DUs) at the second stage [23]. Seven hundred and fifty PSUs were chosen from 26 sampling strata, resulting in 468 chosen PSUs in urban areas, 224 PSUs in traditional areas, and 58 PSUs in farm areas [23]. Women aged between 15-49 years were selected. The survey utilized questionnaires answered by the women and men of each household [23]. The 2016 SADHS supplied women datasets among others, and we used the dataset in this study.
2.2. Uganda
We used the 2016 Uganda Demographic and Health Survey (UDHS) in this study. The 2016 UDHS sample was stratified and chosen in two stages [24]. In stage one, 697 enumeration areas (EAs) were chosen from the 2014 Uganda NPHC: 162 EAs in urban areas and 535 in rural areas [24]. One cluster from the Acholi sub-region was removed because of the land arguments [24]. Households made up the second stage of sampling [24]. A list of households was put together in each of the 696 accessible chosen enumeration areas from April 2016 to October 2016 [24], with some listings overlapping with the fieldwork [24]. A sample of 20,880 households (30 per EA or EA segment) was chosen at random for the 2016 UDHS [24]. Additionally, all women and men, aged between 15-49 and 15-59 years respectively, were eligible to be interviewed. The survey involved various types of questionnaires, such as for households, men and women. Only the women's data to identify the factors influencing IPV among women in Uganda were used.
3. DATA ANALYSIS
3.1. Dependent Variable
The prevalence of IPV in women aged between 15-49 years was determined using the outcome of the physical, emotional, and psychological violence response from the women respondents. Hence, the response variable was binary, where the woman either experienced IPV (at least one of the responses above was positive) or not (none of the responses were positive).
3.2. Independent Variables
The variables that we utilized in this work were selected after careful consideration of the variables used by other authors. The variables were chosen only if some of the studies were found to be significant [6, 10, 13, 15, 25-27], amongst others. In the current study, the following variables were used: the socio-demographic attributes of the women such as the age of the woman in years, the highest level of education attained, employment status, the person who usually decide on how to spend woman's income, wife-beating attitude, literacy, ever terminated a pregnancy, use of contraceptives, body mass index, and knowledge of STIs [9, 10, 14]. The socioeconomic and demographic attributes of the partner were also considered, such as highest education level, age, employment status, alcohol drinking status, whether there is polygamy, and their desire for children [19]. The community and family characteristics that we investigated include the family size, wealth quintile, type of residence, region or province, sex of the household head, and cohabitation duration. Several studies show the link between household violence and a range of unfavorable reproductive health outcomes; these incorporate non-use of contraception and unintended pregnancy [8, 9]. Other factors that influence IPV are STIs and HIV [9, 14].
3.3. Missing Values
The issue of non-response to more than one question in any survey may cause invalidation when the data is used in regression analysis [28]. Pragmatic and statistically advanced ways have been constructed to deal with missing data issues depending on their nature and proportion [28]. One method is MICE, an acronym for multiple imputations by chained equations. The method has been well presented in a study by van Buuren et al. [29]. Multiple imputations provide a way for dealing with missing values in a dataset [29]. Generating multiple imputations accounts for the statistical unpredictability in the imputations [30]. The MICE perspective is flexible and can manage variables of different types (e.g., continuous or binary) and complexities, such as survey skip patterns [30]. Multiple imputations have a few advantages compared to the other approaches [30]. Multiple imputations involve filling in missing observations multiple times, generating multiple complete datasets, as described by Schafer and Graham [31]. The missing observations are imputed regarding observed values for specific individuals [30, 31]. It is also based on links observed in the data for other individuals, suspecting that the observed variables are incorporated in the imputation model [30]. Multiple imputation techniques, MICE in particular, are flexible and can be utilized in various settings [30, 32]. Multiple imputations involve generating multiple predictions for each missing observation, analyzing the expanded data, accounting for the uncertainty in the imputations, and yielding correct standard errors [30, 31]. In the statistical software suite (SAS), the multiple imputation procedure (Proc mi) is used to carry out multiple imputations [33].
3.4. Descriptive Data Analysis
Descriptive data analysis was conducted to determine the data distribution within the different covariates of interest. The main aim of descriptive data analysis is to look at the data in detail before making any assumptions. The chi-square test for analysis was utilized; this technique reveals the correlation between the response variable and the covariates. The results of this study were analyzed using SAS (version 9.4). The results in Tables 1 and 2 show the frequency distribution for South Africa and Uganda, repectively. A p-value less than 0.05 shows that the covariate correlates to the response variable. A p-value greater than 0.05 shows that the covariate does not correlate to the response variable. The current study considered 8,514 and 18,506 women from South Africa and Uganda, respectively. The overall prevalence of IPV was 26.93% (Table 1) and 32.25% (Table 2) for South Africa and Uganda, respectively.
| Indicator | Category | Experienced IPV | P-value | |
|---|---|---|---|---|
| YES N (%) | NO N (%) | |||
| IPV | 2293(26.93) | 6221(73.07) | ||
| Respondent current age | Continuous | Minimum=15 | ||
| Mean=30.21 | ||||
| Maximum=49 | ||||
| Region | Western Cape | 141(1.66) | 515(6.05) | <.0001 |
| Eastern Cape | 322(3.78) | 719(8.44) | ||
| Northern Cape | 136(1.60) | 582(6.84) | ||
| Free State | 247(2.90) | 607(7.13) | ||
| Kwazulu-Natal | 314(3.69) | 1024(12.29) | ||
| North West | 270(2.90) | 593(6.96) | ||
| Gauteng | 242(2.84) | 621(7.29) | ||
| Mpumalanga | 313(3.68) | 741(8.70) | ||
| Limpopo | 308(3.62) | 797(9.36) | ||
| Type of place of residence | Rural | 1263(14.83) | 3542(41.60) | 0.1256 |
| Urban | 1030(12.10) | 2679(31.47) | ||
| Woman's education level | No education | 58(0.68) | 132(1.55) | 0.3699 |
| Primary | 245(2.88) | 617(7.25) | ||
| Secondary | 1745(20.50) | 4836(56.80) | ||
| Higher | 245(2.88) | 636(7.47) | ||
| Number of household members | Less than 5 | 1774(20.84) | 3676(43.18) | <.0001 |
| More than or equal to 5 | 519(6.10) | 2545(29.89) | ||
| Sex of the household head | Male | 1090(12.80) | 2521(29.61) | <.0001 |
| Female | 1203(14.13) | 3700(43.46) | ||
| Literacy | Cannot read | 100(1.17) | 232(2.72) | 0.1816 |
| Able to read | 2193(25.76) | 5989(70.34) | ||
| Wife-beating attitude | Unacceptable | 2067(24.28) | 5726(67.25) | <.0001 |
| Acceptable | 208(2.44) | 332(3.90) | ||
| I don't know | 18(0.21) | 163(1.91) | ||
| Access to the media | Low exposure | 325(3.83) | 981(11.52) | <.0001 |
| Medium exposure | 1384(16.26) | 3345(39.39) | ||
| High exposure | 583(6.85) | 1886(22.15) | ||
| Wealth index combined | Poorest | 492(5.78) | 1271(14.93) | <.0001 |
| Poorer | 573(6.73) | 1292(15.18) | ||
| Middle | 587(6.89) | 1369(16.08) | ||
| Richer | 435(5.11) | 1298(15.25) | ||
| Richest | 206(2.42) | 991(11.64) | ||
| Ever had a terminated pregnancy | No | 1972(23.16) | 5763(67.69) | <.0001 |
| Yes | 321(3.77) | 458(5.38) | ||
| Contraceptive method used | No | 1028(12.07) | 3461(40.65) | <.0001 |
| Yes | 1265(14.86) | 2760(32.42) | ||
| Body Mass Index | Underweight | 71(0.83) | 201(2.36) | 0.0806 |
| Healthy | 637(7.48) | 1676(19.69) | ||
| Overweight | 559(6.57) | 1384(16.26) | ||
| Obese | 1026(12.05) | 2960(34.77) | ||
| Current marital status | Single | 1205(14.15) | 4468(52.48) | <.0001 |
| Married | 637(7.48) | 1188(13.95) | ||
| Living with partner | 451(5.30) | 565(6.64) | ||
| Number of other wives/partners | No other wives | 2109(24.77) | 5741(67.43) | 0.8179 |
| One or more | 65(0.76) | 178(2.09) | ||
| I don't know | 119(1.40) | 302(3.550 | ||
| Cohabitation duration | 0-4 | 2059(24.18) | 5740(67.42) | 0.0003 |
| 5-9 | 234(2.75) | 481(5.65) | ||
| Partner's desire for children | Both want same | 1077(12.65) | 3434(40.33) | <.0001 |
| Partner wants more | 453(5.32) | 1041(12.23) | ||
| Partner wants fewer | 129(1.52) | 287(3.37) | ||
| Don't know | 634(7.45) | 1459(17.14) | ||
| Partner's education level | No education | 99(1.16) | 279(3.28) | 0.0130 |
| Primary | 258(3.03) | 588(6.91) | ||
| Secondary | 1559(18.31) | 4162(48.88) | ||
| Higher | 364(4.28) | 1147(13.47) | ||
| Don't know | 13(0.15) | 45(0.53) | ||
| Partner's occupation | Employed | 1931(22.68) | 5363(62.99) | 0.0198 |
| Don't know | 362(4.25) | 858(10.08) | ||
| Woman's occupation | Unemployed | 1261(14.81) | 4148(48.72) | <.0001 |
| Employed | 938(11.02) | 1840(21.61) | ||
| Don't know | 94(1.10) | 233(2.74) | ||
| Partner's age | Less than 25 | 139(1.63) | 756(8.88) | <.0001 |
| Between 25 and 34 | 802(9.42) | 2372(27.86) | ||
| 35 and above | 1352(15.88) | 3093(36.33) | ||
| Woman's earning compared to partner | More than him | 442(5.19) | 1151(13.52) | 0.0425 |
| Less than him | 1219(14.32) | 3441(40.42) | ||
| About the same | 369(4.33) | 998(11.72) | ||
| Partner doesn't bring in | 209(2.45) | 457(5.37) | ||
| Don't know | 54(0.63) | 174(2.04) | ||
| Knowledge of Sexually Transmitted Infections (STIs) | No | 25(0.29) | 242(2.84) | <.0001 |
| Yes | 2268(26.64) | 5979(70.23) | ||
| The person who usually decide on what to do with the woman's earning | Woman alone | 723(8.49) | 1709(20.07) | 0.0011 |
| Woman and partner | 1390(16.33) | 4013(47.13) | ||
| Partner alone | 180(2.11) | 499(5.86) | ||
| Woman's father ever beat her mother | No | 1699(19.96) | 5432(63.80) | <.0001 |
| Yes | 449(5.27) | 551(6.47) | ||
| Don't know | 145(1.70) | 238(2.80) | ||
Table 1 shows that the province with the highest prevalence was Eastern Cape with 3.78%, followed by Kwazulu-Natal, Mpumalanga, Limpopo, Free State, North West, Gauteng, Western Cape, and Northern Cape with 3.69%, 3.68%, 3.62%, 2.90%, 2.90%, 2.84%, 1.66%, and 1.60%, respectively. The results show that the prevalence of IPV for women was high in households where the head of the household was a female, i.e., 14.13%, and it was 12.80% for households with male being the head of the household (p-value < .0001). Women with medium, high and low exposure to the media showed 16.26%, 6.85%, 3.83% prevalence, respectively (p-value < .0001). Women from the poorest, poorer, middle, richer, and richest wealth indexes showed a 5.78%, 6.73%, 6.89%, 5.11%, and 2.42% prevalence of IPV, respectively (p-value < .0001). Women from a household with less than five family members and those with five or more family members showed a 20.84% and 6.10% prevalence, respectively (p-value < .0001). The table also shows that 24.28% and 2.44% of women viewed wife-beating attitudes as unacceptable and acceptable, respectively, while 0.21% were those who did not comment regarding the matter and selected do not know (p-value < .0001). The table reveals that the prevalence of IPV in women who terminated pregnancy was 3.77%, and 23.16% for those who had never terminated a pregnancy (p-value < .0001). Regarding contraceptive use, 14.86% of women were using and 12.07% were not using any contraceptive method (p-value < .0001). Single, married, and those living with a partner exhibited a 14.15%, 7.48%, and 5.30% prevalence of IPV, respectively (p-value < .0001). Women who cohabited with a partner for 0-4 years accounted for 24.18%, and those with 5-9 years accounted for 2.75% prevalence of IPV, respectively (p-value = 0.0003).
Table 1 reveals that women having a partner who wants the same number of children as she does, wants more than her, wants fewer than her, and a woman who does not know her partner's desire for children, showed a 12.65%, 5.32%, 1.52%, and 7.45% of prevalence, respectively (p-value < .0001). Women who had a partner with no education, primary, secondary, higher education, and who did not know regarding her partner's level of education showed a 1.16%, 3.03%, 18.31%, 4.28%, and 0.15% of prevalence, respectively (p-value = 0.0130). Women who had an employed or unemployed partner showed 22.68% and 4.25% of prevalence, respectively (p-value = 0.0198). Employed women, not employed, and those not knowing showed 14.81%, 11.02%, and 1.10% of prevalence, respectively (p-value < .0001). We also investigated the knowledge of STIs; Table 1 shows that women who knew about STIs showed a 26.64% prevalence and those who did not exhibited a prevalence of 0.29% (p-value < .0001). For women with a partner less than 25, between 25 and 34, and 35 years of age and above, reported a prevalence of IPV of 1.63%, 9.42%, and 15.88%, respectively (p-value < .0001). Table 1 also reveals a 8.49%, 16.33%, and 2.11% prevalence of IPV for women deciding what to do with their earnings alone, both the woman and her partner, and the partner by himself, respectively (p-value = 0.0011). The table shows that women with a husband/partner who drinks alcohol, does not drink alcohol, and who do not know, showed a prevalence of 14.34%, 12.50% and 0.09%, respectively (p-value < .0001). Women who had never witnessed their father beat their mother, witnessed, and those who did not know, showed a 19.96%, 5.27% and 1.70% of prevalence of IPV, respectively (p-value < .0001).
| Indicator | Category | Experienced IPV | P-Value | |
|---|---|---|---|---|
| YES N (%) | NO N (%) | |||
| IPV | 5968(32.25) | 12538(67.75) | ||
| Respondent current age | Continuous | Minimum=15 | ||
| Mean=27.94 | ||||
| Maximum=49 | ||||
| Region | Kampala | 290(1.57) | 1010(5.46) | <.0001 |
| South Buganda | 471(2.55) | 1144(6.18) | ||
| North Buganda | 459(2.48) | 951(5.14) | ||
| Busoga | 538(2.91) | 992(5.36) | ||
| Bukedi | 441(2.38) | 764(4.13) | ||
| Busigu | 316(1.71) | 641(3.46) | ||
| Teso | 412(2.23) | 935(5.05) | ||
| Karamoja | 275(1.49) | 466(2.52) | ||
| Lango | 402(2.17) | 834(4.51) | ||
| Acholi | 346(1.87) | 764(4.13) | ||
| West Nile | 466(2.52) | 815(4.40) | ||
| Bunyoro | 300(1.62) | 913(4.93) | ||
| Tooro | 419(2.26) | 882(4.77) | ||
| Ankole | 524(2.83) | 777(4.20) | ||
| Kigezi | 309(1.67) | 650(3.51) | ||
| Type of place of residence | Rural | 1188(6.42) | 3191(17.24) | <.0001 |
| Urban | 4780(25.83 | 9347(50.51) | ||
| Woman's education level | No education | 836(4.52) | 1235(6.67) | <.0001 |
| Primary | 3733(20.17 | 7160(38.69) | ||
| Secondary | 1093(5.91) | 3120(16.86) | ||
| Higher | 306(1.65) | 1023(5.53) | ||
| Number of household members | Less than 5 | 3513(18.98) | 5577(30.14) | <.0001 |
| More than or equal to 5 | 2455(13.27) | 6961(37.61) | ||
| Sex of household head | Male | 4316(23.32) | 8035(43.42) | <.0001 |
| Female | 1652(8.93) | 4503(24.33) | ||
| Literacy | Cannot read | 2513(13.58) | 3941(21.30) | <.0001 |
| Able to read | 3455(18.67) | 8597(46.46) | ||
| Wife-beating attitude | Unacceptable | 2717(14.68) | 6481(35.02) | <.0001 |
| Acceptable | 3198(17.28) | 5770(31.18) | ||
| I don't know | 53(0.29) | 287(1.55) | ||
| Access to the media | Low exposure | 2293(12.39) | 4483(24.22) | <.0001 |
| Medium exposure | 3554(19.20 | 7436(40.18) | ||
| High exposure | 121(0.65) | 619(3.34) | ||
| Wealth index combined | Poorest | 1504(8.13) | 2380(12.86) | <.0001 |
| Poorer | 1319(7.13) | 2321(12.54) | ||
| Middle | 1152(6.23) | 2333(12.61) | ||
| Richer | 1047(5.66) | 2407(13.01) | ||
| Richest | 946(5.11) | 3097(16.74) | ||
| Ever had a terminated pregnancy | No | 4527(24.46) | 10651(57.55) | <.0001 |
| Yes | 1441(7.79) | 1887(10.20) | ||
| Contraceptive method used | No | 3836(20.73) | 9252(49.99) | <.0001 |
| Yes | 2132(11.52) | 3286(17.76) | ||
| Body Mass Index | Underweight | 536(2.90) | 1085(5.86) | 0.0588 |
| Healthy | 4103(22.17) | 8435(45.58) | ||
| Overweight | 899(4.86) | 2029(10.96) | ||
| Obese | 430(2.32) | 989(5.34) | ||
| Current marital status | Single | 967(5.23) | 6160(33.29) | <.0001 |
| Married | 2548(13.77) | 3265(17.64) | ||
| Living with partner | 2453(13.26) | 3113(16.82) | ||
| Number of other wives/partners | No other wives/partners | 3957(21.38) | 9237(49.91) | <.0001 |
| One other wife/partner | 1722(9.31) | 2883(15.58) | ||
| I don't know | 289(1.57) | 419(2.27) | ||
| Cohabitation duration | 0-4 | 4657(25.16) | 10583(57.19) | <.0001 |
| 5-9 | 1311(7.08) | 1955(10.56) | ||
| Partner's desire for children | Both want same | 2092(11.30) | 4672(25.25) | <.0001 |
| Partner wants more | 2109(11.40) | 3996(21.59) | ||
| Partner wants fewer | 579(3.13) | 1239(6.68) | ||
| Don't know | 1188(6.42) | 2633(14.23) | ||
| Partner's education level | No education | 516(2.79) | 748(4.04) | <.0001 |
| Primary | 3334(18.02) | 6031(32.59) | ||
| Secondary | 1456(7.87) | 3652(19.73) | ||
| Higher | 542(2.93) | 1708(9.23) | ||
| Don't know | 120(0.65) | 399(2.16) | ||
| Partner's occupation status | Unemployed | 216(1.17) | 506(2.73) | 0.1795 |
| Employed | 5752(31.08) | 12033(65.02) | ||
| Woman's occupation status | Unemployed | 822(4.44) | 3268(17.66) | <.0001 |
| Employed | 5146(27.81) | 9270(50.09) | ||
| Partner's age | Less than 25 | 594(3.21) | 3410(18.43) | <.0001 |
| Between 25 and 34 | 2102(11.36) | 4283(23.14) | ||
| 35 and above | 3272(17.68) | 4845(26.18) | ||
| Woman earnings compared to partner | More than him | 568(3.07) | 780(4.21) | <.0001 |
| Less than him | 4271(23.08) | 7950(42.96) | ||
| About the same | 855(4.62) | 2695(14.56) | ||
| Partner doesn't bring in | 101(0.55) | 317(1.71) | ||
| Don't know | 173(0.93) | 796(4.30) | ||
| Knowledge of Sexually Transmitted Infections (STIs) | No | 6(0.03) | 50(0.27) | 0.0006 |
| Yes | 5962(32.22) | 12488(67.48) | ||
| The person who usually decide on what to do with the woman's earnings | Woman alone | 3439(18.58) | 6163(33.30) | <.0001 |
| Woman and partner | 2093(11.31) | 5138(27.76) | ||
| Partner alone | 436(2.36) | 1237(6.69) | ||
| Partner drinks alcohol | No | 3023(16.34) | 9396(50.77) | <.0001 |
| Yes | 2945(15.91) | 3142(16.98) | ||
| Woman's father ever beat her mother | No | 3253(17.58 | 8799(47.55) | <.0001 |
| Yes | 2450(13.24 | 3332(18.00) | ||
| Don't know | 265(1.43) | 407(2.20) | ||
Table 2 shows that the region with the highest prevalence is Busonga at 2.91%, followed by Ankole, South Buganda, West Nile, North Buganda, Bukedi, Tooro, Teso, Lango, Acholi, Busigu, Kigezi, Bunyoro, Kampala, and Karamoja regions, at 2.83%, 2.55%, 2.52%, 2.48%, 2.38%, 2.26%, 2.23%, 2.17%, 1.87%, 1.71%, 1.67%, 1.62%, 1.57%, and 1.49%, respectively. The highest prevalence of IPV is in urban parts of the country, with 25.83%, while the prevalence in rural areas is 6.42% (p-value < .000). About 20.17% of the women have experienced IPV with primary education, 5.91% with secondary education, 4.52% with no education, and 1.65% with higher education (p-value < .0001). Women from a household with less than five family members and those with five or more family members showed an 18.98% and 13.27% prevalence rate, respectively (p-value < .0001). The table also shows that 14.68%, 17.28%, and 0.29% of women view wife-beating attitudes as unacceptable, acceptable, and not knowing regarding the matter, respectively (p-value < .0001).
Table 2 also shows that women from a household where the head of the house is a male show a prevalence rate of 23.32%, and where the head of the house is female, 8.93% prevalence rate is observed (p-value < .0001). We can also see that women who can read have an 18.67% prevalence, and those who cannot read 13.58% (p-value < .0001). Women with medium exposure to the media showed a high prevalence at 19.20%, followed by low and high exposure at 12.39% and 0.65%, respectively (p-value < .0001). The results show that women from the poorest, poorer, middle, richer, and richest wealth index have an 8.13%, 7.13%, 6.23%, 5.66%, and 5.11% of prevalence, respectively (p-value < .0001). The prevalence of IPV in women with terminated pregnancy is 7.79% and 24.46% for those who had never terminated a pregnancy (p-value < .0001). Table 2 shows that women who use contraceptive methods have a prevalence of 11.52% and those who do not 20.73% (p-value < .0001). Single, married, and those women cohabiting with a partner have a 5.23%, 13.77%, and 13.26% of prevalence, respectively (p-value < .0001). Women who have been staying with a partner for 0-4 years have a 25.16% prevalence rate and those with a partner for 5-9 years 7.08% (p-value < .0001). Women whose partner has no other wives/partners, one other wife/partner, and those who do not know whether their partner has other wives/partners, showed a prevalence rate of 21.38%, 9.31%, and 1.57%, respectively (p-value < .0001).
Table 2 reveals that women who have a partner who wants the same number of children as she does, wants more than her, wants fewer than her, and those who do not know their partner's desire for children showed an 11.30%, 11.40%, 3.13%, and 6.42% of prevalence, respectively (p-value < .0001). Women who had a partner with no education, primary, secondary, higher education, and who do not know regarding their partner's level of education showed a 2.79%, 18.02%, 7.87%, 2.93%, and 0.65%, respectively (p-value < .0001). Employed and unemployed women showed a prevalence rate of 27.81% 4.44%, respectively (p-value < .0001). Women who earned more than their partner, less than their partner, about the same as their partner, whose partner does not bring anything, and those who did not know what their partner earns showed a 3.07%, 23.085, 4.62%, 0.55%, and 0.93% of prevalence rate, respectively (p-value < .0001). Women with a partner who is less than 25, between 25 and 34, and 35 years of age and above, exhibited a prevalence rate of 3.21%, 11.36%, and 17.68%, respectively (p-value < .0001). Women who decided on their own what to do with their earning, decided along with their partner, and whose partner decided alone displayed a prevalence rate of 18.58%, 11.31%, and 2.36%, respectively (p-value < .0001). We also investigated the knowledge of STIs. The table shows that women who knew about STIs showed a 32.22% prevalence rate and those who did not 0.03% (p-value = 0.0006). Women with a husband/partner who drinks alcohol or does not drink alcohol exhibited a 15.91% and 16.34% prevalence, respectively (p-value < .0001). Table 2 also shows that women whose father never beat their mother or did beat their mother showed a 17.58% and 13.24% prevalence, respectively (p-value < .0001).
4. STATISTICAL ANALYSIS
The results from the bivariate analysis with a p-value of less than 5% level of significance were included in multivariate GAMM analysis.
4.1. Model Formulation
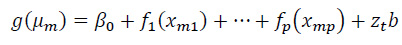
The normality assumption and linearity inherent in linear regression can be relaxed by the generalized additive mixed model [34]. Generalized additive mixed models are suggested for wide-spread and correlated data, which frequently arise in research involving clustered, hierarchical and spatial designs [34]. These models allow pliable practical dependence of an outcome variable on predictors by utilizing non-parametric regression while considering for correlation amongst observations by using random-effects [34, 35]. The pliability of non-parametric regression for constant covariates integrates with linear models for independent variables by the possible means to uncover structures within the data that may be overlooked by linear assumptions [36]. Generalized additive mixed models are perceived as extensions of generalized additive models (GAM) to include random effects or generalized linear mixed models [35, 37]. These models enable the parametric fixed effects to be modeled non-parametrically using smooth additive functions in an equivalent manner [35, 38]. For instance, the observations of the mth of k units comprise a dependent variable ym and p covariates xm = (1,xm1,...,xmp)T associated with fixed effects and q x 1 of covariates zm associated with random effects [35]. Lin and Zhang [34] formulated generalized additive mixed models (GAMM) as follows:
 |
(1) |
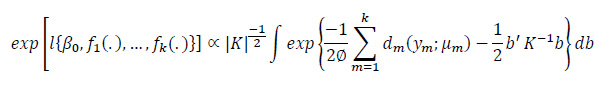
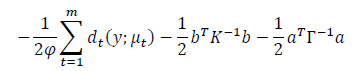
Where, g(.) is a monotonic differentiable link function [35], µm = E(ym|b), ƒm(.) is a centered twice-differentiable level function, and the random effect b is presumed to be distributed as N {0, K(ϑ)}. Furthermore, ϑ is a c x 1 vector of variance elements [35]. A primary characteristic of GAMM (1) above GAM is that the non-parametric additive functions help model covariate effects [34, 35]. Random effects help model the correlation amongst observations [34, 35]. Provided that ƒm(.) is a linear function, therefore GAMM (1) eases to generalized linear mixed model [35, 37]. For specified variance element ϑ, then the log-quasi-likelihood function of (β0, ƒm, ϑ, m = 1,2,..., k) is given as follows [34, 35]:
 |
(2) |
Where, ym = (y1,y2,...,yK) and dm (ym;µm) α - 2 ∫µmymmm (ym-u)/v(u)du define the conditional deviance function of {β0, ƒm(.),ϑ}, provided that b is given. The statistical inferences in GAMM include inferences on the non-parametric functions ƒm(.) that require the estimation of smoothing parameters and inferences on the variance elements ϑ . The linear mixed models and the smoothing spline predictors are closely related [34, 35].
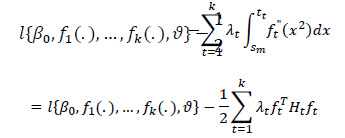
After the derivation of Lin and Zhang [34], with a specified λ and ϑ, the natural cubic smoothing spline predictors of the ƒm(.) maximize the penalized log-quasi-likelihood [35] as
 |
(3) |
Where, (st,tt) describes the span of the tth covariates and λt indicates smoothing variables that regulate the tradeoff between the goodness-of-fit and smoothness of the estimated functions [35]. Additionally, ƒm(.) is an rt x 1 unknown vector of the values of ƒm(.), calculated at the rt ordered distinctive values of the xmt(t = 1,2,...,m), and Ht is the complementary non-negative definite smoothing matrix [35-39]. GAMM, given in equation (1), can be formulated in matrix form as
 |
(4) |
Where, g(µt) = {g(µ1),g(µ2),...,g(µm)}, 1 is an m x 1 vector of 1's, Mt is an k x rt incident matrix described in the same way similar to that given earlier [35, 40], such that the tth element of Mmƒm is ƒm(xtm) and Zt = (z1, z2,...,zm)T . Numerical integration is required to estimate equation (3) other than the Gaussian outcome [35]. Natural cubic smoothing spline predictors of ƒt(.), evaluated by comprehensive maximization of equation (4), are sometimes demanding [35]. Lin and Zhang [34] suggested the double penalized quasi-likelihood model as a manageable alternative procedure for approximation in the model. Since ƒt is a centered parameter vector, it can be parametrized in terms of βt and αt((rt - 2) x 1) in a one-to-one transformation [34, 35, 41] as
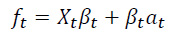 |
Where, Xt is an rt x 1 vector including the rh centered ordered distinctive values of the xtm(t = 1,2,...,m), and βt = Lt(LttLt)-1, and Lt is an rt x (rt - 2) full rank matrix fulfilling Ht = LtLTt and LTtXt = 0 utilizing the identity ƒTtHtƒt; the double penalized quasi-likelihood concerning (β0, ƒt) and b is given by
 |
(5) |
Where,  and Γ = diag(τ1I,τ2I,...,τkI) with τi =
  . A small value of τ = (τ1,τ2,...τk)T corresponds to over-smoothing [34, 41].
5. RESULTS
5.1. Model Fitting
The numerous approaches for estimation that have debated for fitting GAMM can be utilized when fitting the semiparametric logistic mixed model [35]. The mgcv library in the R package was utilized to fit the data. The R package has several options for managing the model smoothness, utilizing splines as cubic smoothing splines, locally-weighted running line smoothers, and kernel smoothers [35, 38, 39, 42]. The shrinkage smoothers have numerous advantages, such as bypassing the knot positioning [35]. Additionally, the procedure is built to smooth any covariates [34, 35]. In this work, we considered the primary effect and potential two-way interaction effects, the AIC of each model, the inference of smooth function, and the p-value of the individual smooth term [35]. Lastly, a model with smaller AIC and high statistical significance was selected as follows:
 |
(6) |
Where, g(µm) is the logit link function, β's are parametric regression coefficients,  are centered smooth functions and b0m is the random effect distributed as N(0,K(ϑ)) [35, 42]. The commonly used methods for estimating additive models incorporate cubic smoothing splines, locally-weighted running line smoothers, and kernel smoothers [35, 38, 42]. The results from the model (6) above are presented under each country section and are interpreted.
5.2. Interpretation of Results
5.2.1. South Africa
Table 3 shows that a woman whose partner drinks alcohol is 2.49 (OR=2.4905, p-value < 2e-16***) times more expected to experience IPV compared to a woman whose partner does not drink alcohol. A woman who does not know if her partner drinks alcohol or not is 5.90 (OR=5.9000, p-value = 0.004250**) times more expected to experience IPV compared to a woman whose partner does not drink alcohol. A woman who has witnessed her father beat her mother is 2.19 (OR=2.1884, p-value < 2e-16***) times more expected to experience IPV compared to a woman who has not witnessed her father beat her mother. A woman who does not know if her father beats her mother is 1.97 (OR=1.9691, p-value = 1.52e-07***) times more expected to experience IPV compared to a woman who has witnessed her father beat her mother. A woman from a household with more than five members is 0.45 (OR=0.4532, p-value < 2e-16***) times less expected to experience IPV compared to a woman from a household with five or fewer members. A woman who sees wife-beating as an acceptable act is 1.90 (OR=1.9049, p-value = 5.64e-09***) times more expected to experience IPV compared to a woman who sees wife-beating as unacceptable. A woman who does not know if the wife-beating is acceptable or not is 0.34 (OR=0.3400, p-value = 0.000142***) times less expected to experience IPV compared to a woman who sees wife-beating as unacceptable. A woman with medium exposure to the media is 1.37 (OR=1.3745, p-value = 0.000327***) times more expected to experience IPV compared to a woman with low exposure to the media.
A woman from the Eastern Cape province is 1.51 (OR=1.5099, p-value = 0.002482**) times more expected to experience IPV compared to a woman from the Western Cape province. A woman from the Free State province is 1.52 (OR=1.5218, p-value = 0.002389**) times more expected to experience IPV compared to a woman from the Western Cape province. A woman from Kwazulu-Natal province is 1.58 (OR=1.5806, p-value = 0.000628***) times more expected to experience IPV compared to a woman from the Western Cape province. A woman from North West province is 1.50 (OR=1.5024, p-value = 0.003626**) times more expected to experience IPV compared to a woman from the Western Cape province. A woman from the Gauteng province is 1.58 (OR=1.5841, p-value = 0.000774***) times more expected to experience IPV compared to a woman from the Western Cape province. A woman from Mpumalanga province is 1.48 (OR=1.4842, p-value = 0.004168**) times more expected to experience IPV compared to a woman from the Western Cape province. A woman from Limpopo province is positively associated with IPV. A woman from Limpopo province is 1.74 (OR=1.7437, p-value = 0.000101***) times more expected to experience IPV compared to a woman from the Western Cape province.
A woman from a household where the head of the house is female is 0.80 (OR=0.8030, p-value = 0.000934***) times less likely to experience IPV compared to a woman from a household where the head of the house is a male. A woman from the richer wealth index class is 0.67 (OR=0.6743, p-value = 0.004953**) times less expected to experience IPV compared to a woman from the poorest wealth index class. A woman from the richest wealth index class is 0.32 (OR=0.3243, p-value = 1.05e-10***) times less expected to experience IPV compared to a woman from the poorest wealth index class. A woman who has terminated pregnancy is 1.37 (OR=1.3695, p-value = 0.000277***) times more expected to experience IPV compared to a woman who has never terminated a pregnancy. A woman who is obese (BMI≥30) is 0.67 (OR=0.6743, p-value = 0.018388*) times less expected to experience IPV compared to an underweight woman (BMI<18). A married woman is 1.47 (OR=1.4650, p-value = 2.44e-06***) times more expected to experience IPV compared to a single woman. A woman living with her partner is 1.57 (OR=1.5717, p-value = 7.58e-07***) times more expected to experience IPV compared to a single woman. A woman with a partner who desires more children compared to her is 1.45 (OR=1.4473, p-value = 1.82e-06***) times more expected to experience IPV compared to a woman whose partner wants the same number of children as her. A woman with a partner who wants fewer children compared to her is 1.51 (OR=1.5140, p-value = 0.001279***) times more expected to experience IPV compared to a woman whose partner wants the same number of children as her. A woman who does not know the number of children her partner wants is 1.40 (OR=1.3964, p-value = 5.77e-07***) times more expected to experience IPV compared to a woman whose partner's desire for children is the same as her.
A woman with an employed partner is 2.17 (OR=2.1655, p-value = 0.000799***) times more expected to experience IPV compared to a woman whose partner is unemployed. An employed woman is 1.21 (OR=1.2122, p-value = 0.001994**) times more expected to experience IPV compared to an unemployed woman. A woman with a partner between 25 to 34 years of age is 0.77 (OR=0.7650, p-value = 0.036368*) times less expected to experience IPV compared to a woman whose partner is less than 25 years old. A woman with a partner equal to or greater than 35 years old is 0.67 (OR=0.6553, p-value = 0.003263**) times less expected to experience IPV compared to a woman whose partner is less than 25 years old. A woman who decides with her partner what to do with her earning is 0.87 (OR=0.8566, p-value = 0.018921*) times less expected to experience IPV compared to a woman who solely decides how to spend her earning. A woman who earns about the same as her partner is 1.30 (OR=1.2988, p-value = 0.007599**) times more expected to experience IPV compared to a woman who earns more compared to her partner. A woman whose partner does not bring in his earnings is 1.34 (OR=1.3494, p-value = 0.013337*) times more expected to experience IPV compared to a woman who earns more compared to her partner. A woman who does not know how much her partner earns is 1.43 (OR=1.4279, p-value = 0.024263*) times more expected to experience IPV compared to a woman who earns more compared to her partner.
| Effects | Estimate | Standard Error | t-value | P-value | Odds Ratio |
|---|---|---|---|---|---|
| Intercept | -3,315692 | 0,345442 | -9,598 | <2e-16*** | 0,0363 |
| Partner drinks alcohol (ref=No) | |||||
| Yes | 0,912471 | 0,056567 | 16,131 | <2e-16*** | 2,4905 |
| Don't know | 1,774949 | 0,620662 | 2,86 | 0,004250** | 5,9000 |
| Woman's father ever beat her mother (ref=No) | |||||
| Yes | 0,783176 | 0,079147 | 9,895 | <2e-16*** | 2,1884 |
| Don't know | 0,677596 | 0,128967 | 5,254 | 1,52e-07*** | 1,9691 |
| Number of household members (ref=Less compared to 5) | |||||
| More compared to 5 | -0,791347 | 0,064592 | -12,251 | <2e-16*** | 0,4532 |
| Wife beating attitude (ref=Unacceptable) | |||||
| Acceptable | 0,644407 | 0,110471 | 5,833 | 5,64e-09*** | 1,9049 |
| I don't know | -1,078901 | 0,28348 | -3,806 | 0,000142*** | 0,3400 |
| Access to the media (ref=Low exposure) | |||||
| Medium exposure | 0,318069 | 0,088488 | 3,594 | 0,000327*** | 1,3745 |
| High exposure | 0,158442 | 0,10711 | 1,479 | 0,139113 | 1,1717 |
| Region (ref=Western Cape) | |||||
| Eastern Cape | 0,412044 | 0,136149 | 3,026 | 0,002482** | 1,5099 |
| Northern Cape | -0,241707 | 0,150897 | -1,602 | 0,109236 | 0,7853 |
| Free State | 0,419888 | 0,138212 | 3,038 | 0,002389** | 1,5218 |
| Kwazulu-Natal | 0,457814 | 0,133845 | 3,42 | 0,000628*** | 1,5806 |
| North West | 0,407086 | 0,139903 | 2,91 | 0,003626** | 1,5024 |
| Gauteng | 0,459995 | 0,13677 | 3,363 | 0,000774*** | 1,5841 |
| Mpumalanga | 0,39485 | 0,137772 | 2,866 | 0,004168** | 1,4842 |
| Limpopo | 0,556036 | 0,142938 | 3,89 | 0,000101*** | 1,7437 |
| Type of residence (ref=Rural) | |||||
| Urban | -0,033638 | 0,072605 | -0,463 | 0,643157 | 0,9669 |
| Woman's highest education level (ref=No education) | |||||
| Primary education | -0,179293 | 0,220624 | -0,813 | 0,416434 | 0,8359 |
| Secondary education | -0,018054 | 0,224895 | -0,08 | 0,936017 | 0,9821 |
| Higher education | -0,002704 | 0,245996 | -0,011 | 0,99123 | 0,9973 |
| Sex of household head (ref=Male) | |||||
| Female | -0,219375 | 0,06626 | -3,311 | 0,000934*** | 0,8030 |
| Literacy (ref=Can read) | |||||
| Cannot read | 0,010613 | 0,166142 | 0,064 | 0,949068 | 1,0107 |
| Wealth index combined (ref=Poorest) | |||||
| Poorer | -0,121217 | 0,124796 | -0,971 | 0,331416 | 0,8858 |
| Middle | -0,01027 | 0,127346 | -0,081 | 0,935727 | 0,9898 |
| Richer | -0,394082 | 0,140201 | -2,811 | 0,004953** | 0,6743 |
| Richest | -1,126115 | 0,174102 | -6,468 | 1,05e-10*** | 0,3243 |
| Ever had a terminated pregnancy (ref=No) | |||||
| Yes | 0,314463 | 0,086445 | 3,638 | 0,000277*** | 1,3695 |
| Contraceptive use (ref=Not using) | |||||
| Using | 0,018269 | 0,122071 | 0,15 | 0,881038 | 1,0184 |
| Body Mass Index (ref=Underweight(BMI<18)) | |||||
| Healthy (18≤BMI<25) | -0,1735562 | 0,169657 | -1,023 | 0,306328 | 0,8407 |
| Overweight (25≤BMI<30) | -0,247527 | 0,170754 | -1,45 | 0,147205 | 0,7807 |
| Obese (BMI≥30) | -0,394102 | 0,167122 | -2,358 | 0,018388* | 0,6743 |
| Current marital status (ref=Single) | |||||
| Married | 0,381886 | 0,080966 | 4,717 | 2,44e-06*** | 1,4650 |
| Living with partner | 0,452133 | 0,091347 | 4,95 | 7,58e-07*** | 1,5717 |
| Number of other wives (ref=0) | |||||
| 1 or more | -0,092647 | 0,092647 | -0,545 | 0,586075 | 0,9115 |
| Don't know | -0,017783 | 0,128194 | -0,139 | 0,889675 | 0,9824 |
| Cohabitation period (ref=0-4 years) | |||||
| 5-9 years | 0,091619 | 0,114166 | 0,803 | 0,422284 | 1,0959 |
| Partner's desire for children (ref=Both want same) | |||||
| Husband wants more | 0,369722 | 0,077418 | 4,776 | 1,82e-06*** | 1,4473 |
| Husband wants fewer | 0,414754 | 0,128733 | 3,222 | 0,001279** | 1,5140 |
| Don't know | 0,333889 | 0,066741 | 5,003 | 5,77e-07*** | 1,3964 |
| Partner's education level (ref=No education) | |||||
| Primary education | 0,144755 | 0,156019 | 0,928 | 0,353537 | 1,1558 |
| Secondary education | 0,085726 | 0,147189 | 0,582 | 0,5603 | 1,0895 |
| Higher | 0,200253 | 0,167645 | 1,195 | 0,232314 | 1,2217 |
| Don't know | -0,264443 | 0,420023 | -0,63 | 0,528979 | 0,7676 |
| Partner's occupation (ref=Unemployed) | |||||
| Employed | 0,772655 | 0,230342 | 3,354 | 0,000799*** | 2,1655 |
| Don't know | 0,054147 | 0,080887 | 0,669 | 0,503248 | 1,0556 |
| Woman's occupation (ref=Unemployed) | |||||
| Employed | 0,192462 | 0,062245 | 3,092 | 0,001994** | 1,2122 |
| Don't know | -0,022983 | 0,141177 | -0,163 | 0,870683 | 0,9773 |
| Partner's age (ref=Less than 25 years) | |||||
| 25 to 34 years | -0,267872 | 0,127977 | -2,093 | 0,036368* | 0,7650 |
| 35 years and above | -0,422714 | 0,143649 | -2,943 | 0,003263** | 0,6553 |
| Person who usually decide on woman's earnings (ref=Woman alone) | |||||
| Woman and partner | -0,154738 | 0,065915 | -2,348 | 0,018921* | 0,8566 |
| Partner alone | -0,110197 | 0,116523 | -0,946 | 0,344326 | 0,8957 |
| Woman's earnings compared to partner (ref=More compared to him) | |||||
| Less compared to him | 0,12871 | 0,074828 | 1,72 | 0,085457. | 1,1374 |
| About the same | 0,261424 | 0,09791 | 2,67 | 0,007599** | 1,2988 |
| Partner does not bring in earnings | 0,299646 | 0,121062 | 2,475 | 0,013337* | 1,3494 |
| Don't know | 0,356187 | 0,15807 | 2,253 | 0,024263* | 1,4279 |
| Knows regarding STIs (ref=No) | |||||
| Yes | 0,772655 | 0,230342 | 3,354 | 0,000799*** | 2,1655 |
| Interaction effects | |||||
| Wealth index combined (ref=Poorest) by contraceptive use (ref=Not using) | |||||
| Poorer by using contraceptives | 0,274623 | 0,1663 | 1,652 | 0,098473. | 1,3160 |
| Middle by using contraceptives | -0,059718 | 0,1636 | -0,364 | 0,715679 | 0,9420 |
| Richer by using contraceptives | 0,235772 | 0,1721 | 1,367 | 0,171718 | 1,2659 |
| Richest by using contraceptives | 0,460516 | 0,2056 | 2,23 | 0,025785* | 1,5849 |
A woman who knows about STIs is 2.17 (OR=2.1655, p-value = 0.000799***) times more likely to experience IPV compared to a woman with no knowledge of STIs.
| Smooth Terms | Edf | F-Value | P-Value |
|---|---|---|---|
| s (Woman's current age) | 8.702 | 19.18 | <2e-16*** |
5.3. Interaction Effects
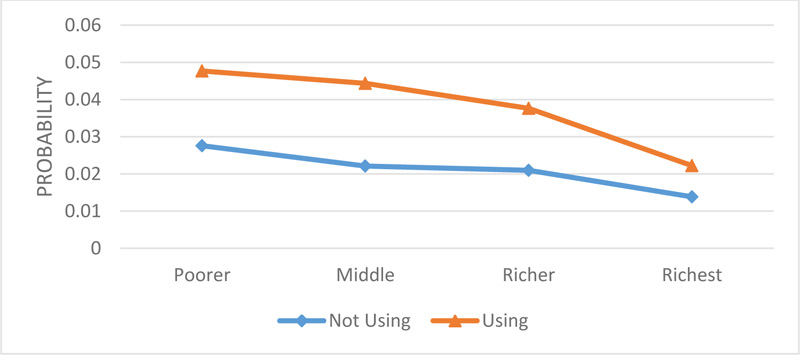
In Fig. (1), we observe that IPV decreases for both women who are not using and those who are using contraceptives from the different wealth index classes, from poorer, middle, richer, and is lowest with the richest class. Those who are using contraceptives have a higher prevalence of IPV for all the wealth index classes compared to those who are not using contraceptives. The main aim of the interaction effects is to determine which women from the different wealth index classes, i.e., who are using or not using contraceptives, are at a high risk of experiencing IPV.
5.4. Approximation Smooth Function
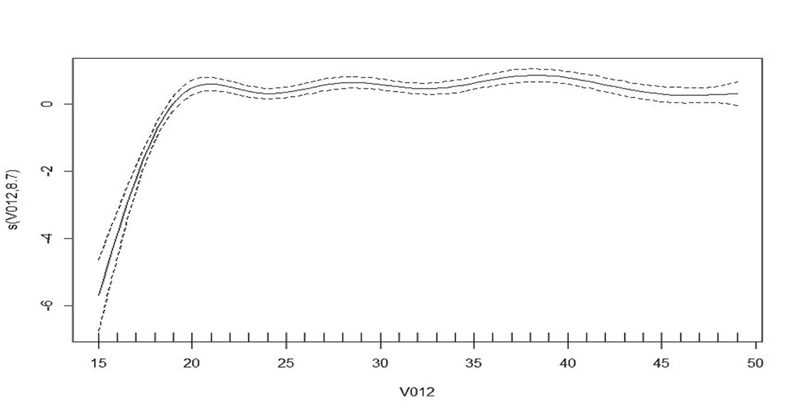
Table 4 shows that the current age of a woman has a significant impact on intimate partner violence. The letter s in Table 4 characterizes the smoothing term, and the value in parenthesis shows the predicted degree of freedom (edf). The test statistic for woman's age (19.18), together with a p-value (<2e-16), shows that there is no linear trend related to IPV. As affirmed in Fig. (2), the trend shows that the effect of age on IPV increases as the woman's age increases up to approximately 20 years and slightly remains constant until about 38 years. It starts to decrease from about 39 to 49 years.

5.4.1. Uganda
Table 5 shows that a woman whose partner drinks alcohol is 2.54 (OR=2.5393, p-value < 2e-16***) times more likely to experience IPV compared to a woman whose partner does not drink alcohol. A woman who has witnessed her father beat her mother is 1.77 (OR=1.7736, p-value < 2e-16***) times more likely to experience IPV compared to a woman who has not witnessed her father beat her mother. A woman who does not know if her father beats her mother is 1.84 (OR=1.8360, p-value = 6.25e-11***) times more likely to experience IPV compared to a woman who has not witnessed her father beat her mother. A woman from a household with more than five members is 0.55 (OR=0.5496, p-value < 2e-16***) times less likely to experience IPV compared to a woman from a household with less than five members. A woman who sees wife-beating as an acceptable act is 1.16 (OR=1.1638, p-value = 6.22e-05***) times more likely to experience IPV compared to a woman who sees wife-beating as unacceptable. A woman who does not know if the wife-beating act is acceptable or not is 0.63 (OR=0.6278, p-value = 0.005756**) times less likely to experience IPV compared to a woman who sees wife-beating as an unacceptable act. A woman with high exposure to the media is 0.70 (OR=0.6964, p-value = 0.0005604**) times less likely to experience IPV compared to a woman with low exposure to the media.
A woman from Busoga province is 1.25 (OR=1.2506, p-value = 0.042770*) times more likely to experience IPV compared to a woman from Kampala province. A woman from Teso province is 0.79 (OR=0.7919, pvalue = 0.048915*) times less likely to experience IPV compared to a woman from Kampala province. A woman from Karamoja province is 0.56 (OR=0.564452, p-value = 5.71e-05***) times less likely to experience IPV compared to a woman from Kampala province. A woman from Lango is 0.77 (OR=0.7690, p-value = 0.027850*) times less likely to experience IPV compared to a woman from Kampala province. A woman from Acholi province is 0.72 (OR=0.7178, p-value = 0.006486**) times less likely to experience IPV compared to a woman from Kampala province. A woman from Bunyoro province is 0.68 (OR=0.6776, p-value = 0.000954***) times less likely to experience IPV compared to a woman from Kampala province.
A woman from a household where the head of the house is female is 0.84 (OR=0.8437, p-value = 0.000278***) times less likely to experience IPV compared to a woman from a household with a male as the head of the house. A woman from the richest wealth index class is 0.66 (OR=0.6594, p-value = 1.33e-05***) times less likely to experience IPV compared to a woman from the poorest wealth index class. A woman who has terminated a pregnancy is 1.12 (OR=1.1197, p-value = 0.010853*) times more likely to experience IPV compared to a woman who has never terminated a pregnancy. A woman who uses contraceptives is 1.40 (OR=1.3963, p-value = 0.000286***) times more likely to experience IPV compared to a woman who does not use contraceptives. A woman who is overweight (25≤BMI<30) is 0.82 (OR=0.8237, p-value = 0.012199*) times less likely to experience IPV compared to an underweight woman (BMI<18). A married woman is 2.76 (OR=2.7649, p-value < 2e-16***) times more likely to experience IPV compared to a single woman. A woman living with her partner is 2.81 (OR=2.8123, p-value < 2e-16***) times more likely to experience IPV compared to a single woman.
A woman who has a partner with more than one wife/partner is 1.14 (OR=1.1421, p-value = 0.002137**) times more likely to experience IPV compared to a woman whose partner does not have other wives. A woman who does not know if her partner has other wives or not is 1.51 (OR=1.5089, p-value = 5.54e-06***) times more likely to experience IPV compared to a woman whose partner does not have other wives/partners. A woman who does not know the number of children her partner wants is 0.85 (OR=0.8517, p-value = 0.001363**) times less likely to experience IPV compared to a woman whose partner's desire for children is the same as her. A woman with a secondary education partner is 0.81 (OR=0.8120, p-value = 0.012295**) times less likely to experience IPV compared to a woman whose partner has no education. A woman whose partner has a higher education level is 0.73 (OR=0.7318, p-value = 0.001321**) times less likely to experience IPV compared to a woman whose partner has no education. A woman who does not know her partner's level of education is 0.55 (OR=0.5545, p-value = 2.10e-05***) times less likely to experience IPV compared to a woman whose partner has no education. An employed woman is 1.13 (OR=1.1379, p-value = 0.022295*) times more likely to experience IPV compared to an unemployed woman. A woman who decides with her partner what to do with her earning is 0.83 (OR=0.8266, p-value = 2.98e-06***) times less likely to experience IPV compared to a woman who solely decides how to spend her earnings. A woman whose partner decides how to spend her earnings is 0.70 (OR=0.6984, p-value = 3.95e-07***) times less likely to experience IPV compared to a woman who solely decides how to spend her earnings. A woman who earns about the same as her partner is 0.69 (OR=0.6855, p-value = 1.16e-06***) times less likely to experience IPV compared to a woman who earns more compared to her partner. A woman whose partner does not bring in his earnings is 0.65 (OR=0.6473, p-value = 0.021089*) times less likely to experience IPV compared to a woman who earns more compared to her partner.
| Effects | Estimate | Standard Error | t-value | P-Value | Odds Ratio |
|---|---|---|---|---|---|
| Intercept | -0,258 | 0,4997 | -5,163 | 2,46e-07*** | 0,7725952 |
| Partner drinks alcohol (ref=No) | |||||
| Yes | 0,9319 | 0,038 | 24,524 | <2e-16*** | 2,5393293 |
| Woman's father ever beat her mother (ref=No) | |||||
| Yes | 0,573 | 0,03855 | 14,865 | <2e-16*** | 1,7735798 |
| Don't know | 0,6076 | 0,09288 | 6,541 | 6,25e-11*** | 1,8360197 |
| Number of household members (ref=more compared to 5) | |||||
| Less compared to 5 | -0,5985 | 0,03773 | -15,861 | <2e-16*** | 0,5496355 |
| Wife beating attitude (ref=Unacceptable) | |||||
| Acceptable | 0,1517 | 0,03789 | 4,005 | 6,22e-05*** | 1,163811 |
| I don't know | -0,4655 | 0,03789 | -2,762 | 0,005756** | 0,6278211 |
| Access to the media (ref=Low exposure) | |||||
| Medium exposure | -0,03716 | 0,04047 | -0,785 | 0,432592 | 0,963522 |
| High exposure | -0,3618 | 0,01306 | -2,77 | 0,0005604** | 0,6964216 |
| Region (ref=Kampala) | |||||
| South Buganda | -0,01937 | 0,104 | -0,186 | 0,852171 | 0,9808164 |
| North Buganda | -0,0168 | 0,1093 | -0,154 | 0,877885 | 0,9833403 |
| Busoga | 0,2236 | 0,1103 | 2,026 | 0,042770* | 1,2505707 |
| Bukedi | 0,03018 | 0,1166 | 0,259 | 0,795697 | 1,03064 |
| Busigu | -0,1342 | 0,1208 | -1,111 | 0,266778 | 0,8744152 |
| Teso | -0,2333 | 0,1185 | -1,969 | 0,048915* | 0,791916 |
| Karamoja | -0,5719 | 0,1421 | -4,025 | 5,71e-05*** | 0,564452 |
| Lango | -0,2627 | 0,1195 | -2,198 | 0,027950* | 0,7689726 |
| Acholi | -0,3315 | 0,1218 | -2,722 | 0,006486** | 0,7178462 |
| West Nile | -0,06942 | 0,1172 | -0,592 | 0,553707 | 0,9329348 |
| Bunyoro | -0,3892 | 0,1178 | -3,304 | 0,000954*** | 0,6775987 |
| Tooro | -0,01282 | 0,1135 | -0,113 | 0,910043 | 0,9872618 |
| Ankole | 0,2093 | 0,1125 | 1,861 | 0,062817. | 1,2328148 |
| Kigezi | -0,1163 | 0,1221 | -0,952 | 0,34094 | 0,8902081 |
| Type of residence(ref=Rural) | |||||
| Urban | -0,1122 | 0,05547 | -2,023 | 0,043052* | 0,8938655 |
| Woman's highest education level (ref=No education) | |||||
| Primary education | 0,07356 | 0,06462 | 1,138 | 0,255014 | 1,0763331 |
| Secondary education | 0,09883 | 0,08421 | 1,174 | 0,240579 | 1,1038786 |
| Higher education | 0,08128 | 0,1171 | 0,694 | 0,487742 | 1,0846746 |
| Sex of household head (ref=Male) | |||||
| Female | -0,1697 | 0,04667 | -3,636 | 0,000278*** | 0,8439 |
| Literacy (ref=Cannot read) | |||||
| Can read | -0,01623 | 0,04681 | -0,347 | 0,728867 | 0,9839 |
| Wealth index combined (ref=Poorest) | |||||
| Poorer | 0,02224 | 0,0684 | 0,325 | 0,745029 | 1,0225 |
| Middle | -0,09092 | 0,07466 | -1,218 | 0,223279 | 0,9131 |
| Richer | -0,1532 | 0,07973 | -1,921 | 0,054753. | 0,8580 |
| Richest | -0,4164 | 0,0956 | -4,356 | 1,33e-05*** | 0,6594 |
| Ever had a terminated pregnancy (ref=No) | |||||
| Yes | 0,1131 | 0,04441 | 2,548 | 0,010853* | 1,1197 |
| Contraceptive use (ref=Not using) | |||||
| Using | 0,3338 | 0,09199 | 3,628 | 0,000286*** | 1,3963 |
| Body Mass Index (ref=Underweight(BMI<18)) | |||||
| Healthy (18≤BMI<25) | -0,07095 | 0,06529 | -1,087 | 0,277192 | 0,9315 |
| Overweight (25≤BMI<30) | -0,194 | 0,07739 | -2,507 | 0,012199* | 0,8237 |
| Obese (BMI≥30) | -0,1525 | 0,09212 | -1,655 | 0,097855. | 0,8586 |
| Current marital status (ref=Single) | |||||
| Married | 1,017 | 0,05666 | 17,945 | <2e-16*** | 2,7649 |
| Living with partner | 1,034 | 0,05506 | 18,787 | <2e-16*** | 2,8123 |
| Number of other wives (ref=0) | |||||
| 1 or more | 0,1329 | 0,04328 | 3,071 | 0,002137** | 1,1421 |
| Don't know | 0,4114 | 0,09052 | 4,545 | 5,54e-06*** | 1,5089 |
| Cohabitation period (ref=0-4 years) | |||||
| 5-9 years | 0,06102 | 0,07522 | 0,811 | 0,417251 | 1,0629 |
| Partner's desire for children (ref=Both want same) | |||||
| Husband wants more | 0,01193 | 0,04457 | 0,268 | 0,788976 | 1,0120 |
| Husband wants fewer | -0,1247 | 0,06637 | -1,88 | 0,060177. | 0,8828 |
| Don't know | -0,1605 | 0,0501 | -3,203 | 0,001363** | 0,8517 |
| Partner's education level (ref=No education) | |||||
| Primary education | -0,1445 | 0,0765 | -1,888 | 0,058979. | 0,8655 |
| Secondary education | -0,2082 | 0,08314 | -2,504 | 0,012295* | 0,8120 |
| Higher | -0,3123 | 0,1 | -3,212 | 0,001321** | 0,7318 |
| Don't know | -0,5896 | 0,1386 | -4,255 | 2,10e-05*** | 0,5545 |
| Partner's occupation (ref=Unemployed) | |||||
| Employed | 0,1322 | 0,1028 | 1,285 | 0,198802 | 1,1413 |
| Woman's occupation (ref=Unemployed) | |||||
| Employed | 0,1204 | 0,05268 | 2,285 | 0,022295* | 1,1279 |
| Partner's age (ref=Less than 25 years) | |||||
| 25 to 34 years | 0,004632 | 0,07328 | 0,063 | 0,949605 | 1,0046 |
| 35 years and above | 0,09827 | 0,08674 | 1,133 | 0,257276 | 1,1033 |
| The person who usually decide on a woman's earnings (ref=Woman alone) | |||||
| Woman and partner | -0,1904 | 0,04073 | -4,674 | 2,98e-06*** | 0,8266 |
| Partner alone | -0,3589 | 0,07074 | -5,073 | 3,95e-07*** | 0,6984 |
| Someone else | 0,08827 | 0,5098 | 0,173 | 0,862538 | 1,0923 |
| Woman's earning compared to partner (ref=More compared to him) | |||||
| Less compared to him | -0,01754 | 0,06062 | -0,289 | 0,772305 | 0,9826 |
| About the same | -0,3776 | 0,07762 | -4,864 | 1,16e-06*** | 0,6855 |
| Partner does not bring in his earning | -0,435 | 0,1886 | -2,307 | 0,021089* | 0,6473 |
| Don't know | -0,2642 | 0,1443 | -1,83 | 0,067213. | 0,7678 |
| Knows regarding STIs (ref=No) | |||||
| Yes | 0,2874 | 0,4959 | 0,58 | 0,562199 | 1,3330 |
| Interaction effects | |||||
| Wealth index combined (ref=poorest) by contraceptive use (ref=not using) | |||||
| Poorer by using contraceptives | -0,3365 | 0,1243 | -2,708 | 0,006785** | 0,7143 |
| Middle by using contraceptives | -0,4226 | 0,1248 | -3,386 | 0,000711*** | 0,6553 |
| Richer by using contraceptives | -0,3729 | 0,1245 | -2,996 | 0,002743** | 0,6887 |
| Richest by using contraceptives | -0,2243 | 0,1241 | -1,808 | 0,070664. | 0,7991 |
5.5. Interaction Effects
In Fig. (3), we observe that IPV decreases with increasing wealth index for women who use and do not use contraceptives. The results indicate that IPV is higher among women using contraceptives compared to women who are not using contraceptives. The main aim of the interaction effects is to determine which women from the different wealth index classes, i.e., who are using or not using contraceptives, are at a high risk of experiencing IPV.
5.6. Approximation Smooth Function
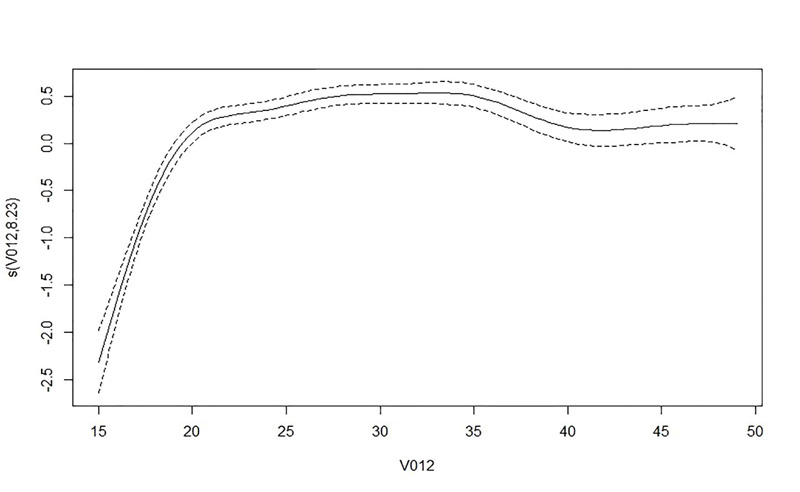
Table 6 shows that the current age of a woman has a significant impact on intimate partner violence. The letter s in Table 6 characterizes the smoothing term, and the value in parenthesis shows the predicted degree of freedom (edf). The test statistics for woman's age (33.92), together with a p-value (<2e-16), shows that there is no linear trend relation with IPV. This is affirmed in Fig. (4), where the trend shows that the age has an effect on an increase in the prevalence of IPV up to approximately 20 years, and thereafter, it remains constant until about 35 years when it starts to decrease until about 40 years; after this age, it starts to show an increase again.
| Smooth Terms | Edf | F-Value | p-Value |
|---|---|---|---|
| s (Woman's current age) | 8.232 | 33.92 | <2e-16*** |
6. DISCUSSION
This work utilized the generalized additive mixed model to explore the risk factors associated with intimate partner violence utilizing nationwide individual women survey data from South Africa and Uganda. Previous studies have utilized parametric models from the GLM family to analyze the data [15, 43, 44]. The parametric models help model the association between a response variable and covariates. The primary idea of non-parametric methods is to enable the data to determine the most appropriate function [36]. Wu and Zhang [41] argue that non-parametric and parametric regression methods are not competitive but complement each other. Combining these two methods may prove to be more potent compared to any single model [36].
The findings of this work show alcohol to be positively associated with IPV. A woman with a partner drinking alcohol had a greater probability of experiencing IPV compared to a woman whose partner did not drink alcohol. The result is consistent with other results from previous works [10, 36, 43, 44]. This may be because alcohol alters cognitive and physical function, minimizes self-control, and leaves individuals incapable of having a non-violent resolution. A woman from a household with more members showed a negative association with IPV. A woman who considered beating from her partner as acceptable showed a higher prevalence of IPV. A woman who regarded beating from the partner as justified showed a higher probability of experiencing IPV. Similar findings were reported by Habyarimana et al. [15]. The findings discussed above are similar in both Uganda and South Africa. A woman who had witnessed her father beat her mother was positively associated with IPV, as she showed a higher prevalence of IPV. This may be because a woman witnessing abuse towards her mother may assume that it is justified for a man to beat a woman.
In comparison, the results from South Africa showed a woman more exposed to the media to have a higher probability of experiencing IPV. In contrast, in Uganda, a woman more exposed to the media showed a low probability of experiencing IPV. The region in which the woman lives is statistically significant to IPV, and the result is consistent with other studies [15], amongst others. In both countries, women from a household, where the head of the house was a female, were at a lower risk of experiencing IPV than women from a household where the head of the house was a male. This might be because in a household where the female is the head of the house, her partner is not always in the house. As the wealth index increases from the poorest, poorer, middle, richer, and richest, there is a lower probability of experiencing IPV. Similar results were found by Habyarimana et al. [10]. A woman who had terminated a pregnancy showed a higher prevalence of IPV. In Uganda, a woman who used contraceptives was at a greater risk of experiencing IPV. Similar results were reported by Habyarimana et al. [10].
In South Africa and Uganda, overweight and obese women showed a lower prevalence of IPV. A married woman or a woman living with a partner showed a higher prevalence of IPV. Similar findings were reported by Usta et al. [45]. In Uganda, the polygamy status was statistically significant; a woman whose partner had other wives/partners was at a higher risk of experiencing IPV. Similar findings regarding polygamy were reported by Jewkes et al. [26] and Koeing et al. [13]. In South Africa, a woman whose partner wanted more children was at a high risk of experiencing IPV; this could be because the partner will be persistent in having children even when the woman does not want to have any more children. A woman whose partner wanted fewer children compared to her was at a high risk of experiencing IPV, and also a woman who did not know regarding her partner's desire for children was at a high risk of experiencing IPV. In Uganda, a woman who did not know regarding her partner's desire for children was at a low risk of experiencing IPV. In Uganda, as the education level of a woman's partner increased, the chances of her experiencing IPV decreased. Similar findings were reported by Usta et al. [45] and Habyarimana et al. [10]. A woman from South Africa who had an employed partner was at a high risk of experiencing IPV. Usta et al. reported similar results [45]. In both the countries, an employed woman was at a high risk of experiencing IPV. A woman from South Africa whose partner was 25 years old and above was at a low risk of experiencing IPV.
In both countries, a woman whose expenditure was decided by the woman and the partner together was at a lower risk of experiencing IPV. Additionally, in Uganda, a woman whose spending was decided upon by her partner alone was at a low risk of experiencing IPV. The risk of the woman experiencing IPV increased with an increase in the woman's age. Similar findings were reported by Bonomi et al. [46] and Obi and Ozumba [16]. In South Africa, a woman who earned about the same as her partner, whose partner did not bring in his earnings, and a woman who did not know what her partner earned, were found to be positively associated with IPV. Similar findings have been recorded by Obi and Ozumba [16]. In Uganda, a woman who earned about the same as her partner and the one whose partner did not bring in his earnings were negatively associated with IPV. This implies that these women are at low risk of experiencing IPV. A woman from South Africa who knew regarding STIs was at a high risk of experiencing IPV. This could be due to the woman asking her partner to use protection in order to avoid infections.
CONCLUSION
This study aimed to find factors that influence intimate partner violence in South Africa and Uganda. In this study, the generalized additive mixed model was used. The factors which were found to be associated with IPV are as follows: whether the woman's father beat her mother or not, partner's alcohol consumption, the number of family members, the perception of the woman towards wife-beating attitude, access to the media, the region in which the woman resides, the sex of the household head, the combined wealth index, body mass index of the woman, current marital status, partner's desire for children, the woman's employment status, the person who usually decides on what to do with the woman's earnings, and the woman's earnings compared to her partner. The additional factors that have been reported for Uganda but have not been statistically significant in South Africa are as follows: the use of contraceptives, polygamy status, and the partner's education level. Furthermore, the following factors were statistically significant in South Africa and statistically insignificant in Uganda: the partner's age and women's knowledge of STIs.
The findings of this study could help government officials target specific communities where women are at a high risk of experiencing IPV based on the factors that are more relevant to them. Door-to-door campaigns aimed for women who are at greater risk of experiencing intimate partner violence could provide additional support and advice on how they can avoid or minimize the risk of being subjected to IPV. The study's key findings suggest an urgent need to enlighten the population through workshops, various social media platforms, and in schools or universities on avoiding high-risk factors for intimate partner violence. The study will help the government control and possibly reduce the high prevalence of IPV by advising women of conceptive age of the principal risks of IPV.
STUDY LIMITATIONS
The current work utilized the cross-sectional datasets from SADHS and UDHS; consequently, it could not take causality into account. Therefore, longitudinal studies are suggested to be carried out in order to solve this problem in future studies.
AUTHORS’ CONTIBUTION
T. Mhelembe analyzed and interpreted the data; contributed reagents, materials, analysis tools or data; and wrote the paper. S. Ramroop and F. Habyarimana contributed reagents, materials, analysis tools or data to the study.
ETHICAL STATMENT
The survey protocol was reviewed and approved by the SAMRC Ethics Committee and the ICF Institutional Review Board. The survey protocol, including biomarker collection, was reviewed and approved by the ICF Institutional Review Board.
CONSENT FOR PUBLICATION
Not applicable.
AVAILABILITY OF DATA AND MATERIALS
The data used in this study are second-hand and cross-sectional from the DHS database.
FUNDING
This work has been funded by Absa Bank Limited.
CONFLICT OF INTEREST
The authors declare no conflict of interest, financial or otherwise.
ACKNOWLEDGEMENTS
The authors acknowledge Statistics South Africa, Uganda Bureau of Statistics, and the ICF through the DHS program for providing the data. The data supporting the findings of the article are available in the DHS database at www.dhsprogram.com.

